

 PDF
PDF ePub
ePub Citation
 Print
Print


INTRODUCTION
Allergic diseases have become a major public health concern worldwide. Allergic reactions are mediated by allergen-specific IgE antibodies (sIgEs) that trigger the release of inflammatory mediators. Therefore, the detection of sIgEs in patient sera is necessary for the diagnosis and appropriate treatment of allergies. Since it was first reported by Helmtraud Ebruster in 1959 [1], the skin prick test (SPT) has been the first-line method to detect IgE-mediated type I (immediate response) allergic reactions, and is still considered a reliable standard for the diagnosis of allergies by many clinicians, given the rapid delivery of strong evidence for sensitization at relatively low costs. Nevertheless, the SPT is a rather invasive method because each allergen has to be delivered to the patient by pricking the skin with a needle or a pin carrying a small amount of the allergen that can cause allergic symptoms, including a skin rash, swelling, nausea, and even anaphylaxis [12]. Moreover, the SPT results are not quantitative and are difficult to standardize [3]. For these reasons, the in vitro detection of sIgEs has emerged as an important tool for screening allergic diseases.
Indeed, substantial progress has been made in the development of in vitro sIgE detection assays that provide highly reproducible and sensitive methods. The currently available tests include the radioallergosorbent test (RAST), multiple allergen simultaneous test (MAST), and ImmunoCAP system (Thermo Scientific, Uppsala, Sweden). The once market-leading RAST method is no longer popular, since this is considered to be a rather inefficient and expensive method compared with others [4]. Thus, this assay has been replaced with the ImmunoCAP system as the generally accepted reference method as it provides an accurate and quality-controlled assay for the in vitro detection and measurement of sIgEs [567]. The CAP system uses a pool of a cellulose sponge matrix coated with mixture of allergen extracts or component allergens to capture sIgEs in the patient's serum, which are then detected using an enzyme-linked anti-IgE antibody via an enzymatic reaction [8]. This system is conferred with improved performance by maximizing the surface area of the solid phase to be able to bind all clinically relevant proteins of allergen extracts. As a downside, the CAP system requires an individual assay to be conducted for each allergen of interest, increasing the costs [9]. Thus, despite offering a robust assay system, ImmunoCAP is based on a singleplex assay format and is not suitable for first-line screening because of the restricted number of allergens that can be screened simultaneously. In contrast, the MAST system uses a panel of multiple allergen extracts, enabling screening of patient serum against multiple allergens simultaneously, even with a limited amount of serum in a cost-efficient manner [10]. The representative commercialized MAST platforms include AdvanSure Allergy Screen from LG Life Sciences (Daejun, Korea), Advia Centaur Immunoassay Systems from Siemens (München, Germany), and Polycheck from Biocheck GmbH (Munster, Germany). Although useful, the results obtained from MAST are often only semi-quantitative, and relatively low sensitivity and accuracy have been reported as the main drawbacks [1112].
To overcome these limitations of current screening methods, we developed an allergen microarray, termed “GOLD chip,” that enables quantitative and simultaneous detection of sIgEs in patient sera against multiple allergens. We aimed to achieve high sensitivity and specificity, comparable to those of ImmunoCAP. We conducted assay performance tests and concordance analysis in comparison with the AdvanSure Allergy Screen and ImmunoCAP.
METHODS
1. Serum samples and allergy testing
Serum samples of 150 patients with allergic rhinitis (AR) were collected at the Gil Medical Center, Gachon University, Incheon, Korea (Table 1). Each serum sample was divided into three aliquots, and each aliquot was used for AdvanSure, ImmunoCAP, and GOLD (Gil Hospital, Won Medical, LabGenomics, Dongguk University) chip-based screening. This study was approved by the Institutional Review Boards of Gachon University Gil Medical Center (IRB no. GBIRB2015-46) and Dongguk University (IRB no. DUIRB-20151127-013) (Seoul, Korea). Informed consent was obtained from each patient.
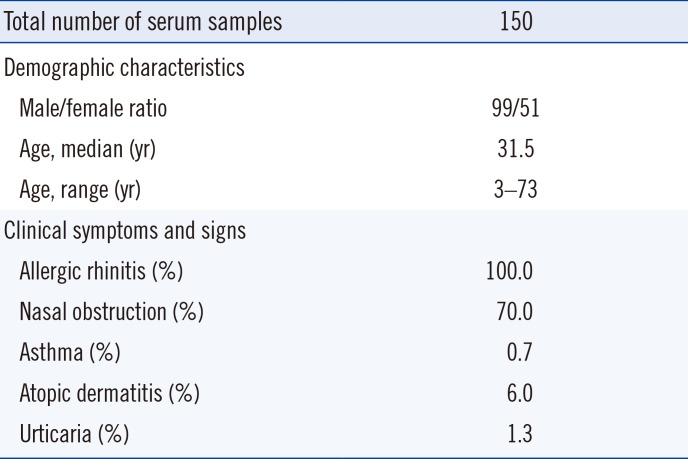
Table 1
Characteristics of study participants
![]()
2. Allergens and serological parameters
sIgE was measured against 42 allergens using AdvanSure Allergy Screen according to the manufacturer's protocol. The results were scored in classes from 0 to 6 as follows: 0 (< 0.35 IU/mL), 1 (0.35–0.7 IU/mL), 2 (0.7–3.5 IU/mL), 3 (3.5–17.5 IU/mL), 4 (17.5–50 IU/mL), 5 (50–100 IU/mL), and 6 (> 100 IU/mL).
The concentrations of sIgEs produced in response to selected allergens (based on the AdvanSure screening results) were also measured using ImmunoCAP, according to the manufacturer's protocol. Each serum sample was screened against a maximum of six allergens. The concentrations of each sIgE along with the class (0–6, as defined above) were reported. In both cases, any result of class 2 or more was defined as positive.
3. Construction of allergen microarrays
Allergen microarrays were constructed by spotting allergens onto an H slide using OmniGrid 100 microarray (GeneMachines, CA, USA) (Fig. 1A). Lyophilized allergens were first solubilized in phosphate-buffered saline (PBS, pH 7.4; Sigma, St. Louis, MO, USA), whereas the dissolved allergens were used in their presented form. The tested allergen sources included Dermatophagoides pteronyssinus, Alternaria alternata, dog dander, oxeye daisy, ragweed, rye, and oak extracts from Greer (Lenoir, NC, USA); Dermatophagoides farina, birch-alder mix, cockroach, ash, dandelion, goldenrod, Acacia, Cladosporium herbarum, Bermuda grass, and hazelnut extracts from Allergon (Välingevägen, Sweden); cat dander and reed extracts from Squarix (Marl, Germany); pigweed and Timothy grass extracts from Bencard (München, Germany); Japanese hop extracts from Yonsei University (Seoul, Korea); and mugwort and Aspergillus fumigatus extracts from Lofarma (Milano, Italy), as well as egg white, soybean, peach, milk, crab, shrimp, Japanese cedar, sycamore mix, orchard grass, ash mix, dandelion, sallow willow, Russian thistle, Penicillium notatum, poplar mix, sweet vernal grass, pine, and mackerel. PBS and biotinylated goat anti-human IgE antibody (ε chain-specific; VectorLab, Burlingame, CA, USA) were used as negative and positive controls, respectively. Allergen solutions were mixed with the same volume of 3X saline sodium citrate buffer (Schott, Mainz, Germany). The selected allergens and controls were printed in triplicate on a glass slide (Nexterion® slide H; Schott, Mainz, Germany) coated with hydrophilic polymers presenting N-hydroxysuccinimide (NHS) ester residues (Fig. 1B). The microarrays were generated by spotting 0.2 ng of the allergens in arrays of 200-µm-diameter spots at a spot-to-spot distance of 300 µm. The size of an array was 5×3 mm. Four arrays were printed on each glass slide and were separated by a hybridization chamber (Fig. 1A, center). After spotting, the allergen chips were stored at 4℃ for at least 24 hours before use.
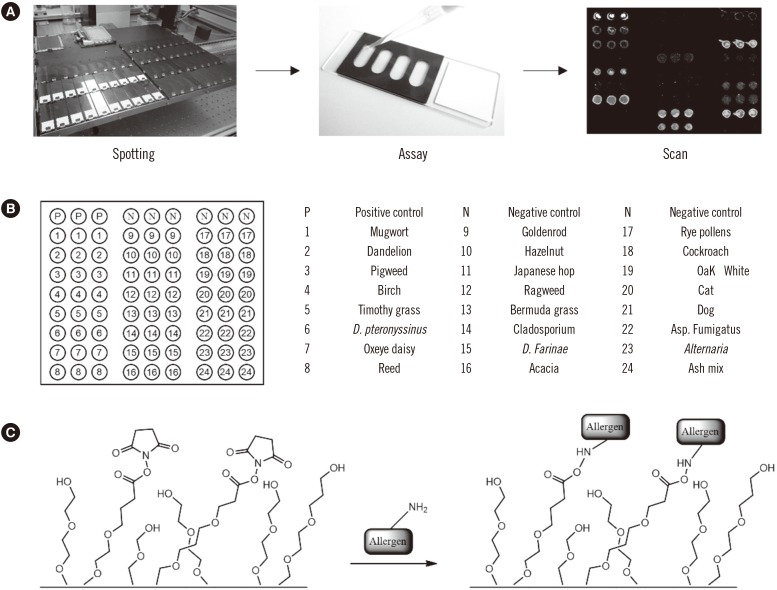
Fig. 1
Schematic representations of the GOLD chip and the detection of allergen-specific IgEs. (A) Allergens are spotted onto hydrophilic polymer-coated glass slides in triplicate for immobilization. The assay is performed in a silicon chamber and the results are analyzed by fluorescence scanning. (B) Schematic representation of the array. The circles represent the spotting positions of the allergen extracts (in triplicate). (C) The allergens are immobilized via covalent bond formation between the NHS ester on the activated slide and an amine on the protein surface.
![]()
4. Immunoassay
The allergen microarray was exposed to 2% bovine serum albumin (BSA; BioBasic, Markham, ON, Canada) in PBST [PBS containing 0.1% Tween-20 (Amresco, Solon, OH, USA)] for 1 hour, washed with PBST, and incubated with 30 µL of human serum diluted in the same volume of PBST containing 2% BSA for 1 hour using the hybridization chamber. The slide was washed with PBST, incubated with a solution of detection antibody (biotinylated anti-human IgE, 0.5 µg/mL) in PBST containing 0.2% BSA for 1 hour, and then incubated with streptavidin-Cy3 (SA-Cy3) conjugate (1 µg/mL; Sigma-Aldrich, St. Louis, MO, USA) in PBST containing 0.2% BSA for 15 minutes in the dark. The slide was washed with PBST and distilled water sequentially, and then dried using compressed air. All steps were carried out at 25℃. The binding of allergen sIgE on spotted allergens was then detected by sequential treatment with the detection antibody and SA-Cy3 conjugate. sIgEs were visualized using a fluorescence scanner.
5. Scanning
The Cy3 fluorescence intensity was measured using a GenePix 4000B fluorescence scanner (Axon Instruments, Union City, CA, USA) at an excitation wavelength of 532 nm and an emission wavelength of 570 nm. The image files were analyzed using GenePix Pro Microarray Analysis Software (Axon Instruments). Three intensity values for each allergen were obtained from triplicate runs. For calibration, a negative control experiment was conducted to determine the background fluorescence intensity. The average fluorescence intensity was calculated and used for analysis. The fluorescence intensity corresponding to 0 and 100 IU/mL for each allergen was calculated from the least-squares fitting and used for unit conversion when needed.
6. Reproducibility test
CVs were determined by intra-assay, inter-assay, and batch-to-batch comparisons. For the determination of intra-assay precision, the mean CVs were calculated on the basis of five replicates. Inter-assay precision was determined as the mean CV obtained from three assays performed in separate chambers on the same slide. The batch-to-batch comparison was conducted using slides manufactured on different days. CV values were calculated on the basis of results of five independent assays, and each assay was carried out in triplicate. The CVs were calculated using the following equation:
7. Statistical analysis
Correlations between the ImmunoCAP results (0–100 kU/L), AdvanSure class (0–6), and GOLD chip signal intensity (0–66000 AU) were analyzed using Pearson's correlation test. Cohen's kappa was calculated to determine the rate of agreement between assays. We categorized kappa values (κ) as almost perfect (0.8–1.0), substantial (0.6–0.8), moderate (0.4–0.6), fair (0.2–0.4), and poor (< 0.2). We then calculated the positive and total agreement percentages for each assay according to a previously reported method [13] as follows:

Prism software (GraphPad, La Jolla, CA, USA) was used for the statistical analysis and plotting of the correlation curves.
RESULTS
1. Construction and calibration of allergen microarrays
Among various platforms for the in vitro detection of target biomolecules, microarrays provide a unique opportunity as they allow for the high-throughput screening of multiple targets simultaneously with increased sensitivity and selectivity [1415]. To construct the allergen microarray, we selected 24 allergens that are considered to be the main causal agents of AR and other allergic symptoms. The list of allergens was determined on the basis of the frequency of causative allergens from reported cases [161718], including house dust mites, various pollens, as well as pet dander (Fig. 1B). Each slide included negative (1×PBS buffer) and positive (biotinylated anti-human IgE antibody) controls. The selected allergens and controls were spotted on an activated substrate presenting NHS ester and a hydrophilic polymer (Fig. 1C). The microarray was designated “GOLD chip.”
2. Evaluation of microarray-based detection of sIgEs: qualitative detection and quantitative measurement
The assay to detect allergen-specific IgE in patient sera was performed as described elsewhere, with the necessary modification and optimization [1920212223]. In brief, the allergen microarray slide was incubated with PBST buffer containing 2% BSA before the assay to minimize the non-specific adsorption of random proteins.
Under the optimized condition, we first performed a quantitative evaluation using standard anti-D. pteronyssinus human IgE of known concentration [24]. The test samples were prepared by diluting the standard sIgE to obtain a series of eight concentrations ranging from 0.3 to 50 IU/mL. Each sample was analyzed with the microarray presenting D. pteronyssinus extract. The experiment was performed using two concentrations of detection antibody (0.5 and 1 µg/mL). The plot of fluorescence intensity versus sIgE concentration showed a positive linear correlation within the range of concentrations tested when 0.5 µg/mL of detection antibody was used (Fig. 2A). When the concentration of detection antibody increased to 1 µg/mL, a similar trend was observed; however, signal saturation occurred when the concentration of sIgE exceeded 50 IU/mL. The limit of detection (LOD) was lower than 0.3 IU/mL in both cases, which satisfies the requirement for the commercial allergy IVD assay kits.
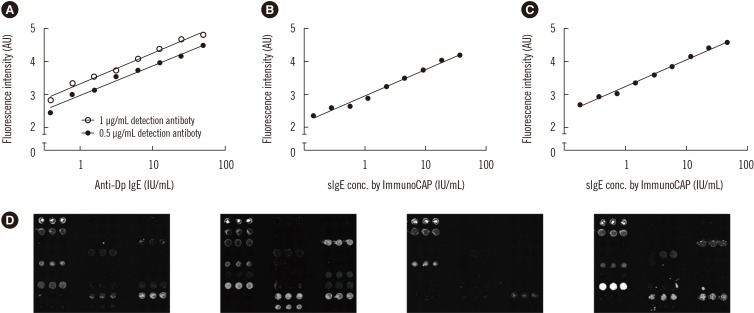
Fig. 2
Analysis of allergen microarray-based assays. (A) The concentration of allergen-specific IgE (sIgE) was measured quantitatively using standard human IgEs. (B) Quantitative evaluation of varying amounts of sIgE for D. pteronyssinus in human sera. (C) Quantitative evaluation of varying amounts of sIgE for D. farinae in human sera. (D) Sera from four patients displaying different sIgE profiles.
![]()
Quantitative evaluation was then carried out using a pool of patient sera containing sIgEs to D. pteronyssinus and D. farinae. The sample was prepared by pooling serum samples from five patients who scored class 4+ in the ImmunoCAP serology test; the concentrations of sIgEs to D. pteronyssinus and D. farinae in the pooled sera were determined to be 72 IU/mL and 93 IU/mL by ImmunoCAP, respectively. The test samples were prepared in nine-fold geometric dilutions of pooled sera, starting at 1:2, and screened with the microarray presenting D. pteronyssinus and D. farinae spots. The plots of fluorescence intensity versus sIgE concentration to each allergen showed the expected positive linear correlation (See Supplemental Data Table S1, Fig. 2B, C), suggesting that the allergen microarray can provide uantitative information on the concentration of sIgEs. The result also showed that our system has an LOD<0.35 IU/mL.
3. Precision and repeatability of GOLD chip-based assays
As the GOLD chip assay was successfully applied for the quantitative detection of sIgEs to D. pteronyssinus and D. farinae, it was further tested for the detection of sIgEs to other allergens. The assay was conducted using patient sera with different sensitization patterns, resulting in different microarray patterns when visualized by fluorescence scanning (Fig. 2D). Before analyzing the diagnostic result, we first examined assay precision and repeatability by determining the CVs to assess intra-assay variability (0.4–3.8%), which is the variation between three spots in one array, inter-assay variability (2.4–11.4%), which reflects variation between three arrays in one slide, and batch-to-batch variability (3.6–25%), which reflects variation between three different slides (Table 2). Assay variation often results from irregularity in chip production and from the instability of assay protocols. The loss of transiently immobilized allergens during the assay, as well as the protein fouling on the microarray surface, could also be the main causes of observed variation. Nevertheless, the CV values for the microarray assays were considerably lower than those for previously reported assay platforms [2325], indicating improved precision and repeatability.
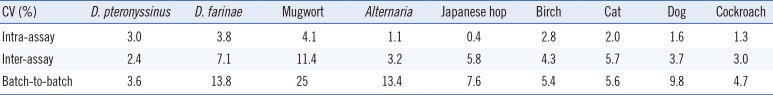
Table 2
Reproducibility of microarray testing of allergen-specific IgE
![]()
4. Comparison of the GOLD chip with ImmunoCAP and AdvanSure
We then compared the data obtained from the GOLD chip with those obtained from ImmunoCAP and AdvanSure. ImmunoCAP was selected because it is currently considered one of the best-performing IVD platforms for allergic diseases. AdvanSure was selected as the representative MAST platform because it is the most widely used MAST platform in Korea.
Serum samples from 150 AR patients were analyzed against 24 allergen extracts using the GOLD chip, ImmunoCAP, and AdvanSure systems (Fig. 3 and Table 3). First, the call agreement rate was determined for each pair of assays, i.e., GOLD vs ImmunoCAP, ImmunoCAP vs AdvanSure, and GOLD vs AdvanSure. We used class 2 as the cut-off level of positive results for both ImmunoCAP and AdvanSure, as suggested by the manufacturers, in calculating the agreement percentage for positive and negative calls. The cut-off for a positive result from the GOLD chip was determined as the fluorescence intensity corresponding to 0.7 IU/mL of IgE for each allergen extract [262728]. The overall total agreement rates were 92.2% for GOLD vs Immuno-CAP, 66.1% for ImmunoCAP vs AdvanSure, and 66.1% for GOLD vs AdvanSure (Table 3). The average kappa value was 0.80 for GOLD vs ImmunoCAP for all allergens tested, which suggests substantial correlation between the two assay platforms. In detail, 12 of the 24 allergens tested (Japanese hop, dog dander, cat dander, cockroach, ash, dandelion, oxeye, Timothy grass, acacia, reed, oak, and hazelnut) showed perfect correlation, seven allergens (D. pteronyssinus, D. farinae, Alternaria, goldenrod, rye, A. fumigatus, and Cladosporium) showed substantial correlation, four allergens (birch, mugwort, pigweed, and ragweed) showed moderate correlation, and Bermuda grass showed fair correlation. In contrast, the kappa values for ImmunoCAP vs AdvanSure and GOLD vs AdvanSure were both 0.19, indicating a weak correlation.
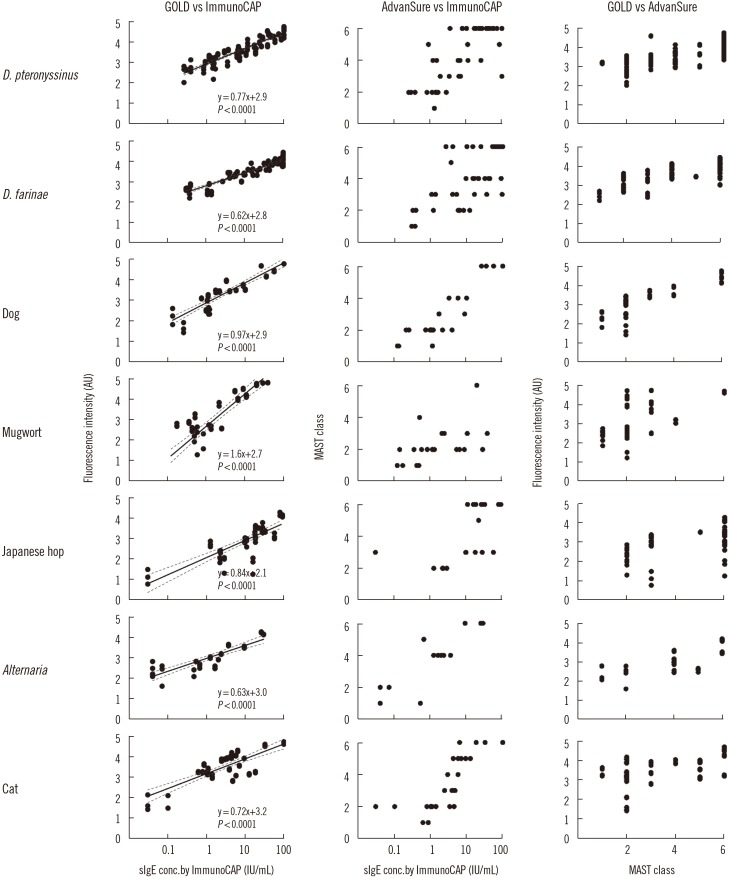
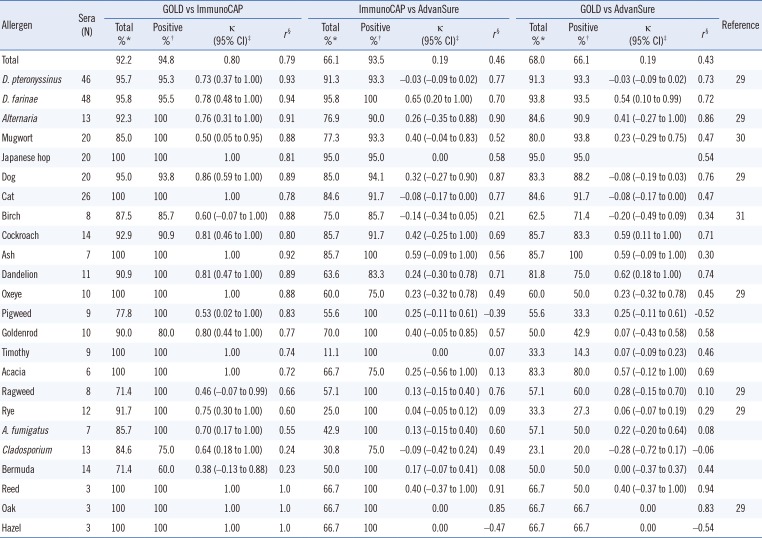
Fig. 3
Correlation analysis of three in vitro diagnostic platforms: GOLD chip, ImmunoCAP, and AdvanSure. The sera of 150 patients with allergy were screened for seven of the most common allergens, and the amount of allergen-specific IgE (sIgE) measured by each platform was plotted for Pearson's correlation analysis.
![]()
Table 3
Agreement and correlation analysis between GOLD chip, ImmunoCAP, and AdvanSure
![]()
We then calculated Pearson's correlation coefficient (r) after taking the log of the sIgE concentrations and fluorescence intensities for each pair of assays. The calculated r values were 0.79 for GOLD vs ImmunoCAP, 0.46 for ImmunoCAP vs AdvanSure, and 0.43 for GOLD vs AdvanSure. These results suggested that there is a much stronger correlation between GOLD and ImmunoCAP than between ImmunoCAP and AdvanSure. For GOLD vs ImmunoCAP, the r values were 0.23–0.94, and 21 out of 24 screened allergens scored over 0.60. Moreover, the correlation for D. pteronyssinus and D. farinae, which are the most frequent causal agents of AR, was excellent (r >0.93).
To visually examine the correlations, we selected seven of the most frequent allergens for testing with more than 20 positive serum samples and generated scatter plots showing the concentrations of sIgEs measured by the various assay platforms (Fig. 3). The r values for ImmunoCAP vs AdvanSure ranged between −0.47 and 0.90. For all analyses, the highest agreement and correlations were found between GOLD and ImmunoCAP. These results demonstrate that the GOLD chip-based assays can not only distinguish the positive and negative serum samples with improved accuracy but also provide a precise and quantitative measurement of sIgE concentrations that correlate well with the results of ImmunoCAP.
DISCUSSION
We developed and tested an allergen microarray-based assay platform termed “GOLD chip” for application in in vitro detection of allergic diseases. This platform has several advantages over other platforms. First, the microarray format allows for parallel and simultaneous assays of multiple allergen extracts using a small amount of sample volume (<30 µL), with improved accuracy. Second, the use of a planar substrate allows for the easy removal of the remaining reagents, facilitating automation and shortening the turn-around time. Third, the high-density microarrays allow for high-throughput assays in various biological and medical screening purposes. For example, the microarray format has been utilized for component resolved diagnostics using over 100 component allergens in ImmunoCAP ISAC®. The ImmunoCAP ISAC® offers an improved diagnostics platform by enabling component resolved diagnostics with evident advantages for polysensitized patients with sIgE for pan-allergens and/or cross-reactive allergens. Despite this advantage, the Immuno-CAP ISAC® cannot fully substitute for the MAST platforms due to the limited sensitivity and absence of some important allergenic components. Thus, there is a need for first-line screening platforms that enable screening against multiple allergen sources prior to the identification of causative component allergens [32].
As a substrate for the microarray, we exploited a NHS-functionalized glass coated with hydrophilic polymers. The NHS ester was used to form a covalent bond with the amine functional group on the protein surface, ensuring the irreversible and stable immobilization of allergen probes. The hydrophilic polymer coating was needed to avoid non-specific adsorption of random proteins and to minimize protein fouling, lowering background signals. This platform has advantages over conventional platforms that use non-specific adsorption of allergens on threads or nitrocellulose membranes. First, the loss of immobilized proteins during the course of assays is minimal, thereby increasing the assay sensitivity. Second, the platform is compatible with various detection methods, including optical and electrical monitoring. We were able to adopt fluorescence-based detection for the assay, while other MAST platforms, such as AdvanSure and Advia, utilize chemiluminescence-based technology. Fluorescence detection is considered more sensitive and quantitative within the linear response range [33].
To gauge the performance of the GOLD chip, we performed assays using standard IgE and patient sera, and compared the results with those of ImmunoCAP. Various assay parameters of the GOLD chip showed improved sensitivity and reliability. The determined LOD was below 0.35 IU/mL, which is generally accepted for commercial assay platforms, and the measured CV values were considerably lower than those reported previously [2325]. The GOLD chip-based assays provided quantitative results over a linear concentration range for sIgEs from 0.35 to 100 IU/mL. The target specificity of the GOLD chip-based assays was confirmed by calculating the agreement percentage and Cohen's kappa analysis, showing excellent agreement with ImmunoCAP. Pearson's correlation analysis also indicated that the concordance between ImmunoCAP and GOLD chip was better than that between ImmunoCAP and AdvanSure. These results strongly suggest that the GOLD chip provides a sensitive, reproducible, quantitative, and multiplexed assay platform that can replace current platforms. We also believe the reliability of our assay could be further improved by increasing the number of negative samples, given that in the present analysis the small number of negative samples was outweighed by the large number of positive samples. The GOLD chip can also be used for pre-screening in personalized allergy immunotherapy and detection of antigen-induced human IgG for improving the diagnostics of various immune diseases [343536].
 XML Download