

 PDF
PDF ePub
ePub Citation
 Print
Print


INTRODUCTION
Liver fibrosis, defined as the excessive accumulation of extracellular matrix, can occur in all chronic liver diseases (CLD) [12]. Progressive liver fibrosis is a major cause of morbidity, ultimately resulting in hepatocellular carcinoma (HCC) and death without proper treatment [3]. Although liver fibrosis has been considered irreversible, liver fibrosis regression has been achieved by alleviating hepatic inflammation and damage with potent antiviral agents [4]. Accurate assessment and monitoring of the degree of liver fibrosis is important for the management of patients with CLD [5].
Liver biopsy (LB) has long been regarded as the reference method for assessing and grading liver fibrosis [6]. However, it is invasive and has limitations including sampling errors, inter- and intra-observer variability, and procedural complications [67]. It is difficult to perform repeated LB examinations to monitor fibrotic burden in clinical practice; thus, many noninvasive methods have been suggested as an alternative to LB [7]. Transient elastography (TE) measures liver elasticity using a low frequency elastic wave transmitted through the liver and is considered a highly reproducible and reliable option for grading liver fibrosis, except in some cases such as obesity [58910].
Suggested blood biomarkers range from simple tests using routine laboratory parameters, such as the aspartate aminotransferase-to-platelet ratio index (APRI), to more complex equations such as the FibroTest (FT) or Enhanced Liver Fibrosis (ELF) Test (Siemens Diagnostics, Tarrytown, NY, USA) [1112]. Recently, glycosylation isomer of Mac-2 binding protein (M2BPGi, Wisteria floribunda agglutinin [WFA]-positive Mac-2 binding protein, WFA+-M2BP) has emerged as a novel biomarker for estimating liver fibrosis and predicting HCC; however, this biomarker has been evaluated mainly in Japanese populations [13141516]. Galectin-3 and the soluble isoform of suppression of tumorigenicity 2 (sST2) have emerged as biomarkers of heart failure (HF), mainly reflecting cardiac fibrosis [1718]. These proteins are involved in inflammation and fibrosis in various, non-cardiac conditions [192021] and play prognostic roles [2223]. Given their possible involvement in liver fibrosis, further investigations could shed important light on these markers [24].
This study aimed to evaluate the usefulness of four new biomarkers, ELF, M2BPGi, galectin-3, and sST2, for assessing liver fibrosis status. We examined the association of these biomarkers with fibrosis grade and determined the optimal cut-off values for their application in patients with CLD. In addition, we evaluated the association between these biomarkers and prognostic scores.
METHODS
1. Study population
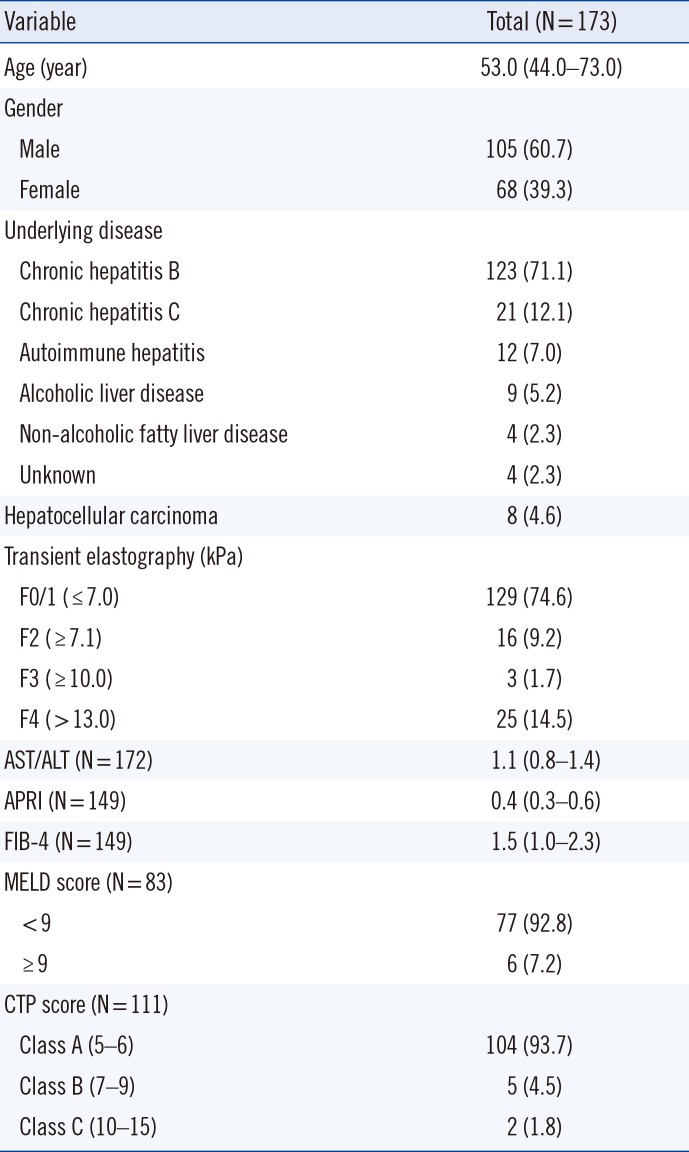
This study was approved by the Institutional Review Board (KUH1200072) of the Konkuk University Medical Center, Seoul, Korea, prior to collecting the first sample from the first patient. We included a total of 173 patients (105 males and 68 females) with CLD, who visited our center from October 2016 to February 2017 and completed TE and blood sampling on the day. We excluded patients when their TE measurements failed or their residual blood samples were insufficient for other tests. To evaluate prognosis, the model for end-stage liver disease (MELD) and Child-Turcotte-Pugh (CTP) scores were calculated at enrollment [2526]. Clinical and laboratory data, including underlying diseases, APRI, and fibrosis-4 index (FIB-4), were collected by reviewing the medical records. The characteristics of the study population are summarized in Table 1.
TE was performed by a well-trained technician using the FibroScan device (Echosens, Paris, France), as previously described [9]. TE results with at least 10 valid measurements and a success rate of at least 60% were considered reliable. The degree of fibrosis was graded as follows: F0/1≤7.0 kilopascal (kPa), presumed no or minimal fibrosis; F2≥7.1 kPa, presumed moderate fibrosis; F3≥10.0 kPa, presumed severe fibrosis; and F4≥13 kPa, presumed cirrhosis [10].
The residual samples were collected following routine blood tests, divided into small aliquots to avoid repeated freezing and thawing, and then stored at −70℃ until use. Frozen samples were thawed at room temperature (20 to 26℃) and gently mixed immediately prior to biomarker measurement. The data were analyzed anonymously and this study required neither study-specific intervention nor any other intervention; therefore, written informed consent from enrolled patients was exempted.
2. Assays
For the ELF test, hyaluronic acid (HA), tissue inhibitor of matrix metalloproteinases-1 (TIMP-1), and aminoterminal propeptide of procollagen type III (PIIINP) concentrations were measured using an ADVIA Centaur XP automated immunoanalyzer (Siemens Healthcare Diagnostics, Tarrytown, NY, USA). ELF values were calculated using the algorithm (ELF=2.278+0.851 ln[HA] +0.751 ln[PIIINP]+0.394 ln[TIMP-1]). The values were interpreted as: <7.7, none to mild; ≥7.7 −<9.8, moderate; and ≥9.8, severe, according to the manufacturer's recommendation; results above moderate (≥7.7) were considered positive [27]. M2BPGi was measured using an HISCL-5000 immunoanalyzer (Sysmex Co., Kobe, Japan) based on the 2-step sandwich chemiluminescent enzyme immunoassay [13]. The measured values of M2BPGi conjugated to WFA were indexed with obtained values using the following equation: cut-off index (COI)=(S-N)/(C-N), where S is the light intensity of the sample, C is the cutoff value, and N is the light intensity of the negative control. The positive control was supplied as a calibration solution preliminarily standardized to yield a COI value of 1.0. The sample was considered positive when the COI was >1.00 (1+, 1.00≤COI <3.00; 2+, COI≥3.00) [13]. Galectin-3 concentrations were measured using the VIDAS automated enzyme-linked fluorescent assay (bioMérieux, Marcy-l'Etoile, France). sST2 concentrations were measured using the Presage ST2 Assay (Critical Diagnostics, San Diego, CA, USA), which is based on a quantitative sandwich monoclonal ELISA.
3. Statistical analysis
Data were expressed as median and interquartile range (IQR) or number and percentage. The difference between the continuous variables was analyzed using the Mann-Whitney U test, and the difference between categorical variables was analyzed using the chi-square test, Fisher's exact test, or the Cochran-Armitage test for trend. Differences between biomarkers were assessed according to TE grade (F0/F1, F2, and F3/4), MELD score, and CTP score. Agreement between assays was determined using Cohen's Kappa statistic (agreement: <0.20, none; 0.21–0.39, minimal; 0.40–0.59, weak; 0.60–0.79, moderate; 0.80–0.90, strong; >0.90, nearly perfect) [28]. The TE grade prediction performance of each biomarker (F≥2 and F≥3) was assessed using ROC curves. The area under the curve (AUC) with 95% confidence interval (CI) was calculated; good performance was defined as AUC >0.8 [29]. The TE grade prediction sensitivity and specificity of each biomarker were also calculated. Statistical analysis was performed using MedCalc Statistical Software (version 15.8, MedCalc Software, Mariakerke, Belgium) and IBM SPSS Statistics 22.0 (IBM Corporation, Armonk, NY, USA). P <0.05 was considered statistically significant.
RESULTS
1. Comparison of biomarkers according to TE grade
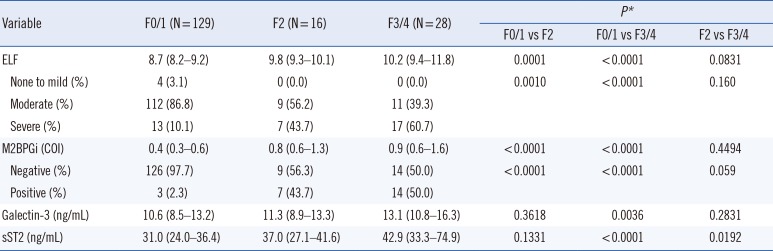
ELF, M2BPGi, galectin-3, and sST2 values differed significantly according to TE grade (Table 2 and See Supplemental Data Fig. S1). All four biomarkers increased in F3/4 compared with F0/1 (P <0.0001 except galectin-3, P =0.0036). ELF and M2BPGi values were higher in F2 than in F0/1 (P ≤0.001, all); however, no significant differences were observed between F2 and F3/4. In contrast, sST2 concentration increased in F3/4 compared with F2 (P =0.0192); however, no significant difference was observed between F0/1 and F2. The positivity of ELF and M2BPGi increased according to TE grade (both P <0.0001 by Cochran-Armitage test for trend).
2. Comparison of ROC curves for prediction of TE grade
Both ELF and M2BPGi predicted TE grade F≥2 and F≥3 with good performance (AUC of 0.841 and 0.837, respectively, for ELF; AUC of 0.833 and 0.808, respectively, for M2BPGi; Fig. 1). The AUCs of ELF and M2BPGi were greater than those of galectin-3 and sST2 for detecting TE grade F≥2 (P =0.0002, 0.0053 and P =0.0011, 0.0152, respectively). TE grade F≥2 prediction sensitivity and specificity were 84.1% and 76.7% for ELF and 63.6% and 91.5% for M2BPGi. For TE grade F≥3, only ELF showed a greater AUC compared with galectin-3 (P =0.0199).
3. Distribution and agreement of fibrosis grades according to TE, ELF, and M2BPGi
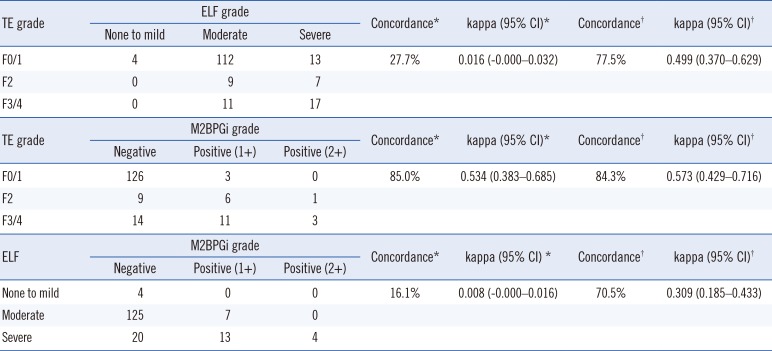
Concordance and agreement between TE grade, ELF, and M2BPGi were determined using both the manufacturer-suggested cut-off values for ELF and M2BPGi (7.7 and COI of 1.0, respectively) and their optimal cut-off values derived from ROC curve analyses (ELF>9.2; M2BPGi, COI of 0.71). Using the pre-set cut-off values for detecting TE grade F≥2, only M2BPGi showed a concordance of 85.0% with weak agreement (kappa 0.534, 95% CI=0.383–0.685; Table 3). The concordance between TE grade and ELF and between ELF and M2BPGi was very low (27.7% and 16.1%, respectively) with no agreement. When the optimal cut-off values for ELF and M2BPGi were used, the concordance between TE, ELF, and M2BPGi improved, ranging from 70.5% to 84.3%.
4. Comparison of each biomarker according to MELD and CTP scores
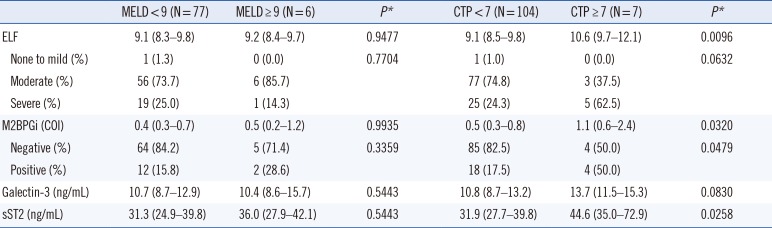
The distribution of the four biomarkers did not differ between high and low MELD scores (Table 4). In terms of CTP scores, the distribution of ELF, M2BPGi, and sST2 values differed significantly between high and low CTP scores (P =0.0096, 0.0320, and 0.0258, respectively).
DISCUSSION
We evaluated the usefulness of the emerging biomarkers ELF, M2BPGi, galectin-3, and sST2 for assessing liver fibrosis and prognostic values in CLD. All biomarker values differed significantly according to fibrosis grade; ELF (≥7.7 score) and M2BPGi (≥1+) liver fibrosis positivity increased significantly according to TE grade (both P <0.0001) (Table 2 and See Supplemental Data Fig. S1). However, the distribution patterns of the biomarkers varied. While ELF and M2BPGi could discriminate F0/1 and F2, they could not discriminate F2 and F3/4. In contrast, sST2 could discriminate F2 and F3/4, but could not discriminate F0/1 and F2. Compared with ELF and M2BPGi, sST2 appears to be related to more advanced fibrosis grades.
ELF and M2BPGi use different targets for assessing fibrosis. ELF incorporates HA, TIMP-1, and P3NP, which are all involved in extracellular matrix synthesis and degradation [30]. During the progression of liver disease and fibrosis, the N-glycosylation of M2BP is altered, and it binds to galectin-3, β-1 integrins, collagens, and fibronectin [15]. M2BPGi assays measure the WFA-positive, glycosylation isomer of M2BP. Previous studies have shown that ELF has a better ability to discriminate moderate fibrosis (F≥2) [31], whereas M2BPGi possesses a better capacity to discriminate severe fibrosis (F≥3) [13]. However, our data did not show this trend; thus, further studies are needed to gain more insight.
ELF and M2BPGi were comparable in ROC curve analyses, exhibiting equally good performance for detecting TE grade F≥2 and F≥3 (Fig. 1). Considering the number of laboratory markers, M2BPGi, which uses a single marker, would be a more practical option than ELF, which requires three markers. However, the respective agreement between TE, ELF, and M2BPGi was weak (Table 3); the reported values of ELF and M2BPGi were interpreted semi-quantitatively using manufacturer-provided, pre-defined cut-off values. Our data indicate that the optimal cut-off values of ELF and M2BPGi for detecting liver fibrosis differed from the manufacturer-provided cut-off values (9.2 vs 7.7 and 0.71 COI vs 1.00 COI, respectively). Using the manufacturer-recommended cut-off (7.7), ELF showed too many positive results compared with TE and poor agreement with TE or M2BPGi. A higher cut-off value would be desirable to improve the performance of ELF. The recent guidelines of the National Institute for Health and Care Excellence (NICE) recommend the use of ELF for monitoring advanced liver fibrosis in non-alcoholic fatty liver disease and suggest a cut-off of 10.51 [32].
To the best of our knowledge, this is the first study to evaluate the four biomarkers, ELF, M2BPGi, galectin-3, and sST2, in association with liver fibrosis. Galectin-3, a paracrine factor mainly secreted by activated macrophages, has been identified as a critical regulator in inflammation and fibrogenesis [19], while sST2 is known to be involved in non-cardiac inflammation [21]. Both are promising markers for systemic inflammation and fibrosis process, and their evaluation in various clinical conditions would be valuable. In this study, galectin-3 and sST2 increased significantly in liver fibrosis; however, their ability to detect liver fibrosis was not superior to that of the more specific and validated liver biomarkers, ELF and M2BPGi. Galectin-3 and sST2 might reflect systemic fibrosis rather than organ-specific fibrosis. Further studies are necessary to elucidate the diagnostic and prognostic roles of galectin-3 and sST2 in relation to liver fibrosis. Regarding prognosis, although all four biomarkers were unrelated to MELD score, higher values of ELF, M2BPGi, and sST2 were associated with high CTP score (Table 4). Additional data are required to evaluate the independent roles of these biomarkers in prognosis prediction.
This study has several limitations. We could not assess the degree of liver fibrosis based on LB, which is still considered the gold standard; however, its utilization is restricted because of invasiveness and has been mostly replaced by non-invasive approaches [10]. From a practical viewpoint, it was difficult to enroll patients who had undergone LB, because our hospital uses TE to assess liver fibrosis in most routine situations. Recently, a non-invasive approach implementing both elastographic and serologic tests has been proposed. In this approach, the concordance between elastographic and serologic tests is assessed and LB is limited solely to patients with discordant results [33]. In addition, our study population was not sufficiently large for each grade of liver fibrosis, especially high-grade fibrosis. Because the performance of each biomarker may differ according to fibrosis grade, further large-scale studies would be needed to elucidate the clinical usefulness of each biomarker. Our study focused on novel, potential fibrosis markers; thus, we excluded the analysis of conventional markers, including APRI or FIB-4, because they have been extensively studied.
In conclusion, we evaluated four potential biomarkers, ELF, M2BPGi, galectin-3, and sST2, for assessing liver fibrosis in patients with CLD. The values of each biomarker differed significantly according to fibrosis grade and showed a different trend. ELF and M2BPGi exhibited equally good performance for detecting moderate and severe liver fibrosis. Optimal cut-off values should be applied for the interpretation of liver fibrosis, following validation in each population. Large-scale, prospective studies are required to elucidate the clinical usefulness of galectin-3 and sST2 for assessing liver fibrosis.

 XML Download