

 PDF
PDF ePub
ePub Citation
 Print
Print


Dear Editor,
Cancer patients with venous thromboembolism (VTE) have poor survival rates [12]. In addition to well-known coagulation biomarkers, microparticles (MPs) in patients with cancer have recently been studied [3]. MPs are typically defined as membrane vesicles 0.1–1.0 µm in diameter, formed by exocytic budding from cells during cell activation or apoptosis. We postulated that the initial levels of hemostatic biomarkers at cancer diagnosis would be useful in predicting and managing the clinical course of cancer in these patients. We analyzed coagulation profiles and circulating MPs in patients at the initial diagnosis of cancer and determined the clinical course and survival of these patients over two years.
This study was approved by the Institutional Review Board of the Catholic Medical Center (UC14SISI0100), Korea. Between May and December 2014, we included 67 consecutive patients diagnosed as having solid tumors in this prospective study and received their informed consent. Cancer sites included the stomach (N=13), colorectum (N=13), lung (N=9), head and neck (N=9), biliary tract (N=8), esophagus (N=4), breast (N=4), bladder (N=3), pancreas (N=2), and cervix (N=2). Survival and the occurrence of VTE were monitored at diagnosis and after two years. Coagulation biomarkers were analyzed at the initial cancer diagnosis. MPs were quantified by flow cytometry as previously described [4]. Particles that stained with annexin V (BD Biosciences, San Jose, CA, USA) and CD41 (BD Biosciences) were called platelet-derived microparticles (PMPs), whereas those that stained with annexin V and CD31 (BD Biosciences) were called endothelial cell-derived microparticles (EMPs). MPs in the MP gate (<1 µM, determined using 1-µM beads) were counted [5]. Prothrombin time (PT), activated partial thromboplastin time (aPTT), Clauss fibrinogen, D-dimer, and fibrinogen degradation product (FDP) levels were determined using a CS5100 analyzer (Sysmex Corporation, Kobe, Japan). Protein C and protein S activity were measured using a STA R Max analyzer (Diagnostica Stago, Parsippany, NJ, USA).
The program G*Power indicated a requirement of 67 samples for a power of 80% [6]. Student's independent sample t-, Mann-Whitney U, chi-square, and Fisher's exact tests were performed as appropriate. Receiver operating characteristic (ROC) curves were analyzed to define cutoffs to differentiate the non-survival group. Mean survival time (MST) based on the biomarkers was estimated by Kaplan-Meier analysis. All statistical analyses were performed by using the MedCalc program (MedCalc Software bvba, Mariakerke, Belgium).
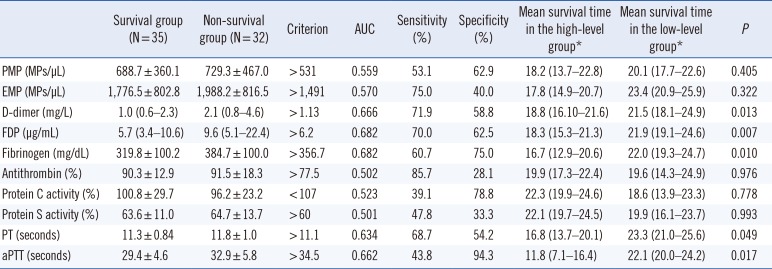
The survival rate was 52.2% (35/67). Levels of D-dimers, fibrinogen, and FDPs were significantly higher in the non-survival than in the survival group at two years (Table 1). PT and aPTT were prolonged in the non-survival group than in the survival group. PMP and EMP levels were not significantly associated with the two-year survival of cancer patients. The area under the curve (AUC) and optimal cutoffs were derived by ROC curve analysis. We divided patients into two groups based on the cutoffs for each biomarker based on this analysis. MSTs were significantly shorter in patients with higher levels of D-dimers, FDP, and fibrinogen groups than in those with lower levels.
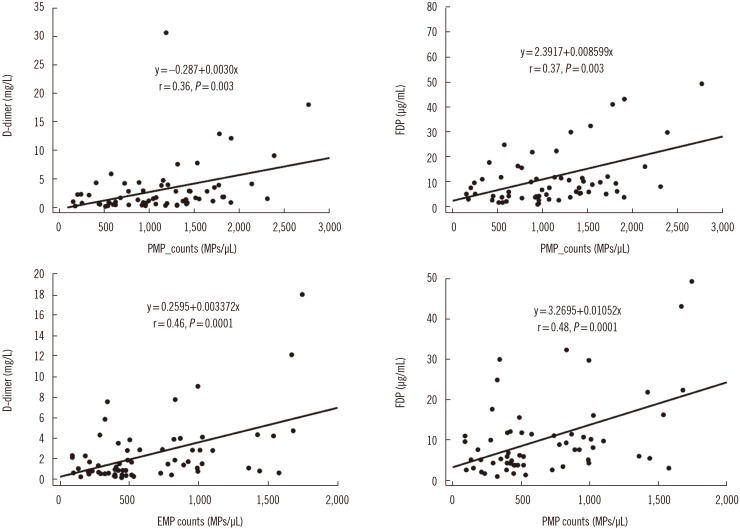
The overall cumulative probability of VTE in patients with cancer was 7.5% (5/67) within two years of the initial diagnosis of cancer. Two patients had VTE concomitantly with cancer diagnosis. In three patients, VTE occurred two–four months after the initial diagnosis. Clinical factors, including age, gender, cancer stage, mortality, and levels of tested biomarkers, did not differ between the with-VTE and without-VTE groups. The number of patients experiencing VTE was small for the statistical analysis. PMP and EMP counts showed a moderate correlation with D-dimer and FDP levels, respectively (Fig. 1). In a previous report, a weak correlation between levels of coagulation biomarker and MPs was demonstrated [78].
The decision to prescribe thromboprophylaxis in patients with cancer should be based on risk stratification. In this study, an increased thrombotic state was associated with a shorter MST. Additionally, a tendency toward a decreased antithrombotic state was found in patients with shorter MSTs. Similar to our findings, D-dimer, thrombin-antithrombin III complex, and fibrin levels were shown to be associated with survival of cancer patients [9]. Our data may assist in defining the clinician's initial monitoring plan.
PMP and EMP levels showed no association with survival or VTE occurrence in cancer patients in this study. Similar to our findings, a large cohort study indicated no association between MP levels and the occurrence of VTE with cancer [3]. However, MP-tissue factor activity was significantly associated with either VTE or survival in cancer patients [810]. Heterogeneous cancer types, technical issues, the lack of standardization in measuring MPs, and differences in analytical sensitivity may have contributed to the lack of association between MP and survival or VTE in this study.
We found a tendency towards imbalance between the thrombotic and antithrombotic systems at initial diagnosis in the groups of patients with lower survival. Method standardization and a large cohort study are needed to define the impact of MP on cancer prognosis.
 XML Download