

 PDF
PDF ePub
ePub Citation
 Print
Print


Accurately estimating the glomerular filtration rate (GFR) is essential for appropriate medical decisions in clinical practice, such as for the diagnosis and management of acute kidney disease and chronic kidney diseases (CKD) [1]. The estimated glomerular filtration rate (eGFR) is especially critical when potentially nephrotoxic drugs are used in pediatric cancer patients [23].
The 2012 Kidney Disease: Improving Global Outcomes (KDIGO) guidelines recommend the use of the updated Bedside Schwartz or 1B equation to calculate eGFR in children [4]. Several studies have demonstrated performance of the updated Schwartz equation [567891011]; however, few have assessed performance of the 1B equation that includes a blood urea nitrogen (BUN) component. Recently, some researchers have reported that the performance of the full age spectrum (FAS) equation was superior to the updated Schwartz equation [57]. In this study, we aimed to evaluate the performance of the 1B equation compared to updated Schwartz and FAS equations in Korean pediatric patients with cancer.
In total, 572 pediatric patients aged 2–17 years underwent 51Cr-EDTA GFR measurements from July 2009 to May 2016 at Asan Medical Center (Seoul, Korea). Data on height, serum creatinine (Scr), and BUN was available for 203 of the 572 patients on the day of GFR measurements. For these 203 patients, we collected data on age, sex, ethnicity, height, Scr, and BUN required for the eGFR calculations from electronic medical records. The 51Cr-EDTA GFR results (measured GFR [mGFR]) were used as the reference.
The median age of the patients was 10 years, and the study population included 115 (56.7%) male patients. The median Scr and BUN concentrations were 0.39 mg/dL and 8.5 mg/dL, respectively. The median measured mGFR was 118 mL/min/1.73 m2, and the median eGFRs calculated using the updated Schwartz, 1B, and FAS equations were 135, 113, and 130 mL/min/1.73 m2, respectively. Detailed patient characteristics are summarized in see Supplemental Data Tables S1 and S2.
This study was approved by the Institutional Review Board (IRB) of Asan Medical Center (approval number: 2016-0535). It was conducted through retrospective reviews of anonymous medical records for use in research, and the IRB waived the requirement of informed consent from both patients and their parents.
The Scr concentration was measured using the rate-blanked compensated kinetic Jaffe method (Roche Diagnostics, Indianapolis, IN, USA) with an isotope dilution mass spectrometry-traceable calibrator (Roche Diagnostics). The BUN concentration was determined by a kinetic assay using urease and glutamate dehydrogenase (Roche Diagnostics).
The eGFR was calculated using three different equations, as described below.
The updated Schwartz equation was as follows [12]:
where the height was in meters and the Scr was in mg/dL.
The 1B equation was as follows [12]:
where the height was in meters, and the Scr and BUN concentrations were in mg/dL.
The FAS equation was as follows [7]:

where the Scr was in µmol/L, and Q was the median Scr in the healthy population group based on age and sex [4].
We calculated the bias (eGFR–mGFR) for the three eGFR equations and analyzed whether there were significant differences in the bias from zero using a one-sample t-test. To assess clinical accuracy, we calculated the P30 of each eGFR equation and compared the P30 values of each equation using McNemar's test. P30 was defined as the percentage of eGFR within±30% of the mGFR. The root mean square error (RMSE) was calculated to evaluate precision. The eGFR/mGFR ratio of each eGFR equation was stratified by age, Scr, height, and BUN concentration.
Statistical analyses were performed using MedCalc version 14.12.0 (MedCalc Software, Ostend, Belgium) and Analyse-it for Microsoft Excel, version 4.65.2 (Analyze Software, Leeds, UK). P<0.05 was considered statistically significant.
The median (range) mGFR and eGFR calculated using the updated Schwartz equation were 118 (43–241) mL/min/1.73 m2 and 135 (34–257) mL/min/1.73 m2, respectively. The median (first quartile; third quartile) biases (mL/min/1.73 m2) of the three eGFR equations were as follows: updated Schwartz, 8.5 (6.0; 11.1); 1B, −9.0 (−30.1, 13.6); and FAS, 4.2 (−15.3; 32.4). The biases for all three eGFR equations were significantly different from zero (Table 1).
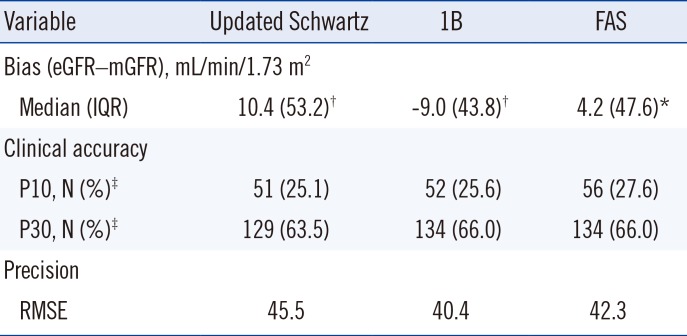
Table 1
Bias, clinical accuracy, and precision of the updated Schwartz, 1B, and FAS equations in pediatric cancer patients (N=203)
*Significant difference from zero, P<0.05; †Significant difference from zero, P<0.001; ‡P10 and P30 represent the eGFR within the range of ±10% and ±30%, respectively, of the mGFR.
Abbreviations: eGFR, estimated glomerular filtration rate; FAS, full age spectrum; IQR, interquartile range; mGFR, measured glomerular filtration rate; RMSE, root mean square error.
![]()
The P30 values were as follows: updated Schwartz, 63.5%; 1B, 66.0%; and FAS 66.0%. There was no significant difference in P30 between the three equations. The RMSE was the lowest for the 1B equation (40.4), followed by FAS (42.3), and updated Schwartz (45.5).
The median eGFR/mGFR ratio of the three eGFR equations decreased with age (Fig. 1A), height (Fig. 1B), and Scr creatinine concentration (Fig. 1C). The median eGFR/mGFR ratio of 1B was <1.0 and it decreased with increasing BUN concentration (Fig. 1D). There was no difference in the mGFR and BUN between age groups (<14 vs ≥14 years; see Supplemental Data Table S2). The median eGFR/mGFR ratio of the updated Schwartz and FAS equations for age <14 years was >1.0, while that of the 1B equation was <1.0 (Fig. 1A and see Supplemental Data Table S3).
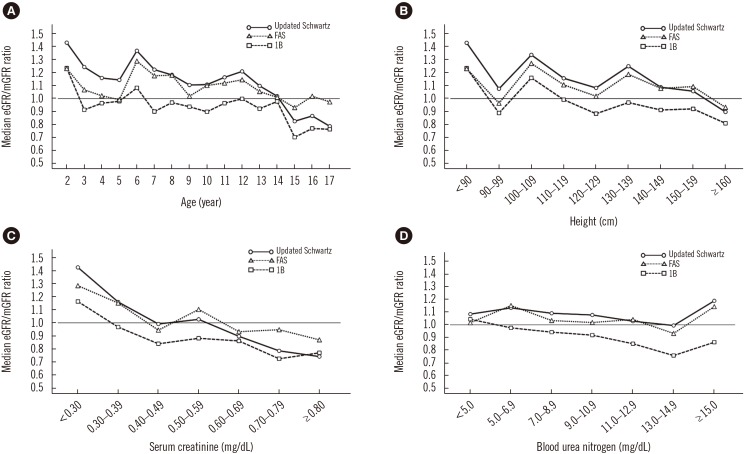
Fig. 1
Median ratio of eGFR to mGFR was stratified by (A) age, (B) height, (C) serum creatinine, and (D) blood urea nitrogen. Black solid line (○), updated Schwartz equation; black dotted line (▵), FAS equation; black dashed line (□), 1B equation; and gray line, the reference line (eGFR/mGFR ratio of 1.0).
Abbreviations: eGFR, estimated glomerular filtration rate; FAS, full age spectrum; mGFR, measured glomerular filtration rate. See Supplemental Data Table S1 for detailed numerical values (median and interquartile ratios).
![]()
The results revealed that the 1B equation underestimated the GFR of pediatric cancer patients, while the updated Schwartz and FAS equations overestimated the GFR. In previous studies evaluating bias (eGFR–mGFR, mL/min/1.73 m2) of the updated Schwartz equation, the reported positive bias of approximately 3.1–10.1 was comparable to that obtained in the present study [7813]. In the present study, the updated Schwartz and FAS equations overestimated the GFR when the Scr concentration was <0.40 mg/dL, and tended to underestimate the GFR with increasing Scr creatinine concentration. The 1B equation also exhibited a similar pattern, and the degree of GFR underestimation gradually increased with increasing Scr concentration. The 1B equation includes a BUN variable in addition to Scr, and the two variables have exponent of <1.0 (i.e., [height/Scr]0.64 and [30/BUN]0.202). Therefore, unlike the updated Schwartz and FAS equations, the 1B equation had a negative bias due to the structure of the equation. Theoretically, in normal kidneys, urea that passes through the glomeruli migrates from the renal tubules to the interstitium, ultimately causing back-diffusion that reenters the plasma. At a high-flow rate, it is well-known that urea clearance causes an underestimation of the GFR as back-diffusion decreases [14]. Because the GFR of a child is higher than that of an adult, it is expected that the 1B equation, which includes the BUN variable, underestimates the GFR.
Scr concentrations are affected by various nonrenal factors, such as high-protein diet and by activity of the urea cycle enzymes [14]. In children, creatinine gradually increases with age, and differs by sex after adolescence [14]. Previous studies have confirmed this trend. However, the BUN concentration of children older than one year of age is comparable to that of adults, and does not differ significantly by sex or age [1415]. In the present study, the biases for the updated Schwartz and FAS equations were not correlated with the BUN concentration; however, the 1B equation had an increased negative bias as the BUN concentration increased. This can be explained by the characteristics of the urea clearance itself and the structure of the 1B equation (e.g., [30/BUN]0.202).
All three equations (the updated Schwartz, 1B, and FAS) had statistically significant differences in the mean biases from zero. However, averaging the eGFR values from 1B equation with a negative bias, and updated Schwartz or FAS equation with a positive bias can reduce the bias when compared with to using a single equation alone; the mean bias (95% CI) of the average from updated Schwartz and 1B equations ([updated Schwartz+1B]/2) was 0.9 (−4.7 to 6.5) mL/min/1.73 m2 and similarly, the mean bias (95% CI) of the average from FAS and 1B equations ([FAS+1B]/2) was −1.6 (−7.1 to 3.8) mL/min/1.73 m2. In both cases, the 95% CI of the mean biases included zero, indicating that there was no significant difference in the mean biases from zero. We evaluated only 203 pediatric patients with cancer whose eGFR was near the normal range; thus, it is necessary to evaluate various groups of children, including those with CKD.
At 14 years of age, the bias (eGFR–mGFR) of the updated Schwartz equation changed from positive to negative. This trend has been reported in previous studies [1316]. Thus, one study suggested that the constant, k, used in the Schwartz equation should be applied differently according to age [17]. In the present study, when we applied the updated Schwartz equation to patients aged<14 years, we modified the constant from 41.3 to 36.8 (for height in meters and Scr in mg/dL). The mean bias (95% CI) changed from 11.6 (5.5 to 17.7) to −0.5 (−6.2 to 5.1) mL/min/1.73 m2; therefore, there was no significant difference from zero. Currently, the updated Schwartz equation of the 2012 KDIGO guidelines contains a single constant of 41.3 (for height in meters and Scr in mg/dL), but applying a different constant based on age may yield a more accurate eGFR for children. Additionally, several studies have reported that the FAS equation is more accurate than the updated Schwartz equation [57]. The recommended eGFR equation for adults was revised from MDRD (modification of diet in renal disease) to CKD-EPI (Chronic Kidney Disease Epidemiology Collaboration) [4]; thus, a different eGFR equation in lieu of the updated Schwartz or 1B equation should be further considered for pediatric patients.
Using the 1B equation instead of the updated Schwartz equation, the CKD stage as per KDIGO guidelines was unchanged for 86.7%, was one level lower (i.e. from CKD stage 1 to stage 2) for 12.3%, and was one level higher (i.e. from CKD stage 2 to stage 1 or from stage 3A to stage 2) for 1.0% of the patients in this study.
When the CKD stage as per KDIGO guidelines was classified using the mGFR for the 203 patients, use of the updated Schwartz equation resulted in no change in CKD stage in 79.8%, a one-level decrease (i.e. from CKD stage 1 to stage 2) in 4.4%, and a one-level increase (i.e. from CKD stage 2 to stage 1 or CKD stage 3A to stage 2) in 14.3% of the patients, while use of the 1B equation, resulted in no change in CKD stage in 79.3%, a one-level decrease in 9.9%, and a one-level increase in 10.3% of the patients. That is, compared to updated Schwartz equation, the 1B equation tended to underestimate the GFR.
In conclusion, the 1B equation tended to underestimate the GFR in the Korean pediatric cancer patients. Averaging the values obtained from two eGFR equations, namely the updated Schwartz and 1B equations, can reduce the eGFR bias. Therefore, if clinically necessary, eGFR calculation using Scr and BUN variables may yield a more accurate GFR estimation compared with the use of the updated Schwartz or 1B equation alone.
 XML Download