

 PDF
PDF ePub
ePub Citation
 Print
Print


INTRODUCTION
The detection of specific IgE (sIgE) is important for the diagnosis, treatment, and prevention of allergic diseases induced by type I hypersensitivity responses. The diseases associated with IgE-mediated hypersensitivity include asthma, allergic rhinitis, atopic dermatitis, drug allergy, food allergy, and anaphylaxis. The precise identification of the clinically relevant allergen is important for allergen avoidance and appropriate immunotherapy selection. sIgE sensitization profiles can be different from allergic disease, race, and cultural difference (food or life culture). In addition, there are many differences between IgE detection methods [1].
Skin- and laboratory-based tests are available for the detection of sIgE. In vitro detection can be accomplished with singleplex and multiplex allergen-sIgE assays [2], which allow patients to continue their medications during testing [3]. Moreover, patient examination can be performed immediately after anaphylaxis without the concern of allergic reactions. Cut-off values for oral provocation and serial follow-up of sIgE titers in response to food allergens can facilitate the prediction of tolerance [4], but sIgE detection efficacy can vary based on the equipment involved and methodological approach: selection of allergen, allergen coating, and detection methods for allergen-sIgE binding [56].
Singleplex sIgE detection is mainly provided by Thermo Fisher (ImmunoCAP, Uppsala, Sweden) and Siemens (Immulite, Los Angeles, CA). ImmunoCAP is a classic method for sIgE detection because of its reliability, reproducibility, and good accordance with skin test results [78]. Immulite is a more recently developed assay that improves on some features of the ImmunoCAP approach, such as run-time and solid-phase antigen immobilization [9]. Because the systems differ methodologically [6], inter-assay validation is important for the accurate interpretation of their clinical results.
In this study, we performed inter-method comparisons of ImmunoCAP and Immulite sIgE detection systems in samples from Korean allergy patients. Because ImmunoCAP is the “gold standard” for sIgE detection and is the only singleplex test for sIgE quantitation recommended by the World Health Organization [8], we comprehensively compared the detection performances of ImmunoCAP and Immulite, using 14 inhalant and food allergens. To our knowledge, this is the first study to compare ImmunoCAP and Immulite in the Korean population using 0–100 kU/L calibrators in both assays.
METHODS
1. Study participants
A total of 209 patients were enrolled from January to December 2015. This study was performed in the Allergy and Asthma Centre at Severance Hospital, a tertiary referral hospital in Seoul, Korea. The patient inclusion criteria were as follows: 1) age between 6 and 80 years; 2) diagnosis of bronchial asthma, allergic rhinitis, atopic dermatitis, food allergy, or chronic urticaria by allergy specialists; and 3) sensitization to at least one of the 14 allergens in the sIgE detection test (skin prick test [SPT], multiple allergen simultaneous test [MAST], or ImmunoCAP test). Patients who did not agree to participate in the study were excluded. Medical charts of enrolled participants were thoroughly reviewed. This study was approved by the Institutional Review Board of the Yonsei University Health System (No. 1-2015-0044).
2. Serum samples
Approximately 3–4 mL blood samples were drawn from 209 enrolled patients using serum separation vacuum tubes (Greiner Bio-One, KremsmÜnster, Austria). The samples were immediately centrifuged, and the separated sera were aliquoted into new tubes for storage at -80℃ until later analysis. After the end of the study period, the samples were sent simultaneously to two laboratories for sIgE assays (Immulite and ImmunoCAP) without any accompanying clinical data. During sample shipment, a frozen state was maintained. As there was no central laboratory that owned both devices, we selected two separate accredited laboratories in Seoul (two Severance Hospitals located in Gangnam [Immulite] and Shinchon [ImmunoCAP]).
3. Skin prick test and multiple allergen simultaneous test
All study participants underwent an SPT, MAST, or sIgE detection singleplex test. The SPTs were performed using 55 commercial allergens, including negative (saline) and positive (histamine) controls. Wheal sizes were measured 15 minutes postexposure, and positive reactions were noted for wheal sizes ≥3 mm. For patients who could not discontinue antihistamine medication or had dermographism, MASTs were performed using the AdvanSure AlloScreen (LG Life Science, Seoul, Korea).
4. sIgE detection assays
The ImmunoCAP and Immulite singleplex detection methods were used. Fourteen allergens common in Korea were chosen for comparison [10]: eight inhalant allergens (Dermatophagoides farinae; cat and dog dander; pollens of oak, rye grass and mugwort; Alternaria; and German cockroach) and six food allergens (egg white, milk, wheat, peanut, soybean, and shrimp). The detection limits of ImmunoCAP and Immulite are 0.10–100 kU/L. Both ImmunoCAP and Immulite results were reported in one of the seven classes (class 0–6). Both assays use nearly the same class scoring systems (class 1: from 0.35 to <0.7 kU/L, class 2: from 0.70 to <0.35 kU/L, class 3: from 3.50 to <17.5 kU/L, class 6: from ≥100 kU/L) except classes 4 and 5. In the ImmunoCAP system, class 4 is from 17.5 to <50 kU/L and class 5 is from 50 to <100 kU/L. Immulite defines class 4 from 17.5 to <52.5 kU/L and class 5 from 52.5 to <100 kU/L. The results of both methods were considered positive for values of 0.35 kU/L or more. Due to the limited serum sample volumes, it was not possible to perform paired tests with all 14 allergens. Instead, specific allergens were selected for each patient based on their SPT and MAST sensitization profiles.
5. Statistical analyses
To compare the two singleplex sIgE detection methods, we used IBM SPSS Statistics for Windows, Version 23.0 (IBM Corp., Armonk, NY) and MedCalc 11.0 (MedCalc Software, Mariakerke, Belgium) for multiple statistical tests. For qualitative comparison, total agreement ratios were calculated for each allergen as follows: total agreement ratio=(number of both tests shown positive+number of both tests shown negative)/number of total tests. Cohen's kappa analysis was also performed for agreement analysis. Second, the semi-quantitative correlations between class determinations (classes 0–6) were assessed using Spearman's rank correlation analysis and Goodman and Kruskal's gamma analysis. Spearman's correlation coefficients were classified as very high positive correlation (0.9–1.0), high positive (0.7–0.9), moderate positive (0.5–0.7), low positive (0.3–0.5), or negligible (below 0.3) correlation [11]. The kappa indices were within 0.41 and 0.92 and were classified as almost perfect (0.8–1.0), substantial (0.6–0.8), moderate (0.4–0.6), fair (0.2–0.4), or poor (below 0.2) [7]. Third, intra-class correlation (ICC) and Spearman's rank correlation analysis were used to evaluate sIgE quantitative comparisons. ICCs were classified as almost perfect (0.81–0.99), substantial (0.61–0.80), moderate (0.41–0.60), fair (0.21–0.40), or slight (0.01–0.20) agreement [12]. P<0.05 indicated statistical significance.
RESULTS
1. Characteristics of the enrolled participants
The median age was 27.0 years, and men comprised 57.9% of the study participants. Patients with allergic rhinitis were the most common (61.2%), followed by patients with asthma (40.2%), atopic dermatitis (31.6%), food allergy (18.2%), and chronic urticaria (13.9%). Responses to 902 combinations of allergens were compared between the two methods. The average positivity rate was 62.5% and ranged from 40.3% (milk) to 90.5% (D. farinae).
2. Qualitative analysis (positivity and negativity)
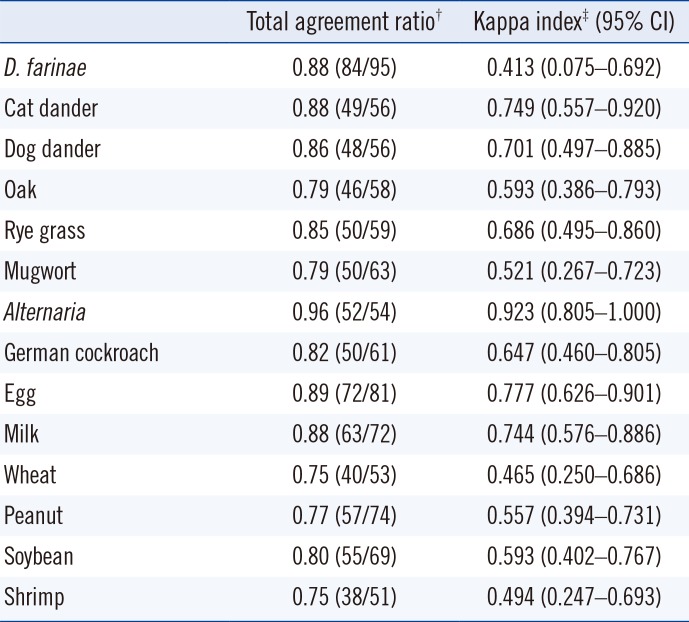
The total agreement ratios for positivity and negativity of each allergen for each test are shown in Table 1. The agreement ratios ranged from 0.75 (wheat and shrimp) to 0.96 (Alternaria). Alternaria allergen matched perfectly. Cat, dog, rye grass pollen, German cockroach, egg, and milk allergens agreed substantially. D. farinae, oak and mugwort pollens, wheat, peanut, soybean, and shrimp agreed moderately.
3. Semi-quantitative analysis (class correlation 0–6)
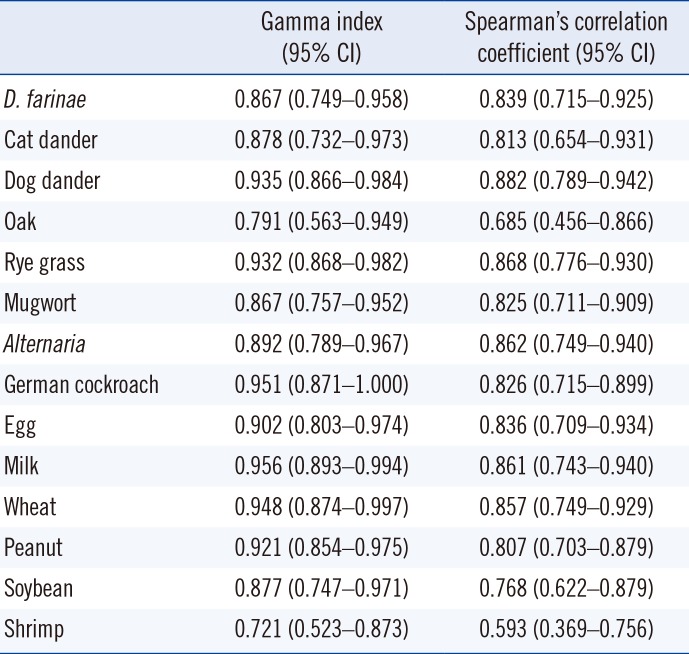
Class correlation analysis data using gamma indexes and Spearman's correlation coefficients are shown in Table 2. The gamma indices ranged from 0.721 to 0.956, and Spearman's correlation coefficients ranged from 0.593 to 0.882. Indices and coefficients closer to 1 indicated values in good agreement. The class correlation analysis showed a significant association between the two assays for all tested allergens. D. farinae, cat and dog danders, rye grass, mugwort, Alternaria, German cockroach, egg white, milk, wheat, peanut, and soybean showed highly positive correlations (P<0.001). Oak and shrimp showed moderately positive correlations (P<0.001).
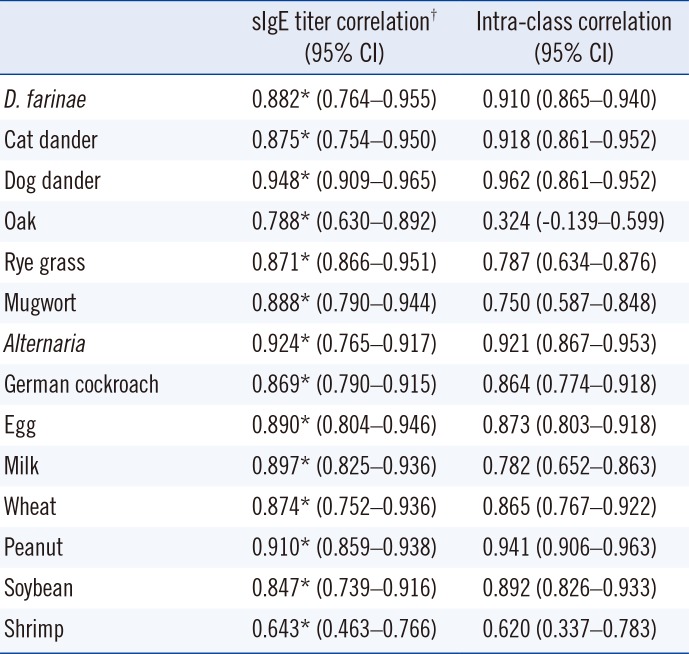
4. Quantitative analysis (sIgE titers)
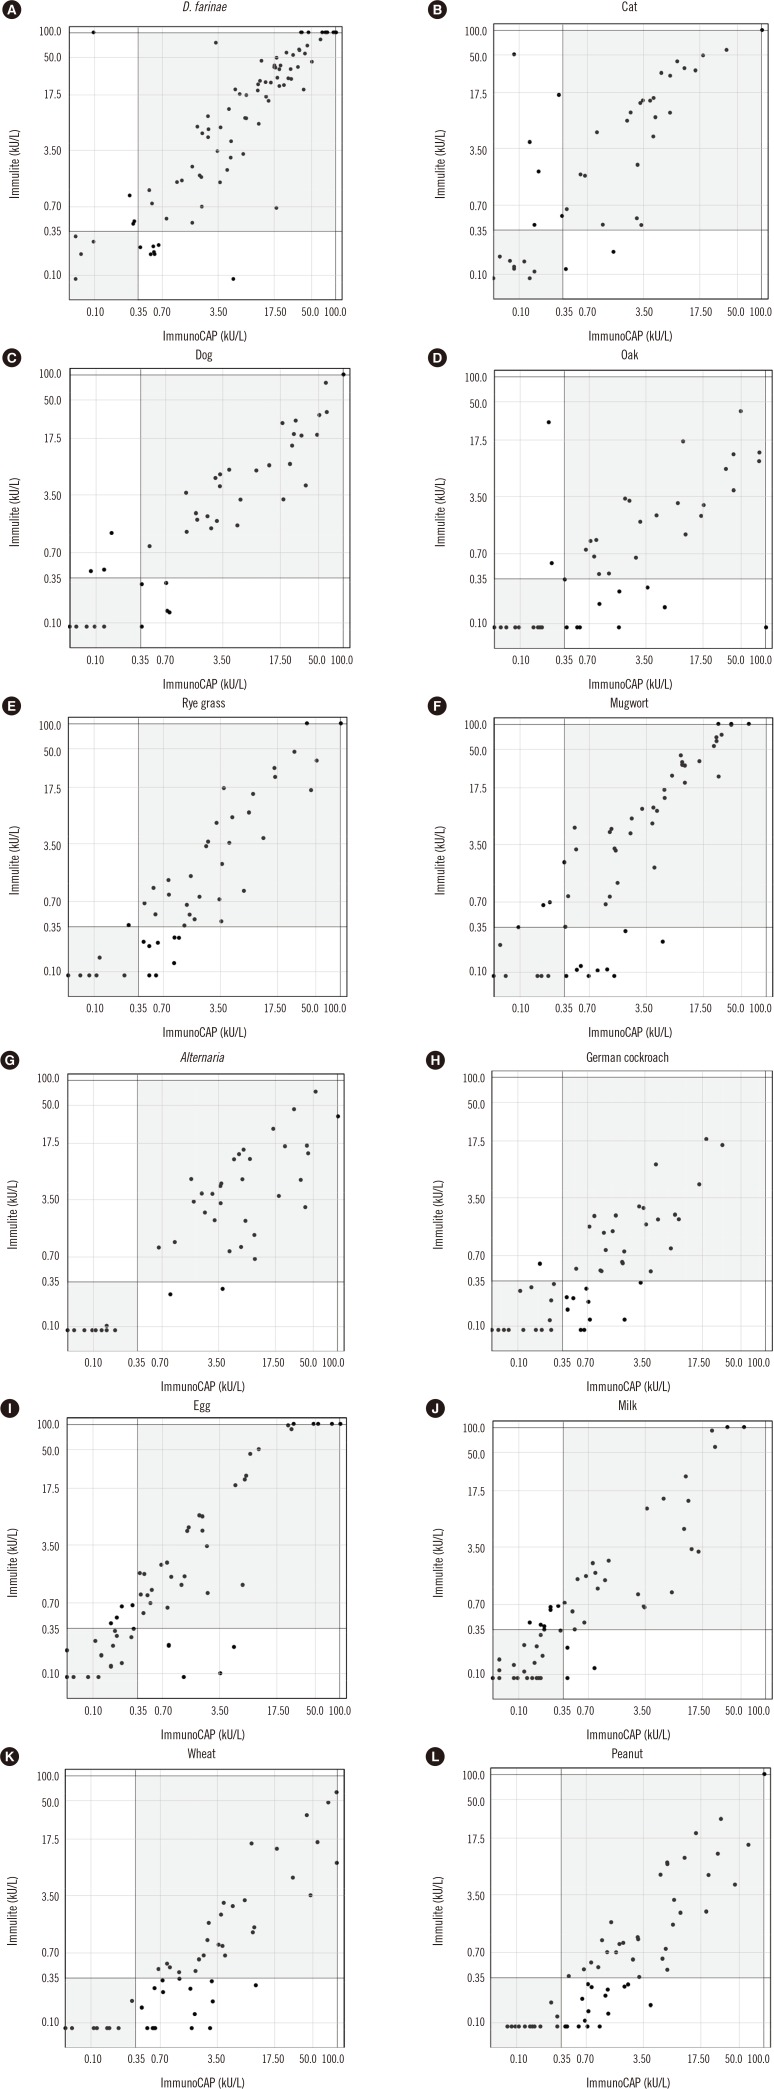
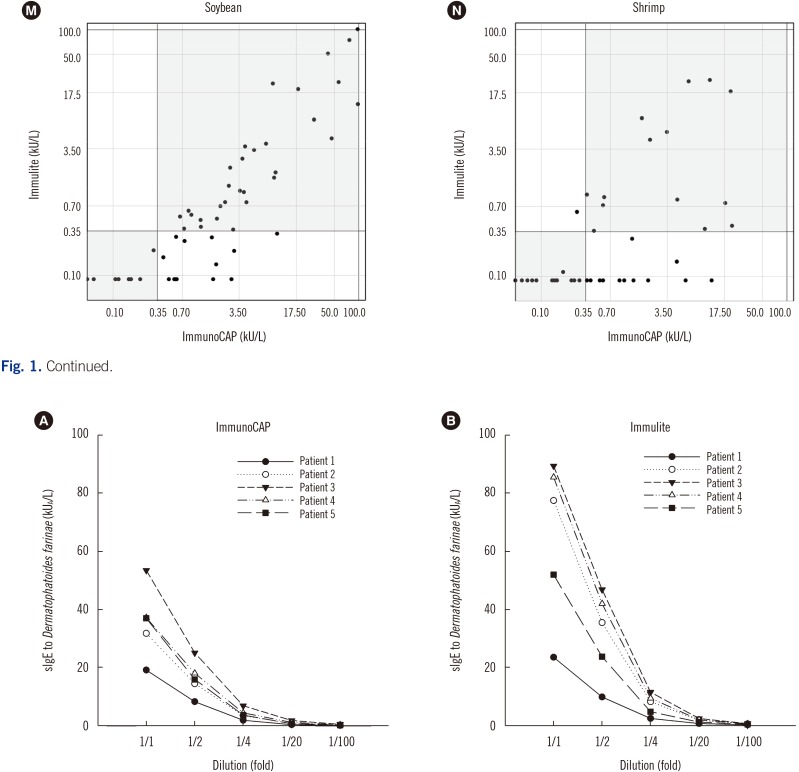
SIgE titers were compared between the two methods using Spearman's correlation coefficient and ICC analyses. The correlation patterns are shown in Table 3 and Fig. 1. The correlation coefficients of the sIgE titers of all allergens were highly positive except for shrimp allergen, which showed a moderate correlation. D. farinae, cat and dog dander, Alternaria, German cockroach, egg white, wheat, peanut, and soybean showed almost perfect agreement. Rye grass, mugwort, milk, and shrimp showed substantial agreement. Overall, the sIgE titers of each allergen were well correlated between the two methods. In addition, we measured D. farinae sIgE titers of serially diluted serum (Fig. 2). Both ImmunoCAP and Immulite showed good linearity as a quantitation assay.
DISCUSSION
A previous study compared these systems [9] but used a 0.35–100 kUA/L calibrator, which was replaced with the 0–100 kUA/L calibrator in Korea in 2009. In addition, we also compared the Alternaria, rye grass, wheat, and soybean allergens. Moreover, a greater number of food allergy patients were enrolled in this study compared with previous research.
For the 14 allergens tested, the two assays were well-matched based on positivity, class, and sIgE titer correlations. Alternaria showed perfect agreement in positivity comparisons, high correlation with class comparisons, and almost perfect correlations with sIgE titer comparison. Except for oak and shrimp allergens, at least moderate agreements were observed in qualitative and quantitative comparisons. This study did not perform inhalant and food allergen provocation tests. Detection of sIgE does not always mean that the patient is “allergic” to the allergen. Clinically meaningful allergens should be accompanied by appropriate symptoms. Therefore, it was difficult to know exactly which assay is true in this study.
To complement this limitation, a medical chart was reviewed with regard to wheat, shrimp, and peanuts. The sIgEs of these three allergens were more frequently detected in the ImmunoCAP test than those of the other allergens (Fig. 1). In the case of wheat allergen, 13 patients were positive according to ImmunoCAP but negative based on Immulite results, although only one of the patients had a wheat food allergy according to their medical records. Regarding shrimp allergen, 12 patients tested positive when using ImmunoCAP but negative when using Immulite; medical records indicated that six of the patients had a shrimp food allergy, while the other patients were highly sensitized to house dust mite allergen, which may have cross-reactivity with shrimp [13]. Similarly, 17 patients were tested positive for peanut allergen by ImmunoCAP. Among them, eight patients were able to confirm whether they were allergic to peanuts, but none had experienced an allergic reaction to peanuts. Cross-reactivity with Fagaceae (birch) may explain this discordant finding [14]. Based on these results, further studies are needed to confirm true positive assays.
In a scatter plot of sIgE titers (Fig. 1), inhalant allergens showed better agreement than food antigens except oak. D. farinae, cat and dog dander, Alternaria, and peanut showed almost perfect correlations in ICC analysis (>0.9). Oak pollen and shrimp had fair to moderate correlations. There are national, regional, ethnical, and time differences in sensitization profiles [151617]. Mongolian (Quercus mongolica) and saw tooth (Q. acutissima) oak are the dominant oak species in Korea [18], but white oak (Q. alba) is used as the oak allergen in both ImmunoCAP and Immulite systems. Thus, detection of oak allergen reaction in the Korean patients is limited in these two assays.
Similarly, the dominant species of house dust mite differ from those in Western countries. D. farinae is the dominant species in Korea [10], but because D. farinae and D. pteronyssinus demonstrate cross-reactivity [19], they likely showed similar detection patterns in the two methods [19].
The two singleplex assays report the results using the same units but have methodological differences. The basic reaction sequence for IgE detection is identical for the two assays. However, these two assays differ in many ways: allergen binding methods, signal detection methods (amplified chemiluminescence used in Immulite, fluorescence used in the ImmunoCAP), and test running time (running time is reduced from 100 to 65 minutes in the Immulite) [6202122].
These differences can affect the interpretation of the results and cause confusion regarding patient referrals. For example, for food allergies induced by egg, milk, or peanuts, there are cut-off values for oral provocation tests during serial sIgE follow-up. Cut-offs proposed from different singleplex assays should not be applied directly for clinical decision-making. Moreover, the results from the two assays are not interchangeable, although they both present reports in kU/L [23].
This study has some limitations. First, we could not perform provocation tests, which are a gold standard method for allergy diagnosis. Second, the allergen sources and manufacturing protocols of the two assays may differ. We were unable to obtain full information about the allergen sources and processes. Third, there are subtle differences in the grading systems for classes 4 and 5. These differences may have caused discrepancies in class and titer comparisons. Fourth, we could not test all 14 allergens using both assays in the study population due to the limited serum volumes.
In conclusion, the results of both ImmunoCAP and Immulite systems showed substantial correlation with respect to sIgE detection of common inhalant and food allergens. However, the results are not interchangeable due to fundamental methodological differences between the two assays. Understanding the differences between the ImmunoCAP and Immulite systems, as revealed in this study, is important for the interpretation of allergy test findings and essential for clinical decision-making in allergy patients.
 XML Download