

 PDF
PDF ePub
ePub Citation
 Print
Print


INTRODUCTION
METHODS
1. Patients
2. Conventional cytogenetics
3. Probes for interphase FISH
4. Statistical analyses and survival analyses
RESULTS
1. Patient characteristics
Table 1
Clinical and biological characteristics of patients with multiple myeloma
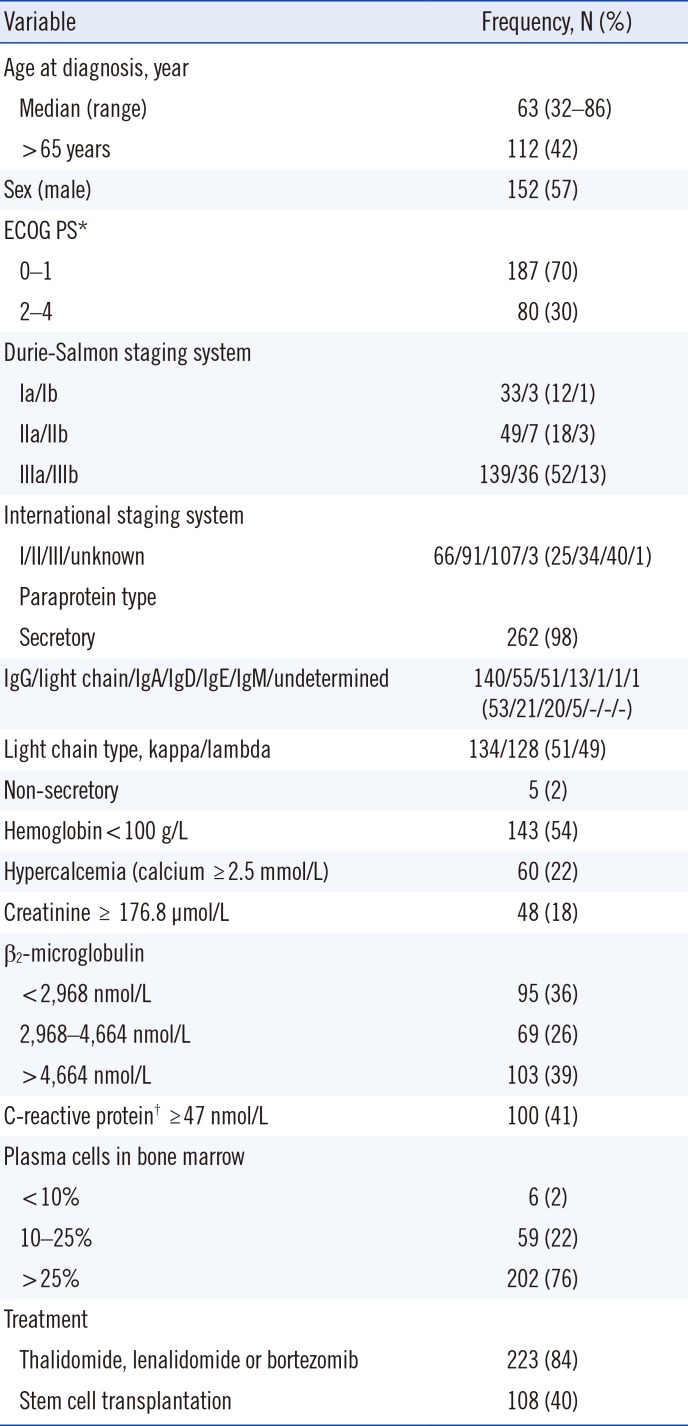
*ECOG PS score is as follows: 0=without symptoms; 1=mild symptoms not requiring treatment; 2=symptoms requiring some treatment; 3=disabling symptoms but allowing ambulation for > 50% of the day; 4=ambulation <50% of the day; †Data available from 244 patients.
Abbreviation: ECOG PS, Eastern Cooperative Oncology Group performance status.
![]()
2. Genetic abnormalities of the patients
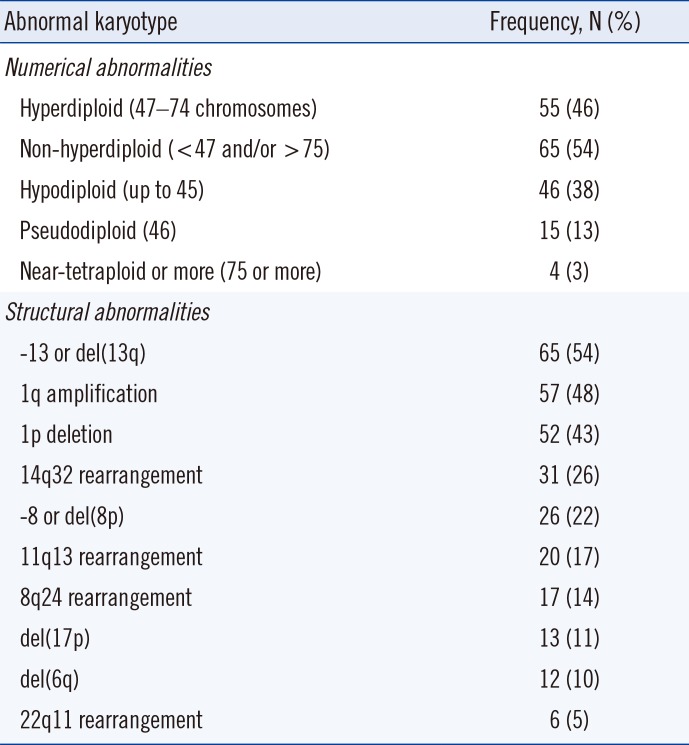
Table 2
Frequencies and distribution of cytogenetic abnormalities in 120 patients with abnormal karyotype
![]()
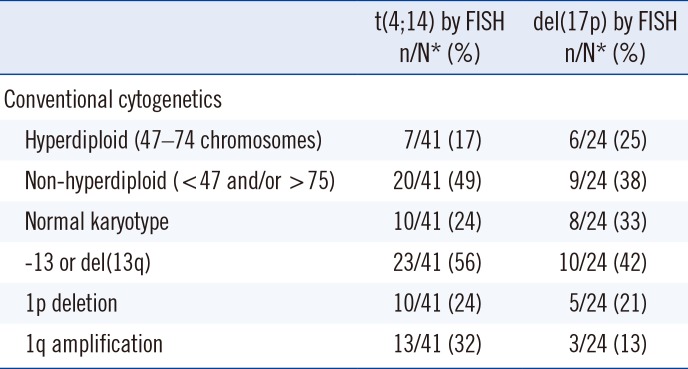
3. Comparison of detection frequencies and distribution of genetic abnormalities observed using cytogenetics, FISH, and comprehensive cytogenetics/FISH approaches
Table 3
Differences in detection frequencies and distribution of the identified genetic abnormalities according to the diagnostic approach of cytogenetics alone, FISH alone, and a comprehensive cytogenetics/FISH approach
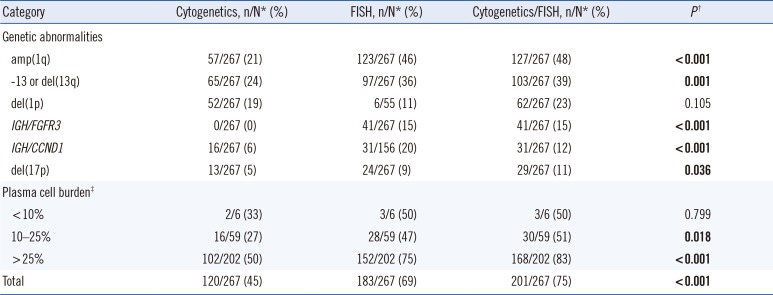
P values for comparison among cytogenetics, FISH, and cytogenetics/FISH groups were calculated using the Chi-square test. When the expected cell value was<5, Fisher's exact test was used. Significant P values are shown in bold.
*n/N indicates the positive number/total number of patients; †Cytogenetics versus FISH versus Cytogenetics/FISH group; ‡Proportion of plasma cells on bone marrow aspirate.
Abbreviations: amp, amplification; del, deletion.
![]()
4. Prognostic significance of the identified genetic abnormalities
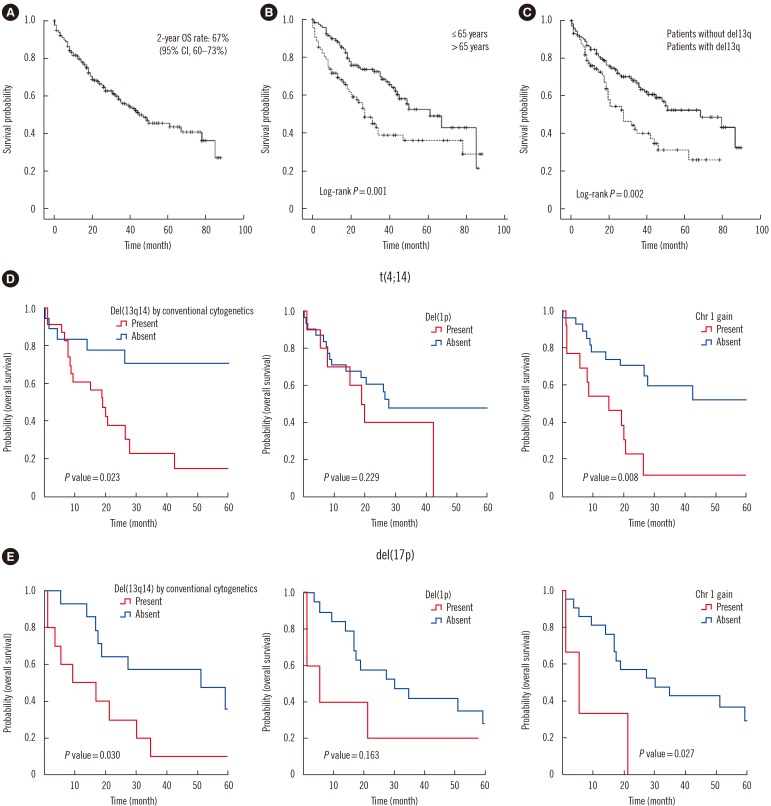
Fig. 1
Kaplan-Meier plots for the overall survival (OS) estimation and prognostic value of t(4;14) and del(17p) in multiple myeloma. (A) The OS rate at two years in 217 patients was estimated at 67%, and the median survival was 45 months (95% confidence interval [CI] 29–61 months). (B) OS according to age: ≤65 years group vs >65 years group (log-rank P =0.001). (C) OS according to the presence of del(13q) (log-rank P =0.002). (D-E) Prognostic value of t(4;14) and del(17p) in multiple myeloma.
![]()
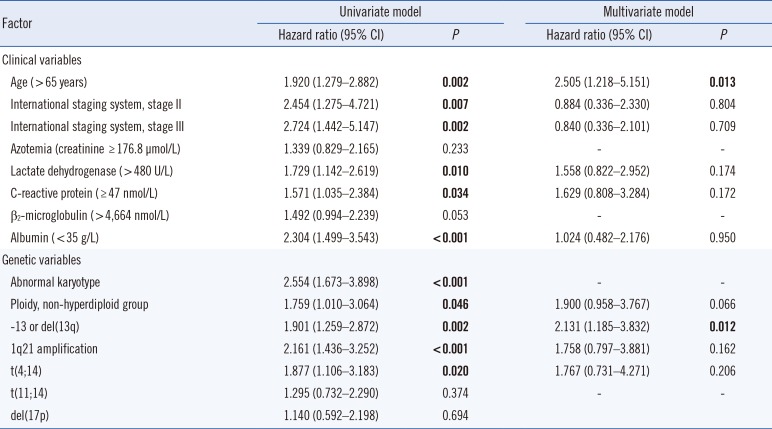
Table 4
Univariate and multivariate Cox regression analyses of the potential factors for overall survival (OS)
![]()
5. Role of additional chromosomal changes in the prognostic value of t(4;14) and del(17p) in MM
Table 5
Role of additional chromosomal changes in the prognostic value of t(4;14) and del(17p) in multiple myeloma
![]()
 XML Download