Journal List > Ann Lab Med > v.37(2) > 1091581

Choi, Jeong, Koh, and Lee: Recommendations for Optimizing Tuberculosis Treatment: Therapeutic Drug Monitoring, Pharmacogenetics, and Nutritional Status Considerations

Abstract

Although tuberculosis is largely a curable disease, it remains a major cause of morbidity and mortality worldwide. Although the standard 6-month treatment regimen is highly effective for drug-susceptible tuberculosis, the use of multiple drugs over long periods of time can cause frequent adverse drug reactions. In addition, some patients with drug-susceptible tuberculosis do not respond adequately to treatment and develop treatment failure and drug resistance. Response to tuberculosis treatment could be affected by multiple factors associated with the host-pathogen interaction including genetic factors and the nutritional status of the host. These factors should be considered for effective tuberculosis control. Therefore, therapeutic drug monitoring (TDM), which is individualized drug dosing guided by serum drug concentrations during treatment, and pharmacogenetics-based personalized dosing guidelines of anti-tuberculosis drugs could reduce the incidence of adverse drug reactions and increase the likelihood of successful treatment outcomes. Moreover, assessment and management of comorbid conditions including nutritional status could improve anti-tuberculosis treatment response.

INTRODUCTION

Tuberculosis (TB) is a major global health concern. In 2014, there were 9.6 million new cases of active TB worldwide and 12% of these cases involved coinfection with HIV and 1.5 million deaths, including 400,000 deaths among patients infected with HIV [1]. About 480,000 incident cases of multidrug-resistant TB were estimated to be caused by Mycobacterium tuberculosis organisms resistant to at least isoniazid and rifampin in 2014 [1].
The standard treatment for TB comprises an intensive phase with isoniazid and rifampicin, as well as pyrazinamide and ethambutol for two months, followed by a continuation phase that comprises the concomitant use of isoniazid and rifampicin for further four months [234]. Although the standard 6-month treatment regimen is highly effective for drug-susceptible TB, the use of multiple drugs over long periods of time can cause frequent adverse drug reactions [56]. These adverse reactions could result in interruption or discontinuation of anti-TB treatment, with subsequent risks of treatment failure and drug resistance [7]. The most common and important adverse reaction is hepatotoxicity because this is associated with the three most important first-line drugs: isoniazid, rifampin, and pyrazinamide [56]. Hepatotoxicity is most frequently dose-related; however, some cases are caused by drug hypersensitivity [8].
In addition, some patients with drug-susceptible TB do not respond adequately to treatment and develop treatment failure and drug resistance [910]. The current recommended doses of anti-TB drugs are based on the patient's body weight [1112]. Because drug concentrations and pharmacokinetics vary markedly among patients, this approach can cause adverse drug reactions because of toxic drug levels as well as the development of antibiotic resistance and treatment failure due to suboptimal drug levels [131415]. Therapeutic drug monitoring (TDM), which is individualized drug dosing guided by serum drug concentrations, could reduce the incidence of adverse drug reactions and increase the likelihood of successful treatment outcomes [161718].
Numerous factors affect the pharmacokinetics (PK) of drugs [19]. Pharmacogenetics is the study of interindividual variations in DNA sequence that are related to a drug response [20]. In recent years, several studies have demonstrated that some genetic polymorphisms are associated with susceptibility to adverse drug reactions such as hepatotoxicity [212223]. Furthermore, the nutritional state affects drug exposure and treatment outcomes in TB patients [242526]. Deficiency of some nutrients such as vitamin D is associated with an increased risk of TB and poor treatment outcomes [272829].
The anti-TB drugs currently in use were developed over 40 yr ago [30]. Although several promising novel agents have been developed for the treatment of multidrug-resistant TB in recent years [3031], these new drugs will not be readily available for the treatment of drug-susceptible TB in the future. Therefore, optimizing current treatment regimens is important to improve the effectiveness of treatment of TB. This article reviews the current knowledge on the clinical usefulness of TDM, pharmacogenetics, and the assessment of nutritional state in the management of patients with TB to improve anti-TB treatment response.

TDM OF ANTI-TB AGENTS

1. Basic principles of TDM for TB patients

TDM is currently widely used to optimize the efficacy and safety of many commonly used drugs [32]. To maximize patient exposure to these drugs while avoiding or limiting toxicity, several studies on anti-TB drug PK, pharmacodynamics (PD), and TDM have been reported [1633]. Patients infected with HIV and those with type 2 diabetes have been reported to be confronted with a risk of poor drug absorption and drug–drug interactions [1632]. In cases with inadequate exposure to anti-TB drugs and a possible suboptimal treatment response, treatment failure risk and toxicity increase [16]. The inefficacy of the drugs might be due to faulty administration, poor storage conditions and product quality, counterfeit product, or interactions [34]. Published guidelines typically describe interactions between two drugs, whereas the situation is more complex clinically and TDM is often the best available tool for resolving multidrug interactions and providing patients adequate and safe drug doses [1635]. TDM can assist in clinical decision-making [36].
The indications for TDM are prioritized to patients who fail to show sputum culture conversion within two months of standardized treatment, those with adverse drug reactions, and/or multiple risk factors such as HIV infections, type 2 diabetes, gastrointestinal tract problems causing malabsorption, or those who are severely ill [1832]. For these patients, TDM can be helpful in shortening the time to achieve treatment response and completion [163237].
A recent review of the evidence for measuring drug concentrations of first-line anti-TB drugs in adults stated that the routine measurement of drug concentrations in the general TB population is not warranted because most previous studies were limited by small sample sizes and yielded insufficient evidence [32]. Well-designed prospective randomized controlled studies are needed to determine the role of measurement of drug concentrations during anti-TB therapy [1638].

2. Practical aspects of TDM for anti-TB agents

To measure serum or plasma anti-TB drug concentrations, chromatography-based methods such as HPLC-ultraviolet detection, HPLC-fluorescence detection, and HPLC–tandem mass spectrometry (MS/MS) have been introduced [42]. LC-MS/MS is particularly useful as a simple and rapid analytical method for simultaneous, quantitative determination of 20 anti-TB drugs including both first-line and second-line anti-TB drugs [42].
Blood samples for TDM should be collected in plain red-top tubes [36]. Heparin-containing green-top tubes can also be used (except in the case of injectable drugs), and the tubes should be placed on ice when the blood collection site is far from a laboratory [16]. Promptly centrifuged serum samples should be harvested and frozen after the blood draws to mitigate concerns about the stability of anti-TB drugs at room temperature, particularly isoniazid and ethionamide [1636]. A recent report regarding the use of TDM indicated that dried blood spots with a lower blood volume can be used as an alternative to conventional serum sampling methods for some anti-TB drugs, and would reduce costs, especially in areas with limited resources such as low-income countries or in pediatric populations [4041]. Further studies are needed to validate the clinical and analytical efficacy of this method including refining drug-specific protocols for analytical validation and quality control [41].

3. Recent guidelines for TDM in TB patients

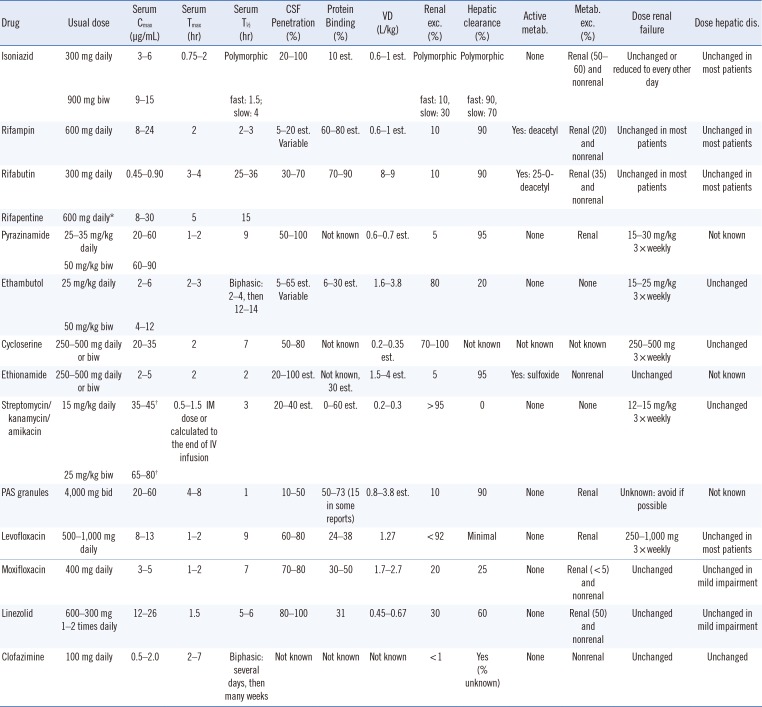
The guidelines for TDM in TB treatment introduced in 2002 were updated recently [1633]. The peak concentrations (Cmax) may have more significance for several anti-TB drugs than the trough concentrations, and the trough concentrations of numerous anti-TB drugs are usually too low (below the limit of detection of the measurement assays) [16]. Therefore, 2-hr post-dose samples to estimate the peak concentrations can be collected, with the exception of certain drugs such as rifabutin, for which 3-hr samples are more appropriate (Table 1) [16]. Considering the variability of oral drug absorption and the fact that single time points may miss the correct time that reflects the actual peak, typically 6-hr post-dose (7 hr for rifabutin) second samples provide more information about drug absorption status [16].
Dose adjustment should be based on both drug exposure and the minimal inhibitory concentration (MIC) of the M. tuberculosis strain to attain the optimal PK/PD profile [18]. Although the area under the concentration-time curve (AUC) to MIC (AUC/MIC) is the most important PD parameter for most anti-TB drugs, estimating the AUC requires several blood samples (minimum of six or seven samples) and, therefore, is impractical [36]. Moreover, limited sampling strategies to determine the sampling time that is most informative for the AUC have been introduced for several drugs [39].
Another approach for estimating PK parameters and achieving a specific therapeutic target is to use a maximum a posteriori estimation Bayesian approach; however, this is rather time-consuming and requires a sophisticated software [16]. Because not every dose increase results in increased drug exposure, follow-up at 1–2 weeks after dose adjustment to ensure that the target drug concentrations are reached is required [18].

PHARMACOGENETICS OF ANTI-TB AGENTS

1. Genetic polymorphisms of drug-metabolizing enzymes associated with anti-TB agents

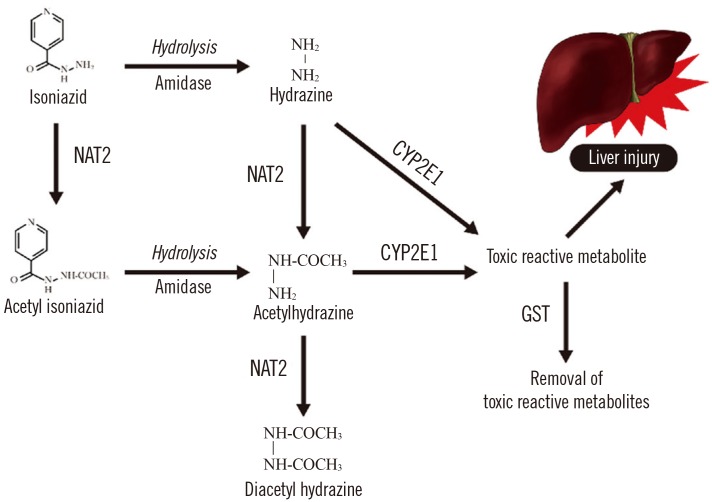
Pharmacogenetics-based testing involves genetic testing to assess the risk of an adverse response in a patient or the likelihood of a patient responding to a given drug, which facilitates drug selection and dosing [4041]. Polymorphisms of N-acetyl transferase 2 (NAT2), cytochrome P450 2E1 (CYP2E1), and glutathione S-transferase (GST1) have been reported to increase patients' susceptibility to isoniazid-induced hepatotoxicity (Fig. 1) [38]. The NAT2 rapid acetylators and CYP2E1 rapid metabolizers show increased concentrations of hepatotoxic metabolites, while the GST1 rapid metabolizers show decreased concentrations [38]. Some studies reported that the HLA, uridine 5′-diphosphate (UDP)-glucuronosyltransferase (8UGT), nitric oxide synthase (NOS), broad complex, tramtrack, bric-a-brac (BTB) and cap ‘n’collar type of basic region leucine zipper factor family (CNC) homolog (BACH), and Maf basic leucine zipper protein (MAFK) polymorphisms have roles in isoniazid-induced hepatotoxicity by modifying antioxidant enzymes expression [38].

2. Practical aspects of genotyping for therapy with anti-TB agents

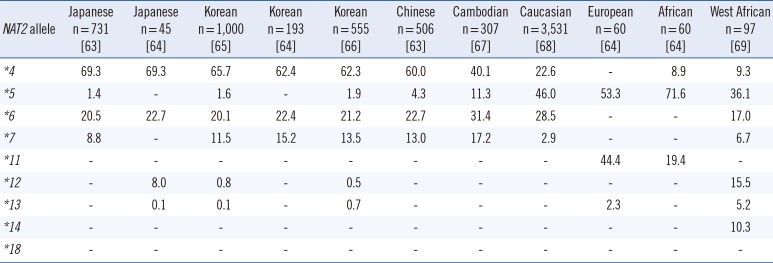
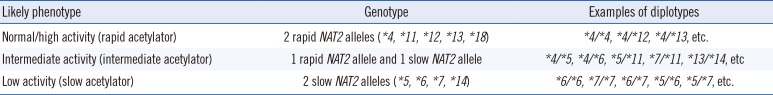
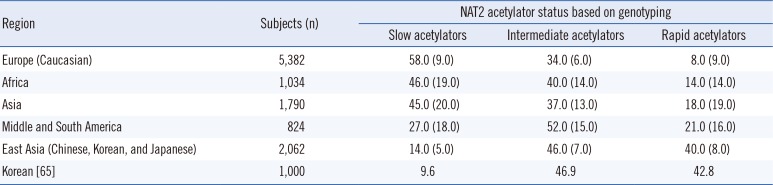
The NAT2 genotype is a biomarker listed on the rifampin, isoniazid, and pyrazinamide (Rifator) drug label in the Food and Drug Administration Table of Pharmacogenomic Biomarkers in Drug Labels [45]. The label contains information relating to the metabolism of isoniazid by acetylation and dehydrazination. In addition, it states that rifampin and isoniazid can induce or inhibit particular CYP450 enzymes and, therefore, could affect the metabolism of concomitantly administered drugs that are metabolized by these enzymes [45]. NAT2 genotype and assigned phenotype are summarized in Tables 2, 3, and 4.
The following single nucleotide polymorphisms (SNPs) at seven different sites of the NAT2 gene are considered to have a serious phenotypic effect on N-acetylation activity: rs1801279 (c.191G>A), rs1041983 (c.282C>T), rs1801280 (c.341T>C), rs1799929 (c.481C>T), rs1799930 (c.590G>A), rs1208 (c.803A>G), and rs1799931 (c.857G>A) [42].
Pharmacogenetic analysis for genotyping of drug-metabolizing enzyme polymorphisms can be performed by using various methods such as sequencing, polymerase chain reaction, restriction fragment length polymorphism, and high-throughput microarray (such as SNPstream) [42]. DNA sequencing is still considered the gold standard for NAT2 genotyping [42].

3. Genotype-based dosing guidelines for anti-TB drugs

International dosing guidelines consider the patient genotype by the Clinical Pharmacogenetics Implementation Consortium (CPIC) [43]. However, the Royal Dutch Association for the Advancement of Pharmacy - Pharmacogenetics Working Group (DPWG), and other professional societies do not provide genotype-based dosing guidelines for anti-TB drugs [44]. Furthermore, evidence suggests that the acetylation status of an individual based on genetic variants in the NAT2 gene markedly contributes to the mechanism of drug-induced hepatotoxicity and/or drug efficacy [384145]. Slow acetylators of isoniazid may be more susceptible to drug-induced hepatotoxicity because of higher blood concentrations of the drug than rapid acetylators are, and the high frequency of slow and intermediate acetylators in the Asian population suggests that these populations are more susceptible to isoniazid-induced hepatotoxicity [384145].
Several pharmacogenetic anti-TB therapies have been proposed, in which the daily dose of isoniazid is optimized according to the NAT2 genotype [414647]. A recent randomized controlled trial of pharmacogenetics-based therapy revealed that an NAT2 genotype-guided regimen in Japanese TB patients reduced isoniazid-induced liver injury and early treatment failure during the 6-month four-drug standard treatment of TB [44]. This observation suggests the potential usefulness of NAT2 genotype-guided dose stratification of isoniazid in chemotherapy for TB [46]. In that study, NAT2 genotype-guided isoniazid dosing stratification comprised 7.5, 5, and 2.5 mg/kg for rapid, intermediate, and slow acetylators compared with the conventional standard treatment of 5 mg/kg isoniazid [46]. In Korea, a prospective study of NAT2 genotype-guided isoniazid dosage regimen for patients with TB also ensured they achieved therapeutic concentrations of isoniazid [47]. In that study, the equation obtained using regression analysis determined that the best-predicted isoniazid concentration was as follows: isoniazid concentration (mg/L)=13.821-0.1×(body weight, kg)-2.273×(number of high-activity alleles of NAT2 genotype; 0, 1, and 2) [47]. The model revealed that the frequency of being within the therapeutic range of 3.0–6.0 mg/L was higher in the model-based treatment group than it was in the standard treatment group in 53 newly enrolled patients (80.8% vs 59.3%) [47]. Well-designed prospective studies are needed to determine the role of pharmacogenetics-based dosage adjustment and measurement of drug concentrations in monitoring hepatotoxicity symptoms and optimizing pharmacotherapy [32].

ASSESSMENT OF NUTRITIONAL STATUS OF TB PATIENTS

1. Nutritional status of TB patients

Addressing comorbid conditions can improve anti-TB treatment responses and should be considered as a part of the standard of care for TB patients. TB could worsen undernutrition, which could further weaken the immunity [46]. Furthermore, undernutrition has been reported to be a risk factor for the progression of TB infection to active TB disease, and its presence at the initial diagnosis of active TB has been reported to be a predictor of increased risk of death and TB relapse [4849]. Food and nutritional care are essential for successful health promotion and TB prevention. The WHO guidelines on nutritional care and support for TB patients states that their nutritional status should be assessed at diagnosis and throughout treatment, and they should receive appropriate counseling based on their nutritional status [48].

2. Methods and practical aspects of assessing nutritional status

Nutritional requirements can be roughly divided into macronutrients such as carbohydrate, protein, and fat, and micronutrients such as essential vitamins and trace elements [50]. Nutritional assessment including anthropometric, biochemical, clinical, and dietary components is an integral part and starting point of appropriate nutritional care [48]. Age-appropriate anthropometric measures are required including height and weight such as weight-for-length or weight-for-height Z-score in children less than five years of age, body mass index (BMI)-for-age-and-sex Z-score in children and adolescents aged 5-19 yr, and BMI in adults and mid-upper arm circumference in children less than five years of age and pregnant women [4851]. A detailed nutrition and diet history, as well as an assessment of symptoms associated with weight loss, can assist in the identification of underlying diseases including non-dietary causes of malnutrition [49]. In addition, important comorbidities such as HIV, diabetes mellitus, or alcohol or drug abuse, and the availability of adequate food and household food security should be assessed [51].
Symptoms and signs of nutrition deficiency are frequently ambiguous and could be due to non-nutritional causes [50]. Therefore, biochemical assessments using laboratory tests enables the identification of deficiencies in specific nutrients [52]. Nutrients such as vitamins and trace elements are present in very minute concentrations, and techniques for the analysis of those nutrients should be sensitive enough to analyze concentrations of micrograms or even nanograms per liter; considerable care must be taken when measuring such compounds to avoid contamination [52]. Various direct and indirect assays such as measurement of enzymatic activity or nutrient metabolites are used to assess the quantity of nutrients in specimens such as blood, tissue, and urine [36]. Analytical techniques for clinical measurement of vitamin concentrations include the photometric, fluorimetric, and competitive protein binding assays, radioimmunoassay, HPLC, and LC-MS/MS. Furthermore, methods for trace element analysis include spectrophotometry, atomic absorption spectrophotometry (AAS), inductively coupled plasma optical emission (ICP-OES), and inductively coupled plasma mass spectrometry (ICP-MS) [36].
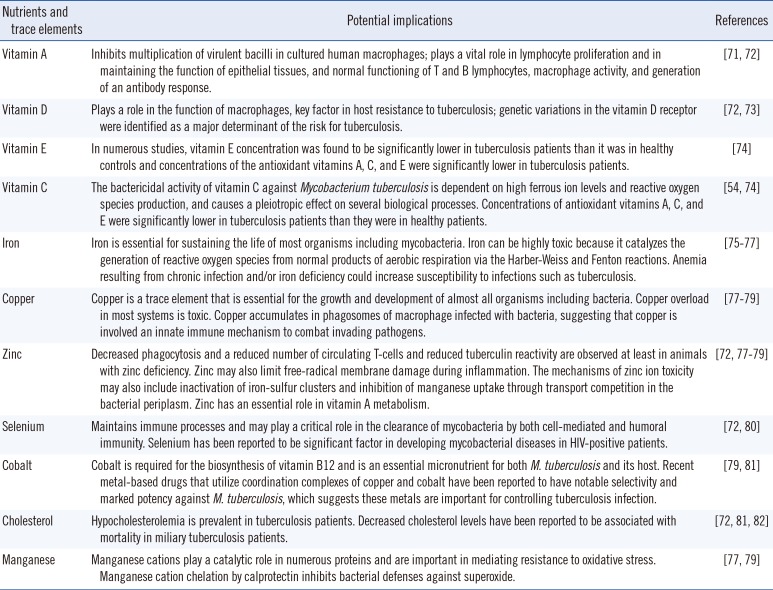
Altered circulating concentrations of vitamins A, E, and D, as well as iron, zinc, selenium, and copper have been reported in TB patients [4853]. Measurable nutrients and trace elements and their potential implications in TB infection and immunity are summarized in Table 5. A study on the status of four serum trace elements (cobalt, copper, zinc, and selenium) in Korean TB patients reported that serum cobalt and copper concentrations were higher in TB patients than in the controls [53]. Serum zinc and selenium concentrations in Korean TB patients were significantly lower and comparable to those in previous studies performed in populations of other ethnicities such as Ethiopians, Italians, and Indonesian, while reported serum copper concentrations are inconsistent [53]. In Korean TB patients, serum copper levels at diagnosis were significantly lower in rapid responders (negative sputum culture after 1 month of anti-TB treatment) than in other responders [53]. Low concentration of vitamins A, E, and D, as well as iron, zinc, and selenium usually return to normal after two months [46]. However, whether the low concentration is related to metabolic processes, the disease itself, or insufficient dietary intake, and its association with clinical outcomes for anti-TB treatment are unclear [48]. Although data are limited, and the relationship between serum concentrations and clinical outcomes of anti-TB treatment remain to be clarified, those studies suggest the potential usefulness of micronutrient status assessment in predicting therapeutic responses in TB patients and the future therapeutic approaches. A recent study revealed that M. tuberculosis is extraordinarily sensitive to destruction by vitamin C-induced Fenton reaction, which suggests the possible benefits of adding vitamin C to an anti-TB regimen and that the development of drugs that generate an oxidative burst could be useful in anti-TB treatment [54].

3. Nutritional supplementation for TB patients

Evidence of the effect of nutritional supplementation on TB prevention and health outcomes in TB patients is lacking [50]. Among the vitamins, the most extensively investigated is vitamin D [2755]. Vitamin D stimulates macrophage-mediated killing of M. tuberculosis and regulates this modality by inducing mechanisms to inactivate some aspects of the immune response and modulate others [56]. Although the function of vitamin D in immune responses in TB infection and treatment has been evaluated, no clear or consistent benefit of nutritional support in clinical improvement has been shown [56]. Only the vitamin D status and its supplementation in Korean TB patients using a variety of diagnostic methods have been assessed, but the results are inconsistent [57585960]. However, in cases of vitamin D supplementation, previous trials assessing sputum conversion could be misdirected if the major action of vitamin D in active TB disease is the mitigation of the inflammatory and immune responses [56]. This would be more appropriately evaluated by assessing tissue damage or prevention of relapse, rather than by the acceleration of sputum conversion; however, such trials are prolonged, and more difficult and costly to perform [56]. Future prospectively designed randomized controlled trials involving other vitamins and trace elements and those supplements are needed to determine whether food or energy supplementation promotes better treatment outcomes or improves the quality of life for TB patients [48].

CONCLUSIONS

Although TB is largely a curable disease, it remains a major cause of morbidity and mortality worldwide. Multiple factors are associated with the host-pathogen interaction including genetic factors of the host and the nutritional status, and may be related to the risk of TB infection. Those factors must be considered for effective TB control. Therefore, TDM during treatment and pharmacogenetics-based individualized dosing guidelines of anti-TB drugs show promise for optimizing anti-TB treatment. In addition, the assessment and management of comorbid conditions including poor nutritional status could improve the anti-TB treatment responses and, therefore, should be considered as a part of the standard of care for TB patients.

Acknowledgments

This study was supported by a grant from the Korean Health Technology R&D Project, Ministry for Health and Welfare, Republic of Korea (HI13C0871).

Notes

Authors' Disclosures of Potential Conflicts of Interest: No potential conflicts of interest relevant to this article were reported.

References

1. WHO. Global tuberculosis report 2016. WHO/HTM/TB/2015.22. Geneva: World Health Organization;2016. Accessed on Nov 2016. http://www.who.int/tb/publications/global_report/en/.
2. Shin HJ, Kwon YS. Treatment of drug susceptible pulmonary tuberculosis. Tuberc Respir Dis (Seoul). 2015; 78:161–167. PMID: 26175767.
3. Horsburgh CR Jr, Barry CE 3rd, Lange C. Treatment of tuberculosis. N Engl J Med. 2015; 373:2149–2160. PMID: 26605929.
4. Yew WW, Koh WJ. Emerging strategies for the treatment of pulmonary tuberculosis: promise and limitations? Korean J Intern Med. 2016; 31:15–29. PMID: 26767853.
5. Marra F, Marra CA, Bruchet N, Richardson K, Moadebi S, Elwood RK, et al. Adverse drug reactions associated with first-line anti-tuberculosis drug regimens. Int J Tuberc Lung Dis. 2007; 11:868–875. PMID: 17705952.
6. Lv X, Tang S, Xia Y, Wang X, Yuan Y, Hu D, et al. Adverse reactions due to directly observed treatment strategy therapy in chinese tuberculosis patients: a prospective study. PLoS One. 2013; 8:e65037. PMID: 23750225.
7. Munro SA, Lewin SA, Smith HJ, Engel ME, Fretheim A, Volmink J. Patient adherence to tuberculosis treatment: a systematic review of qualitative research. PLoS Med. 2007; 4:e238. PMID: 17676945.
8. Yew WW, Leung CC. Antituberculosis drugs and hepatotoxicity. Respirology. 2006; 11:699–707. PMID: 17052297.
9. Pasipanodya JG, McIlleron H, Burger A, Wash PA, Smith P, Gumbo T. Serum drug concentrations predictive of pulmonary tuberculosis outcomes. J Infect Dis. 2013; 208:1464–1473. PMID: 23901086.
10. Mah A, Kharrat H, Ahmed R, Gao Z, Der E, Hansen E, et al. Serum drug concentrations of INH and RMP predict 2-month sputum culture results in tuberculosis patients. Int J Tuberc Lung Dis. 2015; 19:210–215. PMID: 25574921.
11. Blumberg HM, Burman WJ, Chaisson RE, Daley CL, Etkind SC, Friedman LN, et al. American Thoracic Society/Centers for Disease Control and Prevention/Infectious Diseases Society of America: treatment of tuberculosis. Am J Respir Crit Care Med. 2003; 167:603–662. PMID: 12588714.
12. WHO. Treatment of tuberculosis: guidelines for national programmes 4th ed WHO/HTM/TB/2009.420. Geneva, Switzerland: World Health Organization;2009. Accessed on Nov 2016. http://www.who.int/tb/publications/tb_treatmentguidelines/en/.
13. Satyaraddi A, Velpandian T, Sharma SK, Vishnubhatla S, Sharma A, Sirohiwal A, et al. Correlation of plasma anti-tuberculosis drug levels with subsequent development of hepatotoxicity. Int J Tuberc Lung Dis. 2014; 18:188–195. PMID: 24429311.
14. Pasipanodya JG, Srivastava S, Gumbo T. Meta-analysis of clinical studies supports the pharmacokinetic variability hypothesis for acquired drug resistance and failure of antituberculosis therapy. Clin Infect Dis. 2012; 55:169–177. PMID: 22467670.
15. Srivastava S, Pasipanodya JG, Meek C, Leff R, Gumbo T. Multidrug-resistant tuberculosis not due to noncompliance but to between-patient pharmacokinetic variability. J Infect Dis. 2011; 204:1951–1959. PMID: 22021624.
16. Alsultan A, Peloquin CA. Therapeutic drug monitoring in the treatment of tuberculosis: an update. Drugs. 2014; 74:839–854. PMID: 24846578.
17. Reynolds J, Heysell SK. Understanding pharmacokinetics to improve tuberculosis treatment outcome. Expert Opin Drug Metab Toxicol. 2014; 10:813–823. PMID: 24597717.
18. Sotgiu G, Alffenaar JW, Centis R, D'Ambrosio L, Spanevello A, Piana A, et al. Therapeutic drug monitoring: how to improve drug dosage and patient safety in tuberculosis treatment. Int J Infect Dis. 2015; 32:101–104. PMID: 25809764.
19. Ma Q, Lu AY. Pharmacogenetics, pharmacogenomics, and individualized medicine. Pharmacol Rev. 2011; 63:437–459. PMID: 21436344.
20. Pirazzoli A, Recchia G. Pharmacogenetics and pharmacogenomics: are they still promising? Pharmacol Res. 2004; 49:357–361. PMID: 15202515.
21. Sun F, Chen Y, Xiang Y, Zhan S. Drug-metabolising enzyme polymorphisms and predisposition to anti-tuberculosis drug-induced liver injury: a meta-analysis. Int J Tuberc Lung Dis. 2008; 12:994–1002. PMID: 18713495.
22. Wang PY, Xie SY, Hao Q, Zhang C, Jiang BF. NAT2 polymorphisms and susceptibility to anti-tuberculosis drug-induced liver injury: a meta-analysis. Int J Tuberc Lung Dis. 2012; 16:589–595. PMID: 22409928.
23. Li C, Long J, Hu X, Zhou Y. GSTM1 and GSTT1 genetic polymorphisms and risk of anti-tuberculosis drug-induced hepatotoxicity: an updated meta-analysis. Eur J Clin Microbiol Infect Dis. 2013; 32:859–868. PMID: 23377313.
24. Oshikoya KA, Sammons HM, Choonara I. A systematic review of pharmacokinetics studies in children with protein-energy malnutrition. Eur J Clin Pharmacol. 2010; 66:1025–1035. PMID: 20552179.
25. Jeremiah K, Denti P, Chigutsa E, Faurholt-Jepsen D, PrayGod G, Range N, et al. Nutritional supplementation increases rifampin exposure among tuberculosis patients coinfected with HIV. Antimicrob Agents Chemother. 2014; 58:3468–3474. PMID: 24709267.
26. Hatsuda K, Takeuchi M, Ogata K, Sasaki Y, Kagawa T, Nakatsuji H, et al. The impact of nutritional state on the duration of sputum positivity of Mycobacterium tuberculosis. Int J Tuberc Lung Dis. 2015; 19:1369–1375. PMID: 26467590.
27. Zeng J, Wu G, Yang W, Gu X, Liang W, Yao Y, et al. A serum vitamin D level <25nmol/l pose high tuberculosis risk: a meta-analysis. PLoS One. 2015; 10:e0126014. PMID: 25938683.
28. Pareek M, Innes J, Sridhar S, Grass L, Connell D, Woltmann G, et al. Vitamin D deficiency and TB disease phenotype. Thorax. 2015; 70:1171–1180. PMID: 26400877.
29. Junaid K, Rehman A, Saeed T, Jolliffe DA, Wood K, Martineau AR. Genotype-independent association between profound vitamin D deficiency and delayed sputum smear conversion in pulmonary tuberculosis. BMC Infect Dis. 2015; 15:275. PMID: 26193879.
30. Kwon YS, Jeong BH, Koh WJ. Tuberculosis: clinical trials and new drug regimens. Curr Opin Pulm Med. 2014; 20:280–286. PMID: 24614239.
31. Kwon YS, Koh WJ. Synthetic investigational new drugs for the treatment of tuberculosis. Expert Opin Investig Drugs. 2016; 25:183–193.
32. Wilby KJ, Ensom MH, Marra F. Review of evidence for measuring drug concentrations of first-line antitubercular agents in adults. Clin Pharmacokinet. 2014; 53:873–890. PMID: 25172553.
33. Peloquin CA. Therapeutic drug monitoring in the treatment of tuberculosis. Drugs. 2002; 62:2169–2183. PMID: 12381217.
34. WHO. A practical handbook on the pharmacovigilance of medicines used in the treatment of tuberculosis. Geneva: World Health Organization;2012. Accessed on Nov 2016. http://www.who.int/medicines/publications/pharmacovigilance_tb/en/.
35. Magis-Escurra C, van den Boogaard J, Ijdema D, Boeree M, Aarnoutse R. Therapeutic drug monitoring in the treatment of tuberculosis patients. Pulm Pharmacol Ther. 2012; 25:83–86. PMID: 22179055.
36. Burtis CA, Ashwood ER, Bruns DE, editors. Tietz Textbook of Clinical Chemistry and Molecular Diagnostics. 5th ed. St. Louis: Elsevier Health Sciences;2012.
37. Heysell SK, Moore JL, Keller SJ, Houpt ER. Therapeutic drug monitoring for slow response to tuberculosis treatment in a state control program, Virginia, USA. Emerg Infect Dis. 2010; 16:1546–1553. PMID: 20875279.
38. Perwitasari DA, Atthobari J, Wilffert B. Pharmacogenetics of isoniazid-induced hepatotoxicity. Drug Metab Rev. 2015; 47:222–228. PMID: 26095714.
39. Sprague DA, Ensom MH. Limited-sampling strategies for anti-infective agents: systematic review. Can J Hosp Pharm. 2009; 62:392–401. PMID: 22478922.
40. Wang L, McLeod HL, Weinshilboum RM. Genomics and drug response. N Engl J Med. 2011; 364:1144–1153. PMID: 21428770.
41. Matsumoto T, Ohno M, Azuma J. Future of pharmacogenetics-based therapy for tuberculosis. Pharmacogenomics. 2014; 15:601–607. PMID: 24798717.
42. Selinski S, Blaszkewicz M, Ickstadt K, Hengstler JG, Golka K. Improvements in algorithms for phenotype inference: the NAT2 example. Curr Drug Metab. 2014; 15:233–249. PMID: 24524665.
43. Caudle KE, Klein TE, Hoffman JM, Muller DJ, Whirl-Carrillo M, Gong L, et al. Incorporation of pharmacogenomics into routine clinical practice: the Clinical Pharmacogenetics Implementation Consortium (CPIC) guideline development process. Curr Drug Metab. 2014; 15:209–217. PMID: 24479687.
44. Whirl-Carrillo M, McDonagh EM, Hebert JM, Gong L, Sangkuhl K, Thorn CF, et al. Pharmacogenomics knowledge for personalized medicine. Clin Pharmacol Ther. 2012; 92:414–417. PMID: 22992668.
45. McDonagh EM, Boukouvala S, Aklillu E, Hein DW, Altman RB, Klein TE. PharmGKB summary: very important pharmacogene information for N-acetyltransferase 2. Pharmacogenet Genomics. 2014; 24:409–425. PMID: 24892773.
46. Azuma J, Ohno M, Kubota R, Yokota S, Nagai T, Tsuyuguchi K, et al. NAT2 genotype guided regimen reduces isoniazid-induced liver injury and early treatment failure in the 6-month four-drug standard treatment of tuberculosis: a randomized controlled trial for pharmacogenetics-based therapy. Eur J Clin Pharmacol. 2013; 69:1091–1101. PMID: 23150149.
47. Jung JA, Kim TE, Lee H, Jeong BH, Park HY, Jeon K, et al. A proposal for an individualized pharmacogenetic-guided isoniazid dosage regimen for patients with tuberculosis. Drug Des Devel Ther. 2015; 9:5433–5438.
48. WHO. Guideline: Nutritional care and support for patients with tuberculosis. Geneva: World Health Oragnization;2013. Accessed on Nov 2016. http://apps.who.int/iris/bitstream/10665/94836/1/9789241506410_eng.pdf.
49. Hood ML. A narrative review of recent progress in understanding the relationship between tuberculosis and protein energy malnutrition. Eur J Clin Nutr. 2013; 67:1122–1128. PMID: 23942176.
50. Grobler L, Nagpal S, Sudarsanam TD, Sinclair D. Nutritional supplements for people being treated for active tuberculosis. Cochrane Database Syst Rev. 2016; Cd006086. PMID: 27355911.
51. WHO. IMAI district clinician manual: Hospital care for adolescents and adults. Geneva, Switzerland: World Health Oragnization;2011.
52. McPherson RA, Pincus MR, editors. Henry's Clinical Diagnosis and Management by Laboratory Methods. Philadelphia: Elsevier Health Sciences;2011.
53. Choi R, Kim HT, Lim Y, Kim MJ, Kwon OJ, Jeon K, et al. Serum concentrations of trace elements in patients with tuberculosis and its association with treatment outcome. Nutrients. 2015; 7:5969–5981. PMID: 26197334.
54. Vilcheze C, Hartman T, Weinrick B, Jacobs WR Jr. Mycobacterium tuberculosis is extraordinarily sensitive to killing by a vitamin C-induced Fenton reaction. Nat Commun. 2013; 4:1881. PMID: 23695675.
55. Daley P, Jagannathan V, John KR, Sarojini J, Latha A, Vieth R, et al. Adjunctive vitamin D for treatment of active tuberculosis in India: a randomised, double-blind, placebo-controlled trial. Lancet Infect Dis. 2015; 15:528–534. PMID: 25863562.
56. Cegielski P, Vernon A. Tuberculosis and vitamin D: what's the rest of the story? Lancet Infect Dis. 2015; 15:489–490. PMID: 25863560.
57. Koo HK, Lee JS, Jeong YJ, Choi SM, Kang HJ, Lim HJ, et al. Vitamin D deficiency and changes in serum vitamin D levels with treatment among tuberculosis patients in South Korea. Respirology. 2012; 17:808–813. PMID: 22449254.
58. Choi CJ, Seo M, Choi WS, Kim KS, Youn SA, Lindsey T, et al. Relationship between serum 25-hydroxyvitamin D and lung function among Korean adults in Korea National Health and Nutrition Examination Survey (KNHANES), 2008-2010. J Clin Endocrinol Metab. 2013; 98:1703–1710. PMID: 23533242.
59. Kim JH, Park JS, Cho YJ, Yoon HI, Song JH, Lee CT, et al. Low serum 25-hydroxyvitamin D level: an independent risk factor for tuberculosis? Clin Nutr. 2014; 33:1081–1086. PMID: 24332595.
60. Hong JY, Kim SY, Chung KS, Kim EY, Jung JY, Park MS, et al. Association between vitamin D deficiency and tuberculosis in a Korean population. Int J Tuberc Lung Dis. 2014; 18:73–78. PMID: 24365556.
61. Lexicomp. Drug Information Handbook. 23th ed. Hudson, OH: Lexi-Comp;2014.
62. Peloquin CA. Using therapeutic drug monitoring to dose the antimycobacterial drugs. Clin Chest Med. 1997; 18:79–87. PMID: 9098612.
63. Kurose K, Sugiyama E, Saito Y. Population differences in major functional polymorphisms of pharmacokinetics/pharmacodynamics-related genes in Eastern Asians and Europeans: implications in the clinical trials for novel drug development. Drug Metab Pharmacokinet. 2012; 27:9–54. PMID: 22123129.
64. Kang TS, Jin SK, Lee JE, Woo SW, Roh J. Comparison of genetic polymorphisms of the NAT2 gene between Korean and four other ethnic groups. J Clin Pharm Ther. 2009; 34:709–718. PMID: 20175805.
65. Lee SY, Lee KA, Ki CS, Kwon OJ, Kim HJ, Chung MP, et al. Complete sequencing of a genetic polymorphism in NAT2 in the Korean population. Clin Chem. 2002; 48:775–777. PMID: 11978608.
66. Lee KM, Park SK, Kim SU, Doll MA, Yoo KY, Ahn SH, et al. N-acetyltransferase (NAT1, NAT2) and glutathione S-transferase (GSTM1, GSTT1) polymorphisms in breast cancer. Cancer Lett. 2003; 196:179–186. PMID: 12860276.
67. Bertrand J, Verstuyft C, Chou M, Borand L, Chea P, Nay KH, et al. Dependence of efavirenz- and rifampicin-isoniazid-based antituberculosis treatment drug-drug interaction on CYP2B6 and NAT2 genetic polymorphisms: ANRS 12154 study in Cambodia. J Infect Dis. 2014; 209:399–408. PMID: 23990572.
68. Garte S, Gaspari L, Alexandrie AK, Ambrosone C, Autrup H, Autrup JL, et al. Metabolic gene polymorphism frequencies in control populations. Cancer Epidemiol Biomarkers Prev. 2001; 10:1239–1248. PMID: 11751440.
69. Sabbagh A, Langaney A, Darlu P, Gerard N, Krishnamoorthy R, Poloni ES. Worldwide distribution of NAT2 diversity: implications for NAT2 evolutionary history. BMC Genet. 2008; 9:21. PMID: 18304320.
70. Sabbagh A, Darlu P, Crouau-Roy B, Poloni ES. Arylamine N-acetyltransferase 2 (NAT2) genetic diversity and traditional subsistence: a worldwide population survey. PLoS One. 2011; 6:e18507. PMID: 21494681.
71. Villamor E, Fawzi WW. Effects of vitamin a supplementation on immune responses and correlation with clinical outcomes. Clin Microbiol Rev. 2005; 18:446–464. PMID: 16020684.
72. Gupta KB, Gupta R, Atreja A, Verma M, Vishvkarma S. Tuberculosis and nutrition. Lung India. 2009; 26:9–16. PMID: 20165588.
73. Verrall AJ, Netea MG, Alisjahbana B, Hill PC, van Crevel R. Early clearance of Mycobacterium tuberculosis: a new frontier in prevention. Immunology. 2014; 141:506–513. PMID: 24754048.
74. Madebo T, Lindtjorn B, Aukrust P, Berge RK. Circulating antioxidants and lipid peroxidation products in untreated tuberculosis patients in Ethiopia. Am J Clin Nutr. 2003; 78:117–122. PMID: 12816780.
75. Rodriguez GM, Neyrolles O. Metallobiology of Tuberculosis. Microbiol Spectr. 2014; 2.
76. Minchella PA, Donkor S, Owolabi O, Sutherland JS, McDermid JM. Complex anemia in tuberculosis: the need to consider causes and timing when designing interventions. Clin Infect Dis. 2015; 60:764–772. PMID: 25428413.
77. Hood MI, Skaar EP. Nutritional immunity: transition metals at the pathogen-host interface. Nat Rev Microbiol. 2012; 10:525–537. PMID: 22796883.
78. Shi X, Darwin KH. Copper homeostasis in Mycobacterium tuberculosis. Metallomics. 2015; 7:929–934. PMID: 25614981.
79. Neyrolles O, Wolschendorf F, Mitra A, Niederweis M. Mycobacteria, metals, and the macrophage. Immunol Rev. 2015; 264:249–263. PMID: 25703564.
80. Arthur JR, McKenzie RC, Beckett GJ. Selenium in the immune system. J Nutr. 2003; 133:1457s–1459s. PMID: 12730442.
81. Hoffman AE, DeStefano M, Shoen C, Gopinath K, Warner DF, Cynamon M, et al. Co(II) and Cu(II) pyrophosphate complexes have selectivity and potency against Mycobacteria including Mycobacterium tuberculosis. Eur J Med Chem. 2013; 70:589–593. PMID: 24211634.
82. Perez-Guzman C, Vargas MH, Quinonez F, Bazavilvazo N, Aguilar A. A cholesterol-rich diet accelerates bacteriologic sterilization in pulmonary tuberculosis. Chest. 2005; 127:643–651. PMID: 15706008.
Fig. 1

Metabolic pathways of isoniazid in human.

Abbreviations: NAT2, N-acetyltransferase 2; CYP2E1, cytochrome P450 2E1; GST, glutathione S-transferase.
alm-37-97-g001
Table 1

Pharmacokinetic characteristics of anti-tuberculosis drugs

alm-37-97-i001
Drug Usual dose Serum Cmax (µg/mL) Serum Tmax (hr) Serum T½ (hr) CSF Penetration (%) Protein Binding (%) VD (L/kg) Renal exc. (%) Hepatic clearance (%) Active metab. Metab. exc. (%) Dose renal failure Dose hepatic dis.
Isoniazid 300 mg daily 3–6 0.75–2 Polymorphic 20–100 10 est. 0.6–1 est. Polymorphic Polymorphic None Renal (50–60) and nonrenal Unchanged or reduced to every other day Unchanged in most patients
900 mg biw 9–15 fast: 1.5; slow: 4 fast: 10, slow: 30 fast: 90, slow: 70
Rifampin 600 mg daily 8–24 2 2–3 5–20 est. Variable 60–80 est. 0.6–1 est. 10 90 Yes: deacetyl Renal (20) and nonrenal Unchanged in most patients Unchanged in most patients
Rifabutin 300 mg daily 0.45–0.90 3–4 25–36 30–70 70–90 8–9 10 90 Yes: 25-O- deacetyl Renal (35) and nonrenal Unchanged in most patients Unchanged in most patients
Rifapentine 600 mg daily* 8–30 5 15
Pyrazinamide 25–35 mg/kg daily 20–60 1–2 9 50–100 Not known 0.6–0.7 est. 5 95 None Renal 15–30 mg/kg
3×weekly
Not known
50 mg/kg biw 60–90
Ethambutol 25 mg/kg daily 2–6 2–3 Biphasic: 2–4, then 12–14 5–65 est. Variable 6–30 est. 1.6–3.8 80 20 None None 15–25 mg/kg
3×weekly
Unchanged
50 mg/kg biw 4–12
Cycloserine 250–500 mg daily or biw 20–35 2 7 50–80 Not known 0.2–0.35 est. 70–100 Not known Not known Not known 250–500 mg
3×weekly
Unchanged
Ethionamide 250–500 mg daily or biw 2–5 2 2 20–100 est. Not known, 30 est. 1.5–4 est. 5 95 Yes: sulfoxide Nonrenal Unchanged Not known
Streptomycin/kanamycin/amikacin 15 mg/kg daily 35–45 0.5–1.5 IM dose or calculated to the end of IV infusion 3 20–40 est. 0–60 est. 0.2–0.3 >95 0 None None 12–15 mg/kg
3×weekly
Unchanged
25 mg/kg biw 65–80
PAS granules 4,000 mg bid 20–60 4–8 1 10–50 50–73 (15 in some reports) 0.8–3.8 est. 10 90 None Renal Unknown: avoid if possible Not known
Levofloxacin 500–1,000 mg daily 8–13 1–2 9 60–80 24–38 1.27 <92 Minimal None Renal 250–1,000 mg
3×weekly
Unchanged in most patients
Moxifloxacin 400 mg daily 3–5 1–2 7 70–80 30–50 1.7–2.7 20 25 None Renal (<5) and nonrenal Unchanged Unchanged in mild impairment
Linezolid 600–300 mg
1–2 times daily
12–26 1.5 5–6 80–100 31 0.45–0.67 30 60 None Renal (50) and nonrenal Unchanged Unchanged in mild impairment
Clofazimine 100 mg daily 0.5–2.0 2–7 Biphasic: several days, then many weeks Not known Not known Not known <1 Yes (% unknown) None Nonrenal Unchanged Unchanged

Information in the table is from the following references [166162].

*The US FDA approved dose is two times weekly in the initial phase and once weekly in the continuation phase for selected patients [16]; Calculated Cmax to 1 hr post-IM dose or end of IV infusion (using linear regression).

Abbreviations: metab., metabolite; VD, volume of distribution; bid, twice daily; biw, twice weekly; Cmax, peak serum concentration; CSF, cerebrospinal fluid; est., estimated; exc., excretion; IM, intramuscular; IV, intravenous; PAS, para-aminosalicylic acid; Tmax, the time at which Cmax occurs; T½, half-life.

Table 2

Frequencies of NAT2 alleles (%) in different ethnic groups

alm-37-97-i002
NAT2 allele Japanese
n=731
[63]
Japanese
n=45
[64]
Korean
n=1,000
[65]
Korean
n=193
[64]
Korean
n=555
[66]
Chinese
n=506
[63]
Cambodian
n=307
[67]
Caucasian
n=3,531
[68]
European
n=60
[64]
African
n=60
[64]
West African
n=97
[69]
*4 69.3 69.3 65.7 62.4 62.3 60.0 40.1 22.6 - 8.9 9.3
*5 1.4 - 1.6 - 1.9 4.3 11.3 46.0 53.3 71.6 36.1
*6 20.5 22.7 20.1 22.4 21.2 22.7 31.4 28.5 - - 17.0
*7 8.8 - 11.5 15.2 13.5 13.0 17.2 2.9 - - 6.7
*11 - - - - - - - - 44.4 19.4 -
*12 - 8.0 0.8 - 0.5 - - - - - 15.5
*13 - 0.1 0.1 - 0.7 - - - 2.3 - 5.2
*14 - - - - - - - - - - 10.3
*18 - - - - - - - - - - -

Rapid NAT2 alleles (*4, *11, *12, *13, and *18); Slow NAT2 alleles (*5, *6, *7, and *14).

Table 3

Assignment of likely phenotypes (acetylation status) based on diplotypes of NAT2 alleles

alm-37-97-i003
Likely phenotype Genotype Examples of diplotypes
Normal/high activity (rapid acetylator) 2 rapid NAT2 alleles (*4, *11, *12, *13, *18) *4/*4, *4/*12, *4/*13, etc.
Intermediate activity (intermediate acetylator) 1 rapid NAT2 allele and 1 slow NAT2 allele *4/*5, *4/*6, *5/*11, *7/*11, *13/*14, etc
Low activity (slow acetylator) 2 slow NAT2 alleles (*5, *6, *7, *14) *6/*6, *7/*7, *6/*7, *5/*6, *5/*7, etc.
Table 4

NAT2 genotype-assigned phenotype frequencies (%) in different regions of the world

alm-37-97-i004
Region Subjects (n) NAT2 acetylator status based on genotyping
Slow acetylators Intermediate acetylators Rapid acetylators
Europe (Caucasian) 5,382 58.0 (9.0) 34.0 (6.0) 8.0 (9.0)
Africa 1,034 46.0 (19.0) 40.0 (14.0) 14.0 (14.0)
Asia 1,790 45.0 (20.0) 37.0 (13.0) 18.0 (19.0)
Middle and South America 0824 27.0 (18.0) 52.0 (15.0) 21.0 (16.0)
East Asia (Chinese, Korean, and Japanese) 2,062 14.0 (5.0) 46.0 (7.0) 40.0 (8.0)
Korean [65] 1,000 0009.6 0046.9 0042.8

Slow alleles (S)=NAT2*5, *6, *7 and *14; Rapid alleles (R)=NAT2*4, *12 and *13.

NAT2 acetylator status based on genotyping: slow acetylators=S/S, intermediate acetylators=R/S, rapid acetylators=R/R.

Data are expressed as means (SD).

Data taken from [4170].

Table 5

Measurable nutrients and trace elements and their potential implications in tuberculosis infection

alm-37-97-i005
Nutrients and trace elements Potential implications References
Vitamin A Inhibits multiplication of virulent bacilli in cultured human macrophages; plays a vital role in lymphocyte proliferation and in maintaining the function of epithelial tissues, and normal functioning of T and B lymphocytes, macrophage activity, and generation of an antibody response. [71, 72]
Vitamin D Plays a role in the function of macrophages, key factor in host resistance to tuberculosis; genetic variations in the vitamin D receptor were identified as a major determinant of the risk for tuberculosis. [72, 73]
Vitamin E In numerous studies, vitamin E concentration was found to be significantly lower in tuberculosis patients than it was in healthy controls and concentrations of the antioxidant vitamins A, C, and E were significantly lower in tuberculosis patients. [74]
Vitamin C The bactericidal activity of vitamin C against Mycobacterium tuberculosis is dependent on high ferrous ion levels and reactive oxygen species production, and causes a pleiotropic effect on several biological processes. Concentrations of antioxidant vitamins A, C, and E were significantly lower in tuberculosis patients than they were in healthy patients. [54, 74]
Iron Iron is essential for sustaining the life of most organisms including mycobacteria. Iron can be highly toxic because it catalyzes the generation of reactive oxygen species from normal products of aerobic respiration via the Harber-Weiss and Fenton reactions. Anemia resulting from chronic infection and/or iron deficiency could increase susceptibility to infections such as tuberculosis. [75, 76, 77]
Copper Copper is a trace element that is essential for the growth and development of almost all organisms including bacteria. Copper overload in most systems is toxic. Copper accumulates in phagosomes of macrophage infected with bacteria, suggesting that copper is involved an innate immune mechanism to combat invading pathogens. [77, 78, 79]
Zinc Decreased phagocytosis and a reduced number of circulating T-cells and reduced tuberculin reactivity are observed at least in animals with zinc deficiency. Zinc may also limit free-radical membrane damage during inflammation. The mechanisms of zinc ion toxicity may also include inactivation of iron-sulfur clusters and inhibition of manganese uptake through transport competition in the bacterial periplasm. Zinc has an essential role in vitamin A metabolism. [72, 77, 78, 79]
Selenium Maintains immune processes and may play a critical role in the clearance of mycobacteria by both cell-mediated and humoral immunity. Selenium has been reported to be significant factor in developing mycobacterial diseases in HIV-positive patients. [72, 80]
Cobalt Cobalt is required for the biosynthesis of vitamin B12 and is an essential micronutrient for both M. tuberculosis and its host. Recent metal-based drugs that utilize coordination complexes of copper and cobalt have been reported to have notable selectivity and marked potency against M. tuberculosis, which suggests these metals are important for controlling tuberculosis infection. [79, 81]
Cholesterol Hypocholesterolemia is prevalent in tuberculosis patients. Decreased cholesterol levels have been reported to be associated with mortality in miliary tuberculosis patients. [72, 81, 82]
Manganese Manganese cations play a catalytic role in numerous proteins and are important in mediating resistance to oxidative stress. Manganese cation chelation by calprotectin inhibits bacterial defenses against superoxide. [77, 79]
TOOLS
Similar articles