

 PDF
PDF ePub
ePub Citation
 Print
Print


INTRODUCTION
Glycosuria, the excretion of glucose in the urine, nearly always results from elevated plasma glucose levels, except for rare abnormalities in glucose reabsorption within the tubules. Elevated urine glucose concentration therefore indicates either the presence of hyperglycemia or a defect in tubular function [1]. Diagnosing diabetes or monitoring glycemic control by assessing the amount of urinary glucose has been replaced by more reliable and accurate blood or plasma glycemic indices. Glycated hemoglobin (HbA1c) levels, commonly used as the gold standard for glycemic index, exhibit a fairly good correlation with fasting plasma glucose in a single specimen and 24-hr urinary glucose secretion [234], which in turn helps to achieve target glycemic goals.
The recent advent of sodium-glucose co-transporter 2 (SGLT2) inhibitors, which prevent glucose reabsorption from renal proximal tubules, promoting urinary glucose excretion (UGE) and decreasing plasma glucose levels [5], adds to the wide range of pharmacotherapeutic options for treating patients with diabetes. Considering the pharmacokinetics of SGLT2 inhibitors, during the use of these drugs in diabetic patients, the traditional positive relationship between levels of blood or plasma glycemic indices and the concentration or amount of secreted urinary glucose cannot be applied. The pharmacological effects of SGLT2 inhibitors include increased UGE and improvements in blood glucose indices [67]. Therefore, collecting and assessing either timed or spot glucose levels in the urine in conjunction with HbA1c levels might be of use as an alternative marker of drug response when prescribing an SGLT2 inhibitor for glycemic control. A 24-hr urine collection, however, can be bothersome to perform and is largely influenced by food intake. In contrast, overnight urine collections might exclude external factors, such as food intake, and solely be influenced by renal gluconeogenesis in the post-absorptive state [8]. Nevertheless, no published data address whether glucose in a morning spot urine collection reflects the total amount of glucose excretion during the overnight period.
In this study, we aimed to investigate whether the first voided morning spot urinary glucose-to-creatinine ratio (M-UGCR) can predict overnight 8-hr urinary glucose-to-creatinine ratio (UGCR), and determine correlations between overnight UGE and other glucometabolic parameters in Korean patients with type 2 diabetes mellitus (T2DM).
METHODS
1. Study population
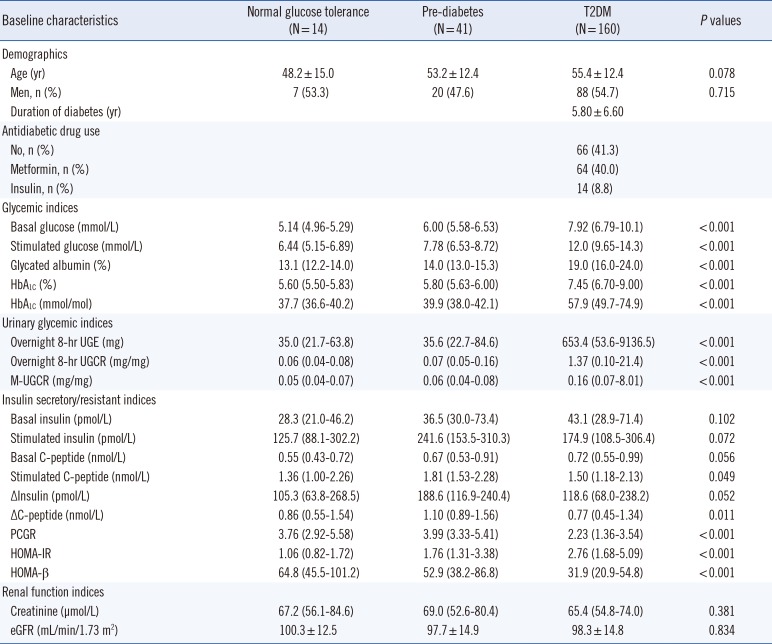
In this prospective cross-sectional study, we enrolled participants with either normal glucose levels, pre-diabetes, or T2DM, who had newly visited the Severance Hospital Diabetes Center between May 2014 and May 2015. Participants who met the following criteria were excluded: 1)<20 or ≥80 yr of age; 2) having type 1 diabetes; 3) organ transplantation recipients; 4) estimated glomerular filtration rate (eGFR)<60 mL/min/1.73 m2; 5) currently taking an SGLT2 inhibitor; and 6) pregnant women. We classified participants into three groups: those with normal glucose tolerance (NGT), pre-diabetes, and T2DM. NGT was defined as a fasting plasma glucose<5.6 mmol/L and HbA1c <5.7% (38.8 mmol/mol). Pre-diabetes was defined as a fasting plasma glucose of 5.6-6.9 mmol/L or HbA1c of 5.7-6.4% (38.8-46.4 mmol/mol). T2DM was defined on the basis of 1) the participant's use of insulin or oral hypoglycemic agents, 2) fasting plasma glucose ≥7.0 mmol/L, or 3) HbA1c ≥6.5% (47.5 mmol/mol). A total of 215 participants (mean age 55±13 yr) were enrolled in this study. Baseline demographic and laboratory characteristics of the participants are shown in Table 1. The age and gender distributions were similar among the three groups. In the group with T2DM, the average duration of diabetes and HbA1c were 5.8±6.6 yr and 7.45 (6.70-9.00)% (57.9 [49.7-74.9] mmol/mol), respectively, and basal and stimulated insulin and C-peptide levels did not significantly differ between the groups. The postprandial C-peptide-to-glucose ratio (PCGR) value, a well-validated marker of insulin secretory function, significantly decreased in the T2DM group (2.23 [1.36-3.54]), compared with the NGT and pre-diabetes groups (3.76 [2.92-5.58] and 3.99 [3.33-5.41], respectively, P<0.001). The values of homeostatic model assessment of insulin resistance (HOMA-IR) increased with increasing severity of diabetes status (1.06 [0.82-1.72], 1.76 [1.31-3.38], and 2.76 [1.68-5.09], respectively, P<0.001). Kidney function indices were not significantly different between groups. Written informed consent was obtained from all participants before the study, and the Ethics Committee of the Yonsei University College of Medicine approved the study protocol (4-2014-0220).
2. Measurements of blood glucometabolic parameters
After overnight fasting, blood samples were collected before (0 min; designated as basal) and after (90 min; designated as stimulated) ingestion of a standardized mixed-meal (Mediwell Diabetic Meal, [Maeil Dairies Co., Yeongdong-gun, Chungbuk, Korea] 2 cans; total 400 mL, 400 kcal, 18 g fat, 44 g carbohydrate, and 20 g protein) to measure glucose, insulin/C-peptide, and other parameters. Pancreatic beta cell function and insulin sensitivity were assessed by using the following indices [9]: Homeostatic model assessment of pancreatic β-cell function (HOMA-β) =[(basal insulin [pM]×0.48)/(basal glucose [mM]-3.5)]; HOMA-IR=[(basal insulin [pM] × glucose [mM]) / 156.3]; C-peptide increment (ΔC-peptide=[stimulated C-peptide (pmol/mL)-basal C-peptide (pmol/mL)]; and insulin increment (Δinsulin=[stimulated insulin (pmol/L)-basal insulin (pmol/L)]. PCGR was defined as follows [10]: [(stimulated C-peptide [ng/mL]/stimulated glucose [mg/dL])×100]. The eGFR was derived from the Chronic Kidney Disease Epidemiology Collaboration (CKD-EPI) creatinine-based equation [11]. HbA1c was measured by using an immunoassay on an Integra 800 CTS instrument (Roche, Hercules, CA, USA). Serum glycated albumin (GA) levels were determined by an enzymatic method (LUCICA GA-L, Asahi Kasei Pharma Co., Tokyo, Japan), by using a Hitachi 7600 P module auto-analyzer (Hitachi Instruments Service, Tokyo, Japan). Serum insulin and C-peptide were measured by an electrochemiluminescence immunoassay with a Cobas 600 e501 analyzer (Roche Diagnostics, Basel, Switzerland). Urine glucose level was measured by the hexokinase method, by an AU680 chemistry analyzer (Beckman Coulter, Brea, CA, USA).
3. Measurements of urinary glucometabolic parameters
To exclude external factors like food intake on glucose homeostasis, participants were advised to fast after dinner, except for water, and an overnight 8-hr urine sample from bedtime (approximately 10 P.M.) to the first-voided morning urine was collected. An 8-10-mL urine volume from the first-voided morning urine was separately collected for the first-voided morning spot urine analysis (See Supplemental Data Figure S1). The sampling day for the morning urine was the same one as for blood sampling for the standardized mixed-meal tolerance test. Urinary glucose, sodium, albumin, and creatinine levels were also measured for each sample. Urinary glycemic indices were calculated as follows: 1) overnight 8-hr UGE (mg)=[(overnight 8-hr urine glucose [mg/dL]×overnight 8-hr urine volume [mL])/100]; 2) overnight 8-hr UGCR (mg/mg)=[overnight 8-hr urine glucose (mg/dL)/overnight 8-hr urine creatinine (mg/dL)]; and 3) M-UGCR (mg/mg)=[first-voided morning spot urine glucose (mg/dL)/first-voided morning spot urine creatinine (mg/dL)]. We also calculated overnight 8-hr and first-voided morning spot (M-) urinary sodium-to-creatinine ratios (UNCRs), which showed good agreement with each other in a previous study [12], for calculating the correlation coefficient with UGCR. Overnight 8-hr albumin-to-creatinine ratios (ACRs) were calculated for each of the overnight 8-hr urine samples, as [(overnight 8-hr urinary albumin excretion [mg/dL]/overnight 8-hr urinary creatinine excretion [mg/dL])×1,000] and dividing by 8.84 to convert the units (from mg/g to mg/mmol), to classify the participants into normo-, micro-, and macroalbuminuria groups: normoalbuminuria, overnight 8-hr ACR<3.4 mg/mmol; microalbuminuria, 3.4 ≤overnight 8-hr ACR<34 mg/mmol; and macroalbuminuria, overnight 8-hr ACR ≥34 mg/mmol.
4. Statistical analyses
All statistical analyses were performed by using SPSS version 20.0 for Windows (IBM Corp., Armonk, NY, USA) and PASS (version 12, NCSS, LLC, Kaysville, UT, USA). The characteristics of the study participants were analyzed according to their diabetes status by a one-way ANOVA or Kruskal-Wallis test for continuous variables and a χ2 test for categorical variables. Continuous variables are presented as the mean±SD for normally distributed continuous variables and median (interquartile range) for non-normally distributed continuous variables. Categorical data are expressed as numbers and percentages. The correlation between the M-UGCR and overnight 8-hr UGCR was determined by calculating the Spearman's correlation coefficient. Correlation statistics were interpreted as slight (0-0.2), fair (>0.2 to 0.4), moderate (>0.4 to 0.6), substantial (>0.6 to 0.8), and almost perfect (>0.8) agreement [13]. The reliability of measurements between the M-UGCR and overnight 8-hr UGCR was analyzed by calculating the intraclass correlation coefficient (ICC). A Bland-Altman plot was used to assess the agreement between M-UGCR and overnight 8-hr UGCR. A Spearman's correlation analysis was performed to determine the correlation between UGCRs and other parameters. Backward multiple linear regression analysis was performed for modeling the relationship between overnight 8-hr UGE or M-UGCR and demographic, glycemic, insulin secretory/resistant, and biochemical parameters. All P values< 0.05 were considered statistically significant.
RESULTS
1. Urinary glycemic indices of study participants
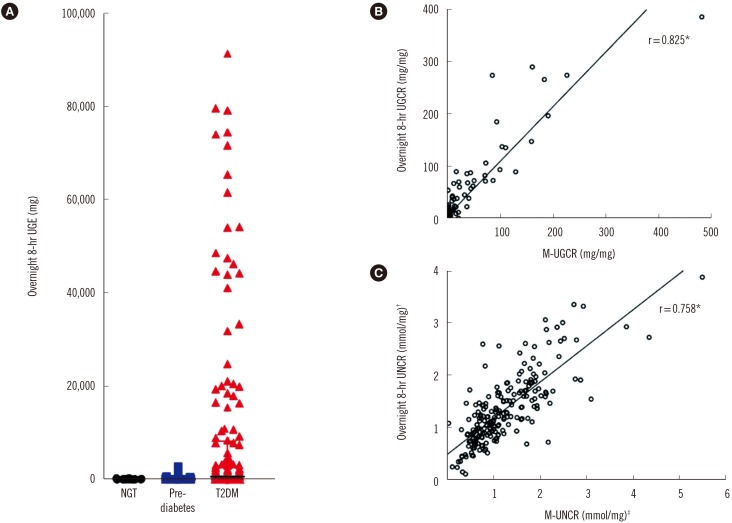
In the group with T2DM, the values of overnight 8-hr UGE showed a marked variation ranging from 5 mg to 151,000 mg (Fig. 1A). The median values of overnight 8-hr UGE in participants with NGT (N=14), pre-diabetes (N=41), and T2DM (N=160) were 35.0 mg, 35.6 mg, and 653.4 mg, respectively. In participants with T2DM, the median values of overnight 8-hr UGCR and M-UGCR were 1.37 mg/mg and 0.16 mg/mg, respectively.
2. Correlation between overnight 8-hr UGCR and M-UGCR
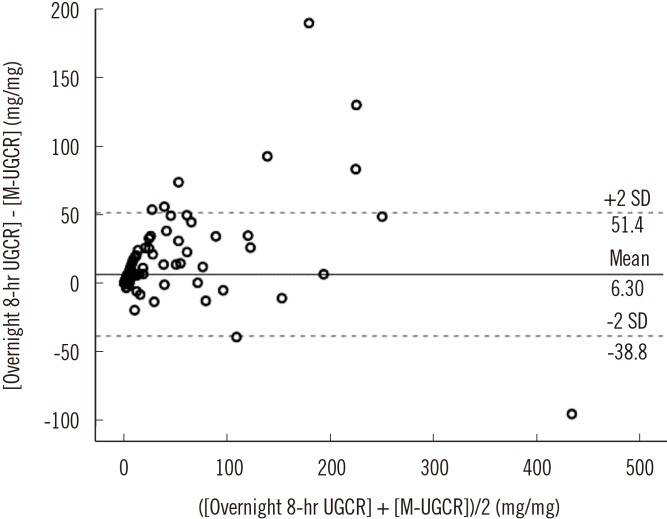
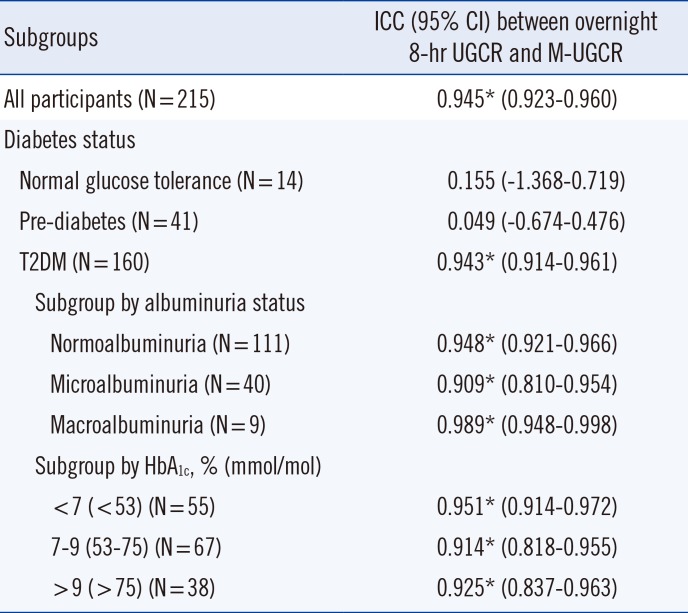
Spearman's correlation analyses determined that M-UGCR showed an almost perfect positive relationship with overnight 8-hr UGCR (r=0.825, P<0.001; Fig. 1B). We also calculated overnight 8-hr UNCR and M-UNCR, which are well known to exhibit good agreement with each other, for comparing the correlation coefficient with that of UGCRs [12]. The value of Spearman's r was 0.758 between UNCRs (P<0.001) in our study population (Fig. 1C). Therefore, the statistical association of M-UGCR with overnight 8-hr UGCR was stronger than that of UNCRs. ICCs were calculated to assess the reliability of measurements between M-UGCR and overnight 8-hr UGCR (Table 2). The ICC value was 0.945 (95% confidence interval [CI] 0.923-0.960; P<0.001) for all participants. Among diabetes status subgroups, the correlation between M-UGCR and overnight 8-hr UGCR was statistically significant only in T2DM (ICC=0.943, 95% CI 0.914-0.961; P<0.001). Moreover, regardless of the severity of albuminuria or glycemic control, M-UGCR and overnight 8-hr UGCR displayed good measurement reliability in participants with T2DM. A Bland-Altman plot showed that M-UGCR tended to underestimate overnight 8-hr UGCR (Fig. 2). We drew a calculation formula for 8-hr UGCR using M-UGCR by simple linear regression analysis. We propose the following formula:
3. Correlations between UGCRs and Other Parameters in T2DM
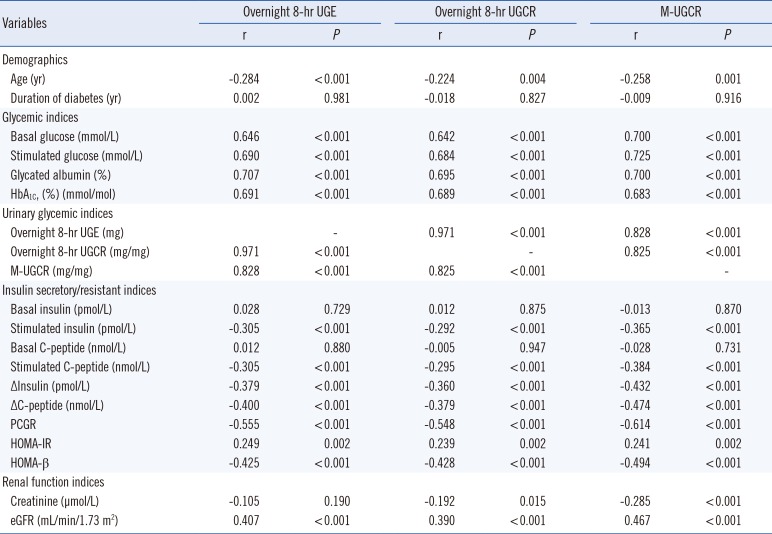
Correlations between overnight 8-hr M-UGCR and UGE, as well as other clinico-biochemical parameters are shown in Table 3. Age was negatively correlated with all UGCRs and UGE. Glycemic indices, including basal and stimulated glucose, GA, and HbA1c, showed a substantial positive correlation with UGCRs and UGE. Regarding insulin secretory/resistant indices, stimulated insulin and C-peptide, Δinsulin, ΔC-peptide, PCGR, and HOMA-β, factors associated with insulin secretory capacity, showed fair to substantial negative linear relationships with UGCRs and UGE. The value of eGFR showed a moderate positive correlation with UGCRs and UGE. A sample size of 160 achieved 99.9999% power in detecting a difference of -0.328 between the null hypothesis correlation of 0.50 (derived from the previous study [12] for correlations between spot and 24-hr urinary sodium excretions) and the alternative hypothesis correlation of 0.828 (the correlation coefficient between M-UGCR and overnight 8-hr UGE) by a two-sided hypothesis test with a significance level of 0.05 [141516].
4. Determinants of overnight 8-hr UGE or M-UGCR in T2DM by multiple linear regression analysis
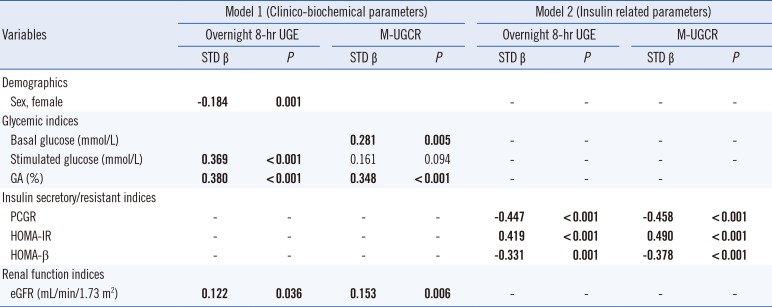
To clarify independent relationships between clinico-biochemical variables and overnight 8-hr UGE or M-UGCR in T2DM participants, we performed multiple linear regression analyses (Table 4). The analyses were performed separately for two models: In model 1, we entered clinico-biochemical parameters, including age, sex, duration of diabetes, basal glucose, stimulated glucose, GA, HbA1c, and eGFR, as independent factors and overnight 8-hr UGE as a dependent factor. Female sex (standardized [STD] β=-0.184, P=0.001), stimulated glucose level (STD β=0.369, P<0.001), GA (STD β=0.380, P<0.001), and eGFR (STD β=0.122, P=0.036) were significantly associated with overnight 8-hr UGE. In model 2, with the inclusion of insulin-related parameters, such as PCGR, Δinsulin, ΔC-peptide, HOMA-IR, and HOMA-β, the three measures PCGR (STD β=-0.447, P<0.001), HOMA-IR (STD β=0.419, P<0.001), and HOMA-β (STD β=-0.331, P=0.001) were significantly associated with overnight 8-hr UGE. Analyses were conducted for M-UGCR, using the same independent variables, and the patterns of M-UGCR regression equations were similar to those for overnight 8-hr UGE, except for sex.
DISCUSSION
In this study, we demonstrated that M-UGCR may be used as a simple index for estimating overnight UGE (8-hr UGE) in patients with T2DM. This study demonstrated three main findings: First, we verified that overnight 8-hr UGE or UGCR is proportionally elevated with aggravated glucose tolerance. Second, with respect to the intra-class correlation between overnight 8-hr UGCR and M-UGCR, almost perfect, positive significance was found only in participants with T2DM, regardless of albuminuria stage or HbA1c levels. Third, glucose levels, beta cell response to stimulation, and eGFR were associated with overnight 8-hr UGE.
To achieve optimal glycemic control in diabetes management, we hypothesized that glucose monitoring in conjunction with HbA1c is beneficial in the context of SGLT2 inhibitor treatment. Influential variables affecting UGE include the circulating glucose loading to the glomeruli, glomerular capacity to filter glucose into the renal tubule, and albuminuria [171819]. On the basis of previous studies [171819], we attempted to minimize the effects of glomerular filtration capacity by excluding participants who had less than 60 mL/min/1.73 m2 of eGFR, and adjusted potential variables that may influence this analysis by adopting basal/stimulated glucose, HbA1c, and GA as glucose load to glomeruli and staged albuminuria (normo-, micro-, and macroalbuminuria) classifications. As expected, the intra-class relationship between 8-hr UGCR and M-UGCR was significantly correlated in participants with T2DM (ICCs in NGT, pre-diabetes, and T2DM were 0.155, 0.049, and 0.943, respectively). In addition, we attempted to outline interfering effects of glucose load on glomeruli and albuminuria on the relationship between 8-hr UGCR and M-UGCR through a subgroup analysis according to albuminuria status and HbA1c levels. From these subgroup analyses, we found a similar correlation between 8-hr UGCR and M-UGCR as seen in all participants with T2DM. To confer the reliability of M-UGCR reflecting 8-hr UGCR, we generated a Bland-Altman plot, which is commonly used to compare two different instruments or two measurement techniques that each are susceptible to some errors in their measurement. Based on analysis of the Bland-Altman plot, M-UGCR tended to underestimate overnight 8-hr UGCR. One plausible explanation for this result might be a progressive decline in glucose from midnight to morning, which has been noted in continuous glucose monitoring system (CGMS) device data for Korean type diabetes [202122]. Based on this deduction, a glucose level at the morning fasting time could be lower than the average overnight glucose level.
On the basis of the results of the correlation analyses for UGCRs and UGE in relation to clinico-biochemical variables, we performed multiple linear regression analyses to predict the amount of 8-hr UGE or M-UGCR in participants with T2DM. Among all demographic factors and glycemic indices, fasting or postprandial glucose levels and GA were significantly associated with overnight 8-hr UGE or M-UGCR. Regarding glycated protein to monitor average glucose excursion, the use of HbA1c as an indicator of glycemic control over a 2- to 3-month period is inferior to GA as an intermediate glycation index over a 2- to 3-week period to provide the latest information on changes in glycemic control. Since glycemic indices are mainly dependent on insulin secretory beta cell function and peripheral insulin sensitivity [23], we also conducted a multiple linear regression analysis for these variables. We found that both insulin secretory function and sensitivity indices were significant determinants for the amount of overnight 8-hr UGE or M-UGCR. Finally, by comparing UGCRs with UNCRs, which showed strong agreement between 8-hr and M-UGCRs, we confirmed the reliability of the novel methods.
Our study has some distinct strengths and potential limitations. This was a rather pioneering study to verify that M-UGCR could be used as a simple index for estimating overnight UGE in only those with T2DM, which could be a potential method to monitor the effectiveness of SGLT2 inhibitors. Additionally, we performed a standardization of glucose homeostasis markers, including insulin secretion and sensitivity, notwithstanding stimulated glucose, through a mixed meal tolerance test. Finally, by comparing UGCRs and UNCRs, which showed strong agreement between 8-hr and M-UGCR, we conferred greater reliability of the modified method for glucose monitoring.
Regarding the limitations of our study, we did not demonstrate a clear relationship between plasma glucose concentrations and urinary glucose amounts, because we could not calculate renal threshold for glucose excretion (RTG). Since the cut-off point of maximum glucose reabsorption in the renal tubules (maximal reabsorptive capacity, TmG) is not abrupt [24], assessing RTG was impossible in this study design. Second, despite excluding the participants with less than 60 mL/min/1.73 m2 of eGFR, the glucose loads into the renal tubules are also the result of glomerular filtration rate and glucose load in the glomerular capillaries. We did not fully control the influence of glomerular capacity to filter glucose into the renal tubule. Third, we did not adjust for the effects of anti-diabetic drugs being prescribed, which might have an influence on insulin secretory function, peripheral insulin resistance, or gluconeogenesis, etc. Fourth, we did not collect information about the time, type, and amount of the last meals consumed by participants, which could be one of the reasons why M-UGCR underestimated overnight 8-hr UGCR. Finally, our study did not assess differences in UGE or UGCR in patients treated with SGLT2 inhibitors, because no participant was prescribed an SGLT2 inhibitor. Further studies enrolling subjects taking SGLT2 inhibitors are needed.
In conclusion, despite the relative underestimation of overnight 8-hr UGCR by M-UGCR, these two parameters showed strong agreement, suggesting that M-UGCR be used as a simple index for estimating the amount of UGE occurring overnight in patients with T2DM. Combined monitoring of urinary glucose levels and blood glucose indices, including HbA1c and GA, may be a better indicator of glycemic control in patients who have been prescribed SGLT2 inhibitors. Further studies are needed to understand glucose homeostasis in relation to plasma and UGE by collecting both plasma and urinary glucose concentrations for designated periods and calculating both RTG and TmG.
 XML Download