

 PDF
PDF ePub
ePub Citation
 Print
Print


INTRODUCTION
Clostridium difficile is a significant nosocomial and community-acquired pathogen, and is the leading cause of antibiotic-induced diarrhea [12]. C. difficile infection (CDI) diagnosis currently relies on clinical manifestations of diarrhea, fever, abdominal pain, and leukocytosis, supported by laboratory confirmation of toxigenic C. difficile in the stool or colonoscopic findings consistent with pseudomembranous colitis (PMC). CDI is associated with high morbidity and mortality, thus, to improve CDI management and clinical outcome, several guidelines have been suggested as factors to help define severe CDI, including patients' age, body temperature, serum albumin level, and peripheral white blood cell count [3456]. However, the proposed severity assessments have limitations, and not all recommended laboratory findings are readily accessible, making comprehensive integration difficult. Moreover, monitoring CDI after initiating therapy is often necessary, especially when a patient is treated with vancomycin. However, concerns exist regarding the risk of prolonged vancomycin use, which would exert selection pressure to promote the colonization and transmission of vancomycin-resistant enterococci and increase systemic side effects in patients with renal failure [7].
Recently, non-invasive fecal biomarkers that reflect intestinal inflammation were identified, and their CDI diagnostic values were evaluated [8]. Fecal lactoferrin, a fecal material derived from neutrophils, has been shown to correlate with CDI severity [9]. In addition, mRNA of C-X-C motif chemokine 5 (CXCL-5) and mRNA and protein of interleukin (IL)-8 correlated with clinical outcome [10], whereas positive guaiac-based fecal occult blood (FOB) showed low sensitivity in diagnosing CDI [11]. However, except for FOB, the previously investigated biomarkers are not currently available for in vitro diagnostic use in Korea, and only fecal calprotectin (FC) level is currently used for examining intestinal inflammation [12].
FC, a 36.5-kDa molecule derived from the cytoplasm of neutrophils, mononuclear cells, and squamous epithelial cells, indicates the inflammatory status of the intestinal lumen [13]. The role of FC was examined in many other gastrointestinal diseases such as inflammatory bowel disease (IBD), acute gastroenteritis, and malignancies [14]. The use of FC in CDI diagnosis was also demonstrated in a few studies; however, this marker showed restricted utility for assessing CDI severity [1115]. We investigated demographics of subjects according to severity of CDI and demonstrated the diagnostic value of FC to determine its potential as an alternative biomarker for monitoring CDI severity.
METHODS
1. Subjects
Seventy-one healthy control subjects and 80 CDI subjects were randomly selected for this retrospective study. Subjects were recruited among patients whose stool samples were requested for routine fecal immunochemical test in medical examinations and for C. difficile culture, respectively, between March and October of 2015. This study was conducted at a University tertiary referral hospital in Seoul, South Korea, and it was approved by the Intstitutional Review Board of Severance Hospital. The demographics of subjects were assessed by reviewing hospital records and laboratory results (Table 1).
2. Definitions
Since FC level can be increased under some circumstances [16], subjects without possible intestinal inflammation were selected as healthy controls. CDI patients were strictly defined by the presence of symptoms, usually including diarrhea, and a positive test for toxigenic C. difficile culture as determined by GeneXpert C. difficile PCR assay (Cepheid, Sunnyvale, CA, USA) and toxin B PCR.
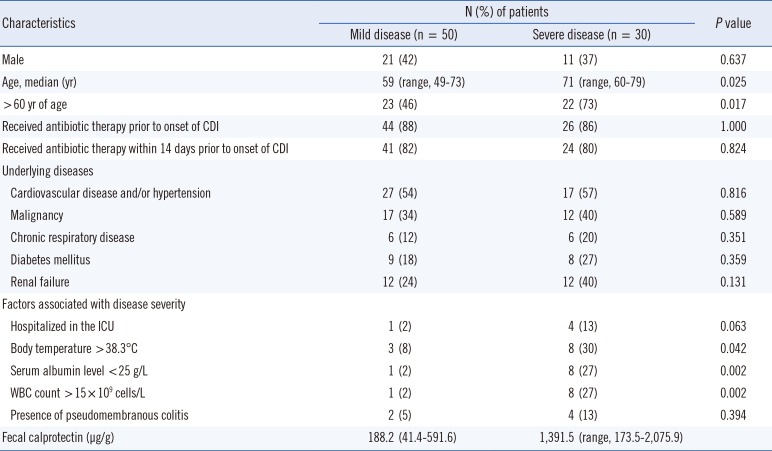
CDI patients were divided into mild and severe groups based on a severity assessment score developed by Zar et al [6]. Patients with a score of ≥2 were considered to have severe CDI. One point each was given for age of >60 yr, body temperature >38.3℃, albumin level <25 g/L, or peripheral white blood cell count >15×109 cells/L within 48 hr of enrollment. In the case of endoscopic evidence of PMC or treatment in the intensive care unit, 2 points were given.
3. Measurement of FC
FC was measured in a single frozen stool sample from all subjects by using a commercially available ELISA kit: Calprotectin Bühlmann ELISA (Bühlmann Laboratories AG, Schönenbuch, Switzerland). Experimental samples were assayed with the standards and controls included with the kit according to the manufacturer's instructions. The supernatants were diluted 3-fold if a higher concentration was expected.
4. Statistical analyses
Statistical analyses were performed by using SPSS software (version 23.0; SPSS Inc., Chicago, IL, USA). Means of normally distributed quantitative values in more than two groups were compared by one-way analysis of variance, whereas non-normally distributed quantitative values were compared by using the Kruskal-Wallis test. Non-parametric tests were used to determine whether clinical characteristics differed between the mild CDI group and severe CDI group, including the Mann-Whitney U test, Pearson's chi-square test, and Fisher's exact test. A two-tailed value of P <0.05 was considered statistically significant. ROC curve was analyzed to identify the optimal cut-off values for our study.
RESULTS
1. Characteristics of CDI patients
Among the 80 CDI subjects enrolled in the study, 50 had mild CDI and 30 had severe CDI. Baseline characteristics are shown in Table 1. There was no statistically significant difference in the history of antibiotic therapy between the two groups or in specific underlying diseases.
2. Diagnostic accuracy of FC and cut-off values according to CDI severity
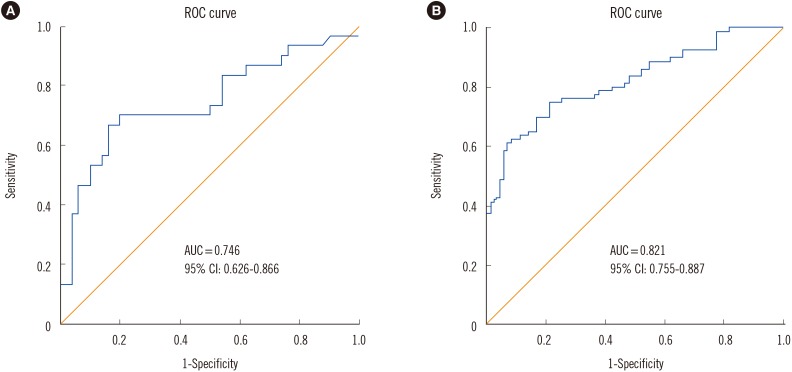
The median FC level was significantly higher (1,391.5 µg/g; interquartile range [IQR]=173.5-2,075.9 µg/g) in the severe CDI group than in the mild CDI group (188.2 µg/g; IQR=41.4-591.6 µg/g) (P <0.001). The area under the ROC curve (AUC) was 0.746 for CDI severity with an optimum FC value of 729.8 µg/g, sensitivity of 70%, and specificity of 80% between severe CDI and mild CDI cases. The AUC was 0.821 for CDI diagnosis, with an optimum FC value of 112.5 µg/g, sensitivity of 75%, and specificity of 79% between CDI and non-CDI cases (Fig. 1).
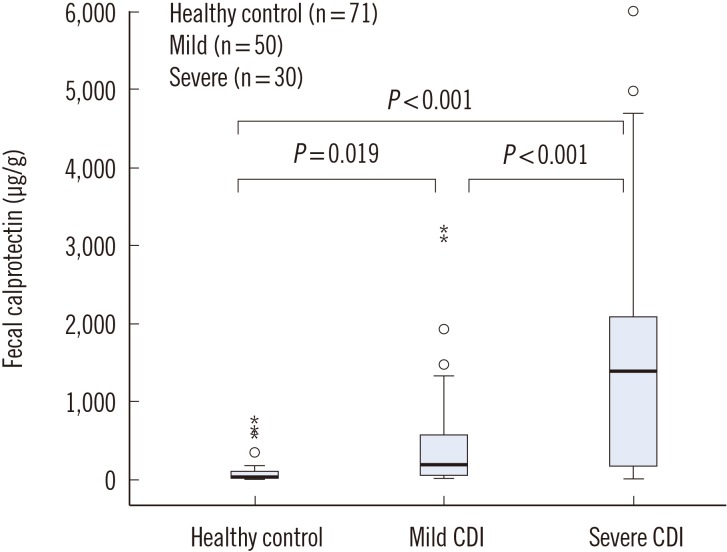
FC concentrations were higher (P <0.001) in the 30 severe CDI patients (median, 1,391.5 µg/g; IQR, 170.0-2,088.1 µg/g) than in the 50 mild CDI patients (median, 188.2 µg/g; IQR, 41.4-188.2 µg/g), and both were higher than those of the healthy controls (median, 35.6 µg/g; IQR, 10.7-108.9 µg/g) (P =0.019 and P <0.001 for mild CDI and severe CDI, respectively) (Fig. 2).
DISCUSSION
Careful consideration is essential when changing antibiotic regimens, and prompt and objective evidence can guide appropriate therapy [17]. However, many approaches currently used in the laboratory diagnosis of CDI are time-consuming and costly, providing limited information on disease severity [18]. According to the current guidelines, when initiating antibiotic therapy is necessary, oral metronidazole is recommended in cases of non-severe CDI and vancomycin is recommended for severe or refractory CDI [4]. Therefore, it is important to confirm infection severity with a reliable biomarker, which can in turn serve as a guide for selecting antibiotic regimens that best reflect CDI status. This objective assessment would allow for improved patient care to overcome the current limitations of continuous monitoring and to reduce side effects and the potential for therapeutic resistance.
The diagnostic significance of FC has been assessed in many gastrointestinal disorders, and its concentration in healthy subjects is generally below 50 µg/g [19], which was concordant with the levels of the subjects included in our study. However, FC concentrations have been reported to be as high from 994 mg/L [11] to about 2,000 µg/g [15]. Eleven CDI patients (13.8% of the 80 patients) in this study had high FC concentrations (over 2,000 µg/g), including one patient with a level of 6,000 µg/g who had a total severity score of 3 points, with persistent watery diarrhea and fulminant PMC. These findings indicate greater intestinal inflammation, which may reflect the significant morbidity and mortality associated with severe CDI.
Previous studies have shown the diagnostic utility of FC in CDI, in which the patients' status was confirmed by a combination of toxin ELISA, quantitativePCR, or toxigenic C. difficile culture, which differs from the more accurate practice of CDI diagnosis routinely performed in our hospital, where the diagnosis is made by toxigenic C. difficile culture, GeneXpert C. difficile PCR assay, and toxin B PCR [1520]. Furthermore, to verify the diagnostic significance of FC, we strictly excluded patients and healthy controls with gastrointestinal disorders other than CDI, which can influence FC levels.
Here, we demonstrated that FC significantly correlated with CDI severity and could effectively discriminate among severe CDI, mild CDI, and healthy controls. FC showed a particularly strong ability to distinguish CDI patients from healthy controls according to the respectable AUC value, higher sensitivity, and high specificity.
There are currently no guidelines concerning the use of fecal biomarkers for estimating CDI severity. Fecal biomarkers have been proposed and widely studied as potential non-invasive alternatives in IBD research; however, potential biomarkers that can serve as indicators of disease and disease stratification are also needed to more effectively direct CDI treatment. We suggest FC as a predictive marker for assessing CDI severity, which is expected to improve the clinical management of this condition.
 XML Download