

 PDF
PDF ePub
ePub Citation
 Print
Print


INTRODUCTION
An approaching “wave of automation” is gradually making its way towards application in diagnostic microbiology laboratories [12]. The first sign of this wave was evident in the introduction of systems that automate manual processes such as culture plate inoculation, incubation, and plate transport to and from workstations. These systems can be integrated into plate imaging instruments that provide microbiologists with the ability to read cultures at computer workstations rather than by the traditional method involving the manual handling of plates [134]. This latter feature is evolving rapidly and promises to offer reduced plate handling with an increase in reporting efficiencies as well as the provision of culture image archives for case review and training purposes [4].
The development of image analysis in microbiology has not progressed as quickly as applications currently in use within some other diagnostic disciplines such as hematology, histology, and cytopathology. However, signs of change were seen in 2008 following a report on the detection and identification of colonies from food and environmental samples using a spectral imaging method [5]. The detection of Campylobacter spp. from food was similarly reported a few years later [6], as was the detection of methicillin-resistant Staphylococcus aureus (MRSA) and urine pathogens from chromogenic agars using the Biomic V3 digital image analyzer (Giles Scientific Inc., Santa Barbara, CA, USA). More recently, two evaluations of culture plate image analysis technologies have been published. One described the automated detection of MRSA on chromogenic agar [7], and the other described detection of urinary pathogens on blood and MacConkey agar plates [8].
In this study, we report findings from the multicenter application of an image analysis technology, Automated Plate Assessment System (APAS; LBT Innovations Ltd., Adelaide, Australia), following an earlier pilot study [8]. The primary aim of the current study was to determine if the image analysis technology could be reliably applied to screen routine urine cultures in a number of laboratories and in two different countries. A secondary aim was to determine any differences between traditional plate reading (TPR) and digital plate reading (DPR) from on-screen images. DPR is now integral to some of the large automation systems being installed within microbiology laboratories [4], although little has been published regarding its efficiency, utility, and limitations.
Go to : 
METHODS
1. Clinical evaluation sites for the assessment of image analysis
The laboratories involved were TriCore Reference Laboratories (Albuquerque, NM, USA), Australian Clinical Laboratories (formerly Healthscope Pathology; Clayton, Australia), and SydPath, St. Vincent's Hospital (Darlinghurst, Australia).
The laboratory staffs involved in this study were trained in the use of the instrumentation and the clinical trial protocols by a microbiologist from LBT Innovations Ltd. (Adelaide, Australia), and their proficiency was checked before testing commenced.
Urine samples submitted for routine culture to each laboratory were included in the study after the completion of routine testing, and were then de-identified as per the protocols approved by each of the participant laboratories. Site 1 analyzed samples over a 15-week period in 2015, Site 2 analyzed samples for 3 weeks in 2014, and Site 3 analyzed samples for 7 weeks in 2015. The samples were sourced from community clinics and hospitals with a variety of age groups and clinical presentations represented.
Cultures were prepared by inoculating 1 µL of well-mixed urine onto 90-mm plates of trypticase soy agar with 5% v/v sheep blood and on MacConkey agar (Remel, Lenexa, KS, USA), and were incubated aerobically for 18 hr at 35±2℃.
Urine samples included in the study were 73.0% from females, 27.0% from males, and three samples from patients of unspecified gender. The age distribution was as follows: 10.8% ≤20 yr, 25.9% 20–39 yr, 23.2% 40–59 yr, 28.4% 60–79 yr, and 11.7% ≥80 yr.
2. Instrumentation
The APAS instruments used in the analyses were prototypes, consisting of a lighting module, digital camera, and analytical software. High-quality monitors (Dell U3014, 30″ wide, 2,560×1,600 pixels at one site, and LG 27EA83-B, 2,560×1,440 pixels at the other two sites) were linked to the system for the review of the digital images. The monitors incorporated a magnification facility as well as a grid overlay to assist with colony counting.
APAS assessed growth by enumerating colonies, determining colony morphologies for isolates, and finally applying an interpretive rule-set to the findings. Each case was then sorted into one of three groups: “Positive” for plates requiring microbiologist interpretation and further work, “Negative” for plates with a low probability of requiring further work, and “Review” where an interpretation and decision by a microbiologist was required. For the purposes of this trial, any samples in the review category were designated as positive, as this outcome required microbiologist intervention.
3. Traditional plate reading
A reference panel of three microbiologists at each center independently performed TPR on the urine cultures and recorded the quantity of growth and the colony morphologies found on the plate pairs for each sample. Panel members also recorded a sample designation of “Positive” for plates requiring further work such as isolate identification and antibiotic susceptibility testing, or “Negative” for plates with a low probability of requiring further work using a prescribed rule-set based on published guidelines for the interpretation of urine cultures [910].
After being read by the reference panels, the plates were presented to APAS for image capture and analysis within 4 hr of the 18 hr incubation period. All images and results from APAS were stored for analysis and comparison with the TPR findings. Observations of multiple colony types were recorded in both the TPR and APAS assessments.
4. Digital plate reading
As part of the secondary aim to compare DPR with TPR, 250 blood agar and MacConkey agar pairs were randomly selected for analysis from each of two laboratories (SydPath, St. Vincent's Hospital, Darlinghurst, Australia, and Australian Clinical Laboratories, Wayville, Australia).
A panel of three microbiologists at LBT Innovations Ltd., comprised of different individuals from those included in the TPR reference panels and who were experienced in DPR, independently read the culture results from the stored plate images after the TPR assessments. Panel members recorded their findings for growth enumeration and the colony morphology types present, and proposed a sample designation as positive or negative, utilizing the same assessment criteria as defined for TPR.
5. Analysis
All results were referred to an independent statistician (Emphron Informatics Pty Ltd., Brisbane, Australia), and the APAS findings were compared with the consensus, which was defined as a minimum agreement between two of the reference panel members in both TPR and DPR evaluations.
Comparisons between APAS and the panel results for growth detection, enumeration, and the differentiation of colony morphologies using sensitivity and specificity calculations were performed. Sensitivity was defined as the number of true positives divided by the number of true positives plus false negatives expressed as a percentage, and specificity was calculated as the number of true negatives divided by the number of true negatives plus false positives and expressed as a percentage.
When discrepant results were identified, the de-identified clinical laboratory reports were also compared with the data generated by APAS and the reference panels. This was performed in order to provide additional clinical information that may assist with the interpretation of data obtained in this study.
Go to :
RESULTS
1. Growth detection
From the host laboratory results, the positive culture rate was 31% and the overall proportion and type of organisms found were consistent with those reported in published studies from a number of countries [1112131415]. Growth was detected by APAS on 99.0% of the blood agar plates and on 99.5% of the MacConkey agar plates reported by the reference panel as showing growth. This resulted in a growth detection sensitivity and specificity of 99.0% (95% confidence interval [CI] 98.7% to 99.2%) and 84.5% (95% CI 83.1% to 85.9%) for blood agar, and of 99.5% (95% CI 99.2% to 99.7%) and 98.8% (95% CI 98.5% to 99.1%) for MacConkey agar, respectively.
Growth detection performance varied for different levels of growth. For blood agar, the detection sensitivity was 99.9% (95% CI 99.6% to 100%) at 105 colony-forming unit (CFU)/mL, 99.6% (95% CI 99.2% to 99.8%) at 104 CFU/mL, and 97.3% (95% CI 96.5 to 97.9%) at 103 CFU/mL. For MacConkey agar, the detection sensitivity was 99.9% (95% CI 99.6% to 100%) at 105 CFU/mL, 99.6% (95% CI 98.9% to 99.9%) at 104 CFU/mL, and 98.6% (95% CI 97.6% to 99.2%) at 103 CFU/mL.
2. Colony enumeration
APAS produced the same colony counts as the reference panel in 84.4% of cases. Of the 15.6% discrepant counts, 81.2% of the APAS counts were higher than the consensus counts, and 18.8% were lower. Of the discrepant results, 96% of the APAS counts were within 1-log of the consensus counts.
3. Organisms reported
A total of 2,586 bacterial isolates were reported by the three laboratories. The most common organism identified was Escherichia coli, which accounted for 59.1% of all organisms reported (Table 1). The organisms listed in the table represented 91.1% of microorganisms found at the three sites. The remainder represented organisms that appeared infrequently (i.e., 1–5 times throughout the study); these included, but were not limited to, Corynebacterium spp., Moraxella spp., and Streptococcus mitis.
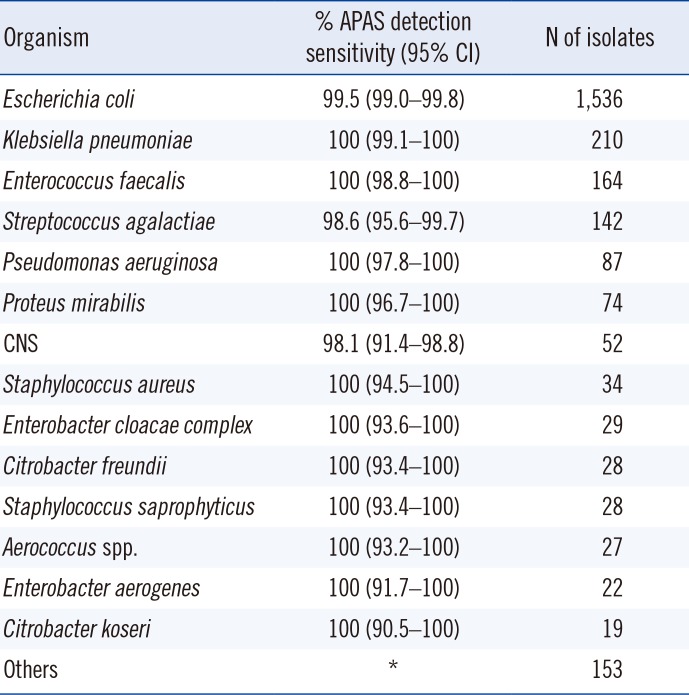
Table 1
Detection sensitivity for the most frequently isolated urinary tract pathogens
![]()
4. Case designations
The reference panels designated 6,584 cases as positive and 2,640 as negative. APAS analysis of these samples resulted in a sample designation sensitivity of 99.0% (95% CI 98.7% to −99.2%) and specificity of 84.5% (95% CI 83.1% to −85.9%) (Table 2).
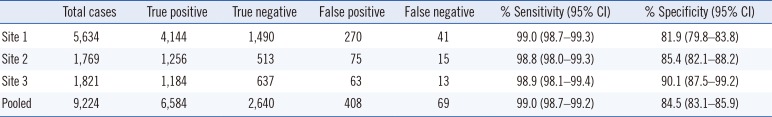
Table 2
Summary of APAS performance with urine cultures across three centers
![]()
5. Digital plate reading
For colony enumeration, the DPR results agreed with those of TPR in 92.1% of the plates studied. Of the 79 differences, 64 involved blood agar and 15 involved MacConkey agar. Of the divergent counts, 65% (51/79) were reported to be higher and 35% (28/79) were lower by DPR.
For the blood agar colony morphologies representing the Enterobacteriaceae, DPR showed a sensitivity of 99.4% and specificity of 93.4%. On MacConkey agar, agreement was noted for the lactose-fermenting colonies with a sensitivity of 98.6% and specificity of 99.7%, while the non-fermenters showed a sensitivity of 95.6% and specificity of 98.6%. Swarming Proteus spp. and hemolytic streptococci were identified by DPR with sensitivities of 100% each (Table 3).
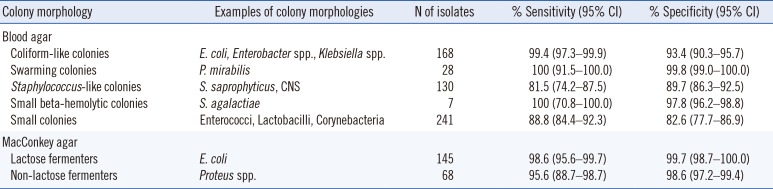
Table 3
Summary of digital plate reading performance for colony morphology identification when compared with traditional plate reading
![]()
Identification of gram-positive cocci produced sensitivities of 81.5% for the staph-like colonies and 88.8% for the various small colonies that represent a range of different species in this group. For the overall designation of cases using DPR, a sensitivity of 90.8% and specificity of 92.8% was found.
Go to :
DISCUSSION
The primary aim of this study was to determine if digital image analysis using the APAS technology was reliable for sorting cases that required further work such as isolate identification and antibiotic susceptibility testing from those that did not require further work.
APAS demonstrated a designation sensitivity of 99.0 % for its ability to sort cases and plates into a number of different action categories. This corresponded to a false-negative incidence rate of 0.7% (69/9,224) across the three centers. Analysis of these cases showed that 43.5% were reported as showing no growth and 50.7% were reported as showing no significant growth by the participating laboratories.
Our position is that limitations on the TPR panel members, who did not have access to basic colony morphology identification tests such as Gram staining or the available clinical notes as a part of this study, may have biased them toward recording more conservative “positive” results in such cases. Of the eight remaining cases, two were reported to show E. coli growth by the reference panel, but the corresponding stored images did not show any coliform-like colonies when reviewed in detail. This suggests the possibility of errors in either processing or reporting these samples by the reference panel, or in the preparation of the corresponding image as presented to APAS as there appears to be a clear mismatch of information relating to the stored images (clearly negative with no growth) and the designation of positive growth by the reference panel.
In another case where the laboratory reported the growth of Aerococcus urinae, the images did not show any growth. This case serves as a reminder that operators need to be aware of potentially complicated urinary tract infections where the extension of incubation times beyond 18–22 hr is standard practice. The stored images of the remaining five cases showed either very small colonies that were under-counted by the device or complex mixtures of colony morphologies that APAS reported as negative.
For a screening test to be reliable, it must show high sensitivity to minimize the risk of missing true positive cases [161718]. The specificity of a screening test, or the measurement of the number of false-positive findings, is of less concern from the laboratory's perspective as these cases will be examined further by skilled microbiologists before the results are released.
Digital image analysis using APAS provides a reliable method for screening urine cultures given its sensitivity of 99.0% across 9,224 samples from three separate laboratories. The method's sensitivity could be further improved if complicated urinary tract infections are identified pre-analytically and those samples are managed with additional input such as the application of higher sample volumes, direct staining of the urine, extension of incubation times, and specialized culture media [910].
This study also showed acceptable agreement between DPR and TPR results for colony identification, enumeration, and case designation. The main difference found between the methods was that DPR tended to produce higher counts than TPR.
It is probable that the differences observed were due to the improved visual discrimination of colonies by DPR. This is a predictable consequence of reading culture images from screens where plates have apparent diameters of 20–50 cm with superior illumination to those used during TPR. On-screen gridlines across the images may also have assisted the image readers in providing more accurate colony counts.
This study clearly demonstrates that DPR is different from TPR, and its introduction will likely result in a change of how microbiologists manage workloads and plate readings. The adoption of DPR will be accompanied by a need for appropriate training and adjustment periods before its routine application to ensure that it is fully utilized appropriately. In addition, the development of an appropriate validation protocol is essential along with the understanding that TPR, the current “gold standard”, has its own limitations as a reference method.
This multicenter study examined two emerging technologies: the use of digital images for assessing cultures and the application of digital image analysis. These technologies are evolving rapidly and will assist laboratories in meeting some of their current challenges such as the management of increasing demands, need for greater cost efficiency, and reduction in the time to report [1319]. Improved result traceability, a reduction in transcription errors, and the capacity to review archived images are likely to provide additional quality benefits.
Go to :
 XML Download