

 PDF
PDF ePub
ePub Citation
 Print
Print


INTRODUCTION
Hemorrhage is a major complication of hematologic malignancies and diseases involving thrombocytopenia [1]. Severe thrombocytopenia in the range of below 10×109/L or below 20×109/L is usually a major bleeding determinant [23]. However, the sensitivity and specificity of platelet count for bleeding prediction are suboptimal, although it is a rapid, inexpensive, and basic laboratory test used for treatment decisions. Controversies remain on the timing of prophylactic platelet transfusion initiation in patients with severe thrombocytopenia (platelet counts<20×109/L,<10×109/L, or even<5×10⁹/L) [4]. Not all patients with severe thrombocytopenia manifest any bleeding. On the contrary, some patients with less severe thrombocytopenia suffer from clinically significant bleeding because of other risk factors, including consumptive coagulopathy affecting coagulation and anticoagulation systems and platelet dysfunction [4]. Treatment is recommended when bleeding extends beyond the skin manifestations, irrespective of platelet counts, in some centers [56]. Since a platelet count by itself may underestimate or overestimate the patient's bleeding risks, the development of additional laboratory tests that are rapid and inexpensive and can provide additional information for bleeding prediction independent of the platelet count will be clinically useful. Assessment of platelet and other coagulation system functions is necessary to accurately predict the bleeding risk and establish a consensus management guideline for patients at increased risk of clinically significant bleeding.
Thromboelastography (TEG) is a whole blood coagulation test that provides comprehensive information on clot initiation, propagation, and fibrinolysis [7]. Previous studies reported that the maximum clot formation in the TEG is correlated with the platelet count and associated with bleeding risk [36789]. However, no reports describing an evaluation of coagulation system defects and their association with bleeding risk in hematologic patients are available.
Adequate evaluation of coagulation defect may be necessary for bleeding risk assessments and management policies because hematologic patients can bleed for various reasons, including deficiencies of coagulation factors, presence of circulating inhibitor, and alterations in platelet function and number [10]. The conventional coagulation tests, including prothrombin time (PT) and activated partial thromboplastin time (aPTT), are insufficient for the assessment of bleeding risk [11]. Thrombin generation assay (TGA), which uses a calibrated automated thrombogram, can be a good indicator of a patient's bleeding condition [1213] and plasma levels of many coagulation and anticoagulation factors [14].
We investigated whether both TEG and TGA were useful in the prediction of bleeding severity in patients with thrombocytopenia or hematologic malignancies. We also measured all coagulation factors and some anticoagulation factors to determine their contributing effects on TEG and TGA parameters. Additionally, the TEG and TGA parameters that are potentially significant for bleeding prediction were analyzed on the basis of the patient's platelet counts.
METHODS
1. Study population
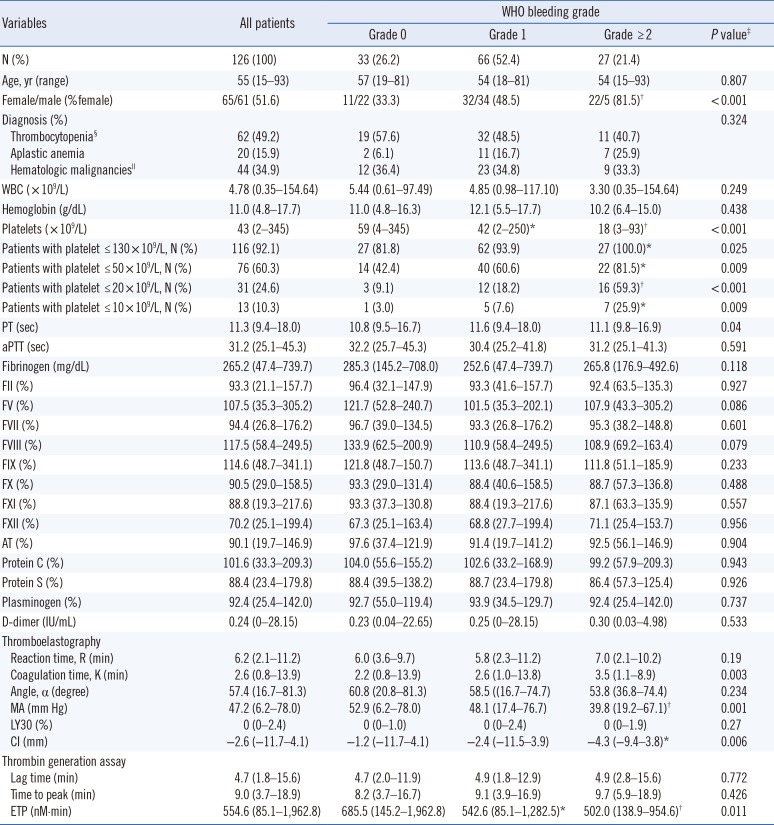
We performed TEG and TGA in 126 patients with thrombocytopenia or hematologic malignancies who were suspected of having a bleeding tendency and visited Seoul National University Hospital from March 2014 to February 2015. The bleeding tendencies were stratified on the basis of the WHO bleeding grade [15] at the time of blood sampling. Supplemental Table S1 describes the bleeding sites. The underlying diseases of the patients were thrombocytopenia due to immune thrombocytopenia (ITP) or peripheral consumption (n=62), aplastic anemia (AA; n=20), and hematologic malignancies (n=44). Considering that chemotherapy-induced thrombocytopenia has been associated with increased bleeding risks [1], patients with hematologic malignancies undergoing chemotherapy were also included (n=12) as a part of the 44 patients with hematologic malignancies. The hematologic malignancies included MDS (n=16), AML (n=16), ALL (n=4), and multiple myeloma (MM; n=8). Patients were stratified on the basis of their platelet counts (10×109/L, 20×109/L, and 50×109/L). The underlying diseases of 13 patients with platelet count<10×109/L were as follows: hematologic malignancies (eight patients; four with MDS, three with AML, and one with MM), ITP (four patients), and AA (one patient). Samples from 92 patients (73.0%) were collected at the time of diagnosis and those from 34 patients (27.0%) were collected during follow-up; from the latter group, 10 (7.9%) underwent chemotherapy. Table 1 shows the clinical and laboratory characteristics of patients who were classified based on their WHO bleeding grades. No significant differences were observed in the age distribution with regard to the WHO bleeding grade. The group with WHO bleeding grade ≥2 had more females than that with WHO bleeding grade of 0 (P<0.001). This study complied with the Declaration of Helsinki, and was approved by the Institutional Review Board of the College of Medicine of Seoul National University, and all of the patients' samples were obtained with written informed consent.
2. Blood samples and laboratory analysis
Peripheral venous blood samples were collected in 0.109 mol/L sodium citrate tube (Becton Dickinson, San Jose, CA, USA). The plasma was separated through whole blood centrifugation at 1,550g for 15 min within 1.5 hr after blood collection. The plasma aliquots were stored at −80℃. The coagulation tests, including PT, aPTT, and coagulation factor assays, were performed on an automated coagulation analyzer (ACL 3000; Instrumentation Laboratory SpA, Milan, Italy). The coagulation factors were assessed with a PT-based clotting assay using HemosIL RecombiPlasTin reagent for FII, FV, FVII, and FX (Instrumentation Laboratory SpA) and an aPTT-based clotting assay using SynthASil reagent for FVIII, FXI, FXI, and FXII (Instrumentation Laboratory SpA). Antithrombin and protein C were determined using chromogenic assays (Stachrom AT III and Stachrom Protein C; Diagnostica Stago, Inc., Parsippany, NJ, USA). Platelet and white blood cell counts were determined by using a Sysmex XE-2100 analyzer (Sysmex Corp., Kobe, Japan).
3. TEG
The TEG was performed on previously described citrated whole blood samples within 2 hr after blood collection by using a TEG Analyzer 5000 (Haemonetics Corp., Braintree, MA, USA) based on the manufacturer's instructions. Briefly, 20 µL of 0.2M calcium chloride, 20 µL of diluted human tissue factor (TF), and 340 µL of the blood sample, were added to the TEG cup. The samples were allowed to react for 90 min, and the clot formation and lysis processes were recorded as a curve. Several parameters were generated: reaction time (R, min), which represented the time from the start of the test to the initial clot formation; coagulation time (K, min), which denoted the time for clot formation to reach a 20 mm amplitude; angle (α, degree), which indicated the speed of fibrin buildup; maximum amplitude (MA), which referred to the maximum strength of the fibrin clot formation; and LY30, which represented the percentage lysis after 30 min post-MA. The R, K, α, and MA were measured by using the TEG 5000 software (Haemonetics Corp.) and incorporated into a coagulation index (CI), which was calculated by using the following equation: CI=−0.6516R−0.3772K+0.1224MA +0.0759α−7.7922.
4. TGA
Thrombin generation in TF-triggered platelet-poor plasma was measured by using the calibrated automated thrombogram method (Thrombinoscope BV, Maastricht, Netherlands) as previously described [16]. Briefly, 20 µL of reagent containing TF at a final concentration of 5 pM (PPP Reagent, Thrombinoscope BV) and phospholipids or thrombin calibrators were dispensed into each well of round-bottom 96-well plates, followed by the addition of 80 µL of test plasma samples which were collected and stored as previously described. After the addition of 20 µL of fluorogenic substrate in HEPES buffer with CaCl2, the fluorescent signal was read in a Fluoroskan Ascent fluorometer (Thermo Labsystems Oy, Helsinki, Finland). The thrombin generation curves were subsequently calculated by using a dedicated software (Thrombinoscope BV). These curves were evaluated by using the parameters that described the initiation, propagation, and termination phases of thrombin generation, that is, lag time, endogenous thrombin potential (ETP), and peak thrombin concentration (i.e., peak thrombin), respectively.
5. Statistical analysis
The data were compared by using the Mann-Whitney U test and Kruskal-Wallis analysis for quantitative variables and the χ2 test for categorical variables. Bonferroni correction for multiple testing was used to compare two variables among multiple variables. Multiple linear regression analyses were performed to investigate the individual determinants of TEG and TGA parameters. Logistic regression analyses were conducted to determine the odds ratios (ORs) for significant bleeding prediction. The ROC curves for determining WHO bleeding grade ≥2 were plotted for platelet counts and TEG and TGA parameters, and used to calculate the area under the curve (AUC). The statistical significance of the AUCs of two independent ROC curves was estimated through chi-square distribution using AUCs and their standard errors [17]. All analyses were conducted by using SPSS version 20.0 software (SPSS Inc., Chicago, IL, USA). The level of significance was set at P<0.05. When multiple hypothesis testing was performed, the P value was adjusted through Bonferroni correction.
RESULTS
1. Parameter changes of TEG and TGA based on bleeding severity
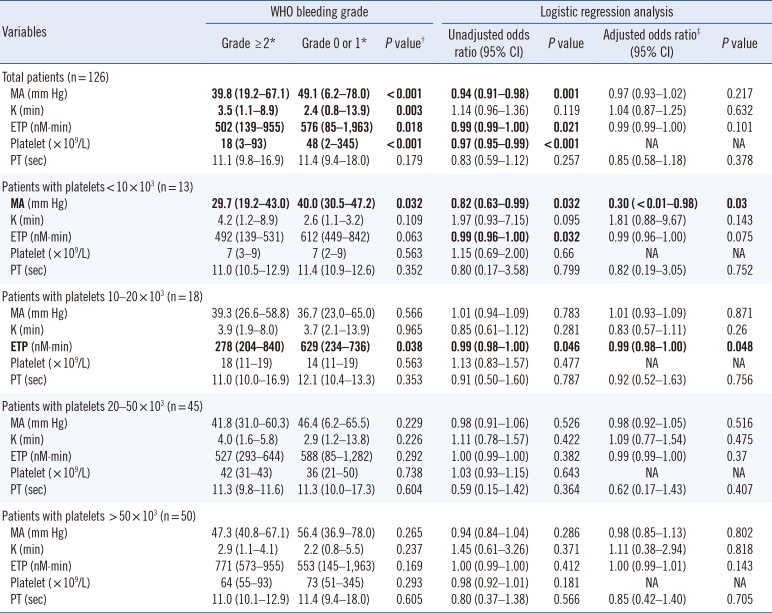
When platelet counts and coagulation test results were compared according to the WHO bleeding grades, patients with WHO bleeding grades ≥2 and 1 showed decreased platelet counts compared with those with WHO bleeding grade of 0 (P<0.001 and P=0.024, respectively). No differences in PT, aPTT, fibrinogen, or various coagulation and anticoagulation factor levels based on the WHO bleeding grade were found.
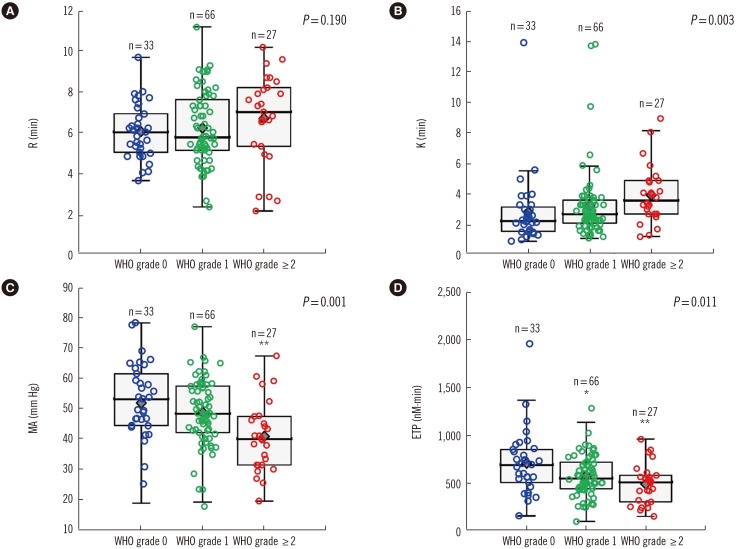
In terms of TEG parameters, K tended to be prolonged in patients with WHO bleeding grade ≥2 compared with those with WHO bleeding grade of 0, although the difference was not statistically significant (P=0.184) (Fig. 1). K was significantly prolonged in patients with WHO bleeding grade ≥2 compared with all of those with WHO bleeding grade of 0 or 1 (P=0.003). The R and angle were not statistically different on the basis of the bleeding severity. Patients with WHO bleeding grade ≥2 showed significantly decreased MA and CI compared with those with WHO bleeding grade of 0 (P=0.002 and P=0.011, respectively). Among the TGA parameters, the ETP value was significantly increased in patients with the WHO bleeding grade ≥2 compared with patients with WHO bleeding grade of 0 (P=0.004). Furthermore, patients with WHO bleeding grade ≥2 displayed lower peak thrombin than those with WHO bleeding grade of 0 (P=0.008). However, the lag time was not statistically different on the basis of the bleeding severity.
2. Determinants of TEG and TGA parameters
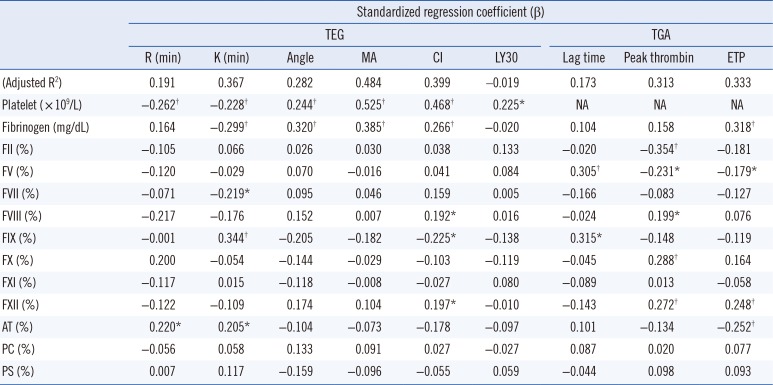
Multiple linear regression analyses were performed to investigate the contributing effects of the coagulation and anticoagulation factors on the TEG and TGA parameters (Table 2). The R value in TEG was significantly determined on the basis of the platelet counts and antithrombin levels. The significant determinants of the K value were platelet count and fibrinogen, factor VII and IX, and antithrombin levels. The angle and MA values were mainly dependent on the platelet count and fibrinogen level. The ETP value in TGA was primarily affected by fibrinogen, factor V and XII, and antithrombin levels.
3. Usefulness of TEG and TGA parameters in bleeding prediction
We selected five parameters (MA, K, ETP, platelet count, and PT) that showed associations with bleeding grade to investigate whether these parameters were significant bleeding predictors using a logistic regression model (Table 3). Significant associations were found between high bleeding grade (WHO grade ≥2) and MA (OR, 0.94; P=0.001), ETP (OR, 0.99; P=0.021), and platelet count (OR, 0.97; P<0.001) in the total patient population. Considering that platelet count was predictive of bleeding in routine clinical practice, the logistic regression analysis was repeated after adjustment for the platelet count. The platelet-adjusted OR of MA was not significant; additionally, that of ETP was no longer significant in all patients. No association was observed between PT and high bleeding grades.
When patients were stratified on the basis of their platelet counts (10×109/L, 20×109/L, and 50×109/L), MA was significantly associated with high bleeding grade (OR, 0.82; P=0.032; Table 4) in patients with platelet counts<10×109/L. However, MA was not significantly associated with high bleeding grades among patients with platelet counts >10×109/L. Moreover, ETP was significantly associated with bleeding among patients with platelet counts of 10-20×109/L (OR, 0.99; P=0.048). After adjustment for platelet counts, ETP remained a significant parameter for bleeding prediction. No parameters were associated with bleeding in patients with platelet counts >20×109/L.
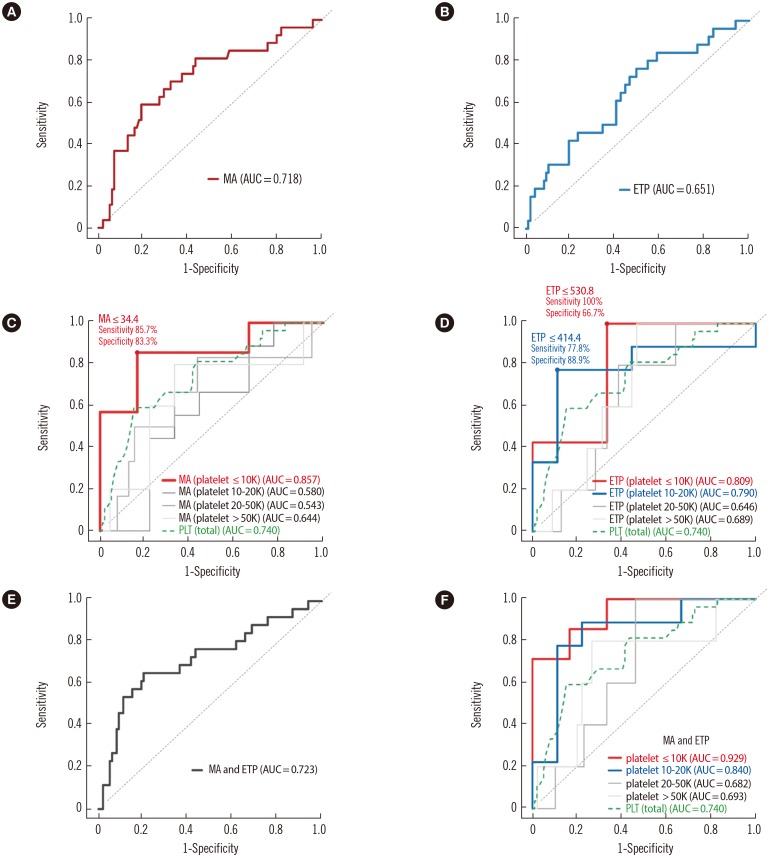
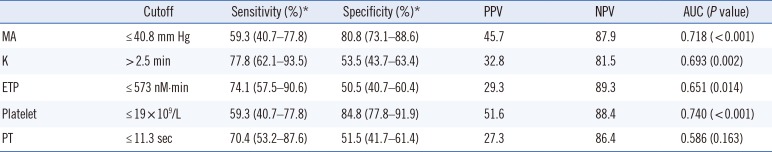
When the ROC curve was analyzed for the prediction of WHO bleeding grade ≥2, the platelet count showed the highest AUC (0.740), followed by MA (0.718) (Table 4; Fig. 2A, 2B). The patients were divided on the basis of their platelet levels, and the ROC curves of the MA and ETP values were replotted (Fig. 2C, 2D). In patients with platelet counts ≤10×109/L, the AUC of MA was 0.857, which tended to be higher than the AUC of platelet counts in all patients (AUC 0.740; Fig. 2C), although the AUCs were not different statistically (P=0.347). Using the MA cutoff value of ≤34.4 mm Hg, which was the value considered to produce the highest level of diagnostic accuracy, significant bleeding was predicted with a sensitivity and specificity of 85.7% and 83.3%, respectively, in patients with platelet counts ≤10×109/L. However, in patients with platelet counts >10×109/L, the AUC of MA was not significant for bleeding prediction. Likewise, patients with platelet counts ≤10×109/L had higher AUC values of ETP compared with those with platelet counts >10×109/L (Fig. 2D). In patients with platelet counts 10–20×109/L, the AUC of ETP was 0.790. When MA was combined with ETP in the total patient population (Fig. 2E, 2F), the AUC of the combined MA and ETP in patients with platelet counts ≤10×109/L was 0.929, which was significantly higher than the AUC of platelet counts in all patients (P=0.033) (Fig. 2F).
DISCUSSION
This study demonstrated the usefulness of TEG and TGA as bleeding predictors in patients with thrombocytopenia or hematologic malignancies (Table 4). MA in the TEG and ETP in the TGA were significant markers for bleeding on the basis of the logistic regression analysis result. However, the AUC values of MA or ETP for bleeding prediction were lower than that of the platelet count in the total patient population (Fig. 2). Interestingly, the AUC values of MA or ETP in patients with platelet counts ≤10×109/L were higher than that of the platelet count in all patients (Fig. 2C, 2D). This finding suggested the potential benefit of the TEG or TGA on bleeding prediction in severe thrombocytopenia. Using these tests, a more intensive treatment approach can be applied in patients for whom it is difficult to determine whether platelets should be transfused depending solely on the platelet count. Similar to our results, a significant correlation between some TEG parameters and bleeding has been reported in two other studies [36]. The most sensitive TEG parameter reflective of bleeding risks was MA in these studies. In our results, the MA level was significantly dependent on platelet counts and fibrinogen levels. Considering that MA was a significant bleeding predictor in patients with platelet counts ≤10×109/L, a low fibrinogen level may have an additional effect on the bleeding risk. As shown in Supplemental Table S2, a lower fibrinogen level can be found in patients with platelet counts ≤10×109/L and high bleeding scores, although this finding is not statistically significant.
We measured both TGA and TEG because the plasma levels of coagulation and anticoagulation factors, as well as platelet counts, were important for adequate hemostasis. The ETP value in the TGA represents the global thrombin amount that can be generated by all coagulation and anticoagulation factors [14]. Our results showed that patients with a bleeding grade ≥2 had decreased ETP level, which was significantly associated with bleeding in patients with platelet counts <20×109/L (Table 4). These findings suggested that patients with severe bleeding tended to have low global thrombin levels. When the MA value was combined with the ETP, the AUC value (0.929) was markedly increased in patients with platelet counts ≤10×109/L (Fig. 2). This result indicated that the coagulation and anticoagulation factor status represented by the ETP value provided additional information on the bleeding tendency. This finding may offer a potential rationale for other therapeutic approaches, including recombinant activated factor VII (rFVIIa) and fresh frozen plasma, in addition to platelet transfusion when both TEG and TGA parameters are significantly reduced. A previous study revealed that rFVIIa was an efficient treatment option for bleeding in patients with chemotherapy-induced thrombocytopenia and hematologic malignancies [18]. Additionally, rFVIIa was found to accelerate thrombin generation in those with thrombocytopenic conditions [19].
Our results also revealed the contributing effects of the individual coagulation and anticoagulation factors on TEG parameters. The R value was significantly determined by platelet count and antithrombin level, but it was not affected by other coagulation factors. However, the R value has been prolonged in deficient states of coagulation factors II, VII, X, and XII, and fibrinogen [20]. This previous study used the selective factor-deficient plasma with normal levels of other coagulation factors, whereas our study used whole blood from patients, which included various coagulation factor levels. Our results showed that the R value measured in the whole blood from patients did not exactly reflect the global hemostatic state exerted by all coagulation and anticoagulation factors.
This study had several limitations. First, we studied a broad range of underlying diseases. Considering that clinicians frequently check patients with thrombocytopenia due to various causes in the clinic and those with treated or untreated hematologic malignancies who also present with frequent bleeding problems, we enrolled a study population with various degrees of bleeding potential. We further analyzed the association between TEG and TGA parameters and bleeding risk in two separate populations (hematologic malignancies and acquired thrombocytopenia). As shown in supplemental Tables S3 and S4, the MA and K values remained to be significant bleeding predictors. In addition, to investigate the predicting availability of TEG and TGA for actual bleeding, it is recommended to follow up and monitor patients. Instead, in the present study, the bleeding risk was evaluated by using WHO bleeding risk grade cross-sectionally at a time point, which might underestimate patients' real bleeding events. Furthermore, this study did not investigate the immature platelet fraction, which has been implicated as a significant bleeding marker [36]. Finally, the number of patients was small after the stratification based on the platelet counts, with only 13 patients included in the group with platelet counts <10×109/L. Therefore, the statistical significance is limited. To obtain conclusive results, the analysis of a larger number of patients may be needed.
In summary, MA alone was less sensitive than platelet counts as bleeding predictor in the total patient population. However, MA was a powerful marker for bleeding prediction in the subgroup analysis of patients with severe thrombocytopenia. When MA was combined with ETP, bleeding was most effectively predicted in patients with severe thrombocytopenia. Therefore, comprehensive TEG and TGA assessment may be more predictive of bleeding risks than platelet counts alone. Our data suggest that the TEG and TGA may have additional benefits on the assessment of bleeding risk in patients with severe thrombocytopenia. A reduced ETP value of TGA in severe thrombocytopenia may provide a rationale for other therapeutic approaches, such as rFVIIa or coagulation factor replacement, in addition to platelet transfusion.
 XML Download