This article has been
cited by other articles in ScienceCentral.
Dear Editor,
Determination of the percentage of blasts in the bone marrow (BM) is one of the critical factors in diagnosing MDS. Flow cytometry (FCM) of BM cells has been introduced as an important co-criterion for diagnosing MDS [
123]. However, FCM has not been well accepted because of the lack of consensus of the criteria to define a phenotypic myeloblast and the appropriate denominator for calculation. Moreover, BM samples contain variable amounts of peripheral blood mixed with immature cells, thereby complicating interpretation. The present study was designed to choose reagent combinations to identify blasts by FCM in MDS patients, to determine which cell mass as the denominator in the process of counting the percentages of blasts, and to reveal whether the aspirates with high proportions of mature neutrophils should be normalized based on the proportion of dim CD16 maturing myeloid cells.
Sixty-nine patients with primary MDS were enrolled; BM samples were obtained from 20 control subjects without any known hematological disease and with normal blood cell counts. This study was approved by our institutional review board, and written informed consent was obtained from all subjects. Cell morphology was analyzed by conventional light microscopy, and the same BM samples were analyzed by FCM within 6 hr. The panel included four-color combinations of markers: HLA-DR-fluorescein isothiocyanate (FITC)/CD117-phycoerythrin (PE)/CD34-allophycocyanin (APC)/CD45-peridinin-chlorophyll protein (PerCP), CD16-FITC/CD13-PE/CD11bAPC/CD45-PerCP, anti-ckappa-FITC/anti-lambda-PE/CD138APC/CD45-PerCP, and IgG1-FITC/IgG1-PE/IgG1-APC/IgG1-PerCP. For each criterion, the percentage of blasts was calculated by using both the total number of nucleated BM cells (A) and the number of non-erythroid nucleated cells (N) as the denominator. For the A1 and N1 methods, blasts were defined as events showing a CD34hi and CD45lo/int phenotype. The A2 and N2 strategies identified CD34hi and/or CD117+ cells showing CD45lo/int expression as corresponding to blasts. For the A3 and N3 methods, blasts were defined as events showing a CD34hi and/or CD117+ HLA-DR+ and CD45lo/int phenotype. The ratio of the percentage of dim CD16 neutrophils to the average percent-age from BM biopsies (80%) was calculated as a dilution factor of excess mature segmented neutrophils in the sample. We used the following formula to normalize a BM aspirate to the levels expected for an “average” biopsy: 80%/(% dim CD16×blast count). After normalization, the A1, A2, and A3 strategies were converted to the CA1, CA2, and CA3 strategies, respectively. Similarly, the N1, N2, and N3 methods were converted to the CN1, CN2, and CN3 methods, respectively. Mean values and their SDs along with the median and range values were calculated for all data, and the Pearson correlation (r2) and Bland-Altman tests were used for analysis. The limits of agreement of the Bland-Altman test were set as the mean difference between the morphological and FCM blast counts±1.96 SD.
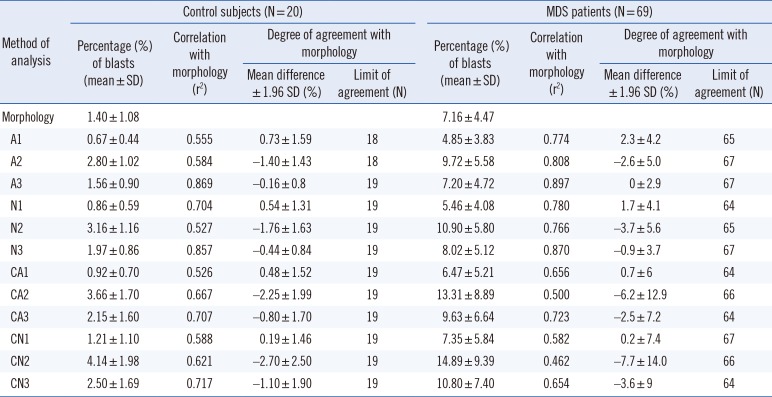
The A3 strategy showed the highest degree of correlation and agreement with morphological blasts counts (
P>0.05). The A1, N1, and CA1 strategies underestimated the numbers of blasts compared with morphological counts. The A2, N2, N3, CA2, CA3, CN2, and CN3 strategies overestimated blasts compared with morphological counts. The CN1 strategy underestimated the blasts in control subjects and overestimated the blasts in patients with MDS (
P<0.05) (
Table 1 and
Fig. 1).
The blasts counts were underestimated via a CD34
hi and CD45
lo/int phenotype strategy, suggesting that use of these markers alone will underestimate blast counts. Multiple experiments have shown that some blasts may not express CD34 [
45], and neoplastic cells may lack CD34 expression in MDS [
67]. The CD34
hi and/or CD117
+ and CD45
lo/int phenotype strategy overestimated blast numbers. CD117 is lost during early monocyte development and in the promyelocyte during neutrophil development. This antigen is expressed at high levels on mast cells and mast cell pre-cursors, and occasionally on other neoplastic cells. The present study revealed that ratio of CD34
hi and/or CD117
+HLA
-DR
+ cells to the number of total events showed the highest degree of correlation and agreement with morphological blast counts. This could reflect the fact that this criterion includes measurement of CD34
+ blasts, CD34
-CD117
+HLA
-DR
+ neutrophils, and erythroid-committed precursors as well as early CD117
loHLA-DR
hi monocytic and dendritic cell precursors [
8910]. After normalizing by dim CD16 neutrophils, the blast counts were found to be overestimated.
In conclusion, quantification of blasts by FCM based on the ratio of the CD34hi and/or CD117+HLA-DR+ phenotype to the number of total events showed the highest correlation with morphology.
Authors' Disclosures of Potential Conflicts of Interest
No potential conflicts of interest relevant to this article were reported.
References
1. Cazzola M, Della Porta MG, Travaglino E, Malcovati L. Classification and prognostic evaluation of myelodysplastic syndromes. Semin Oncol. 2011; 38:627–634. PMID:
21943669.
2. van de Loosdrecht AA, Westers TM. Cutting edge: flow cytometry in myelodysplastic syndromes. J Natl Compr Canc Netw. 2013; 11:892–902. PMID:
23847222.
3. Porwit A, van de Loosdrecht AA, Bettelheim P, Brodersen LE, Burbury K, Cremers E, et al. Revisiting guidelines for integration of flow cytometry results in the WHO classification of myelodysplastic syndromes-proposal from the International/European LeukemiaNet Working Group for Flow Cytometry in MDS. Leukemia. 2014; 28:1793–1798. PMID:
24919805.
4. van Lochem EG, van der Velden VH, Wind HK, te Marvelde JG, Westerdaal NA, van Dongen JJ. Immunophenotypic differentiation patterns of normal hematopoiesis in human bone marrow: reference patterns for age-related changes and disease-induced shifts. Cytometry B Clin Cytom. 2004; 60:1–13. PMID:
15221864.
5. Stetler-Stevenson M, Arthur DC, Jabbour N, Xie XY, Molldrem J, Barrett AJ, et al. Diagnostic utility of flow cytometric immunophenotyping in myelodysplastic syndrome. Blood. 2001; 98:979–987. PMID:
11493442.
6. Pirruccello SJ, Young KH, Aoun P. Myeloblast phenotypic changes in myelodysplasia. CD34 and CD117 expression abnormalities are common. Am J Clin Pathol. 2006; 125:884–894. PMID:
16690488.
7. Bellos F, Kern W. Flow cytometry in the diagnosis of myelodysplastic syndromes and the value of myeloid nuclear differentiation antigen. Cytometry B Clin Cytom. 2017; 92:200–206. PMID:
26184452.
8. Matarraz S, López A, Barrena S, Fernandez C, Jensen E, Flores J, et al. The immunophenotype of different immature, myeloid and B-cell lineage-committed CD34+ hematopoietic cells allows discrimination between normal/reactive and myelodysplastic syndrome precursors. Leukemia. 2008; 22:1175–1183. PMID:
18337765.
9. Orfao A, Ortuño F, de Santiago M, Lopez A, San Miguel J. Immunophenotyping of acute leukemias and myelodysplastic syndromes. Cytometry A. 2004; 58:62–71. PMID:
14994223.
10. Matarraz S, López A, Barrena S, Fernandez C, Jensen E, Flores-Montero J, et al. Bone marrow cells from myelodysplastic syndromes show altered immunophenotypic profiles that may contribute to the diagnosis and prognostic stratification of the disease: a pilot study on a series of 56 patients. Cytometry B Clin Cytom. 2010; 78:154–168. PMID:
20198685.
Fig. 1
Degree of agreement between bone marrow blast counts by flow cytometry and conventional morphology in MDS. The abscissae represent the mean percentage of bone marrow blasts obtained by morphology and flow cytometry for each patient, and the ordinates represent the difference in the percentages of bone marrow blasts obtained by morphology and flow cytometry for each patient. Panels A, B, and C show flow cytometry counts obtained with strategies A1, A2, and A3, respectively, and panels D, E, and F show flow cytometry blast percentages with the N1, N2, and N3 strategies, respectively. Panels G, H, and I show flow cytometry counts obtained with strategies CA1, CA2, and CA3, respectively, and panels J, K, and L show the CN1, CN2, and CN3 strategies, respectively. The percentages in the Bland-Altman plots indicate the number of cases within the 95% limits of agreement.
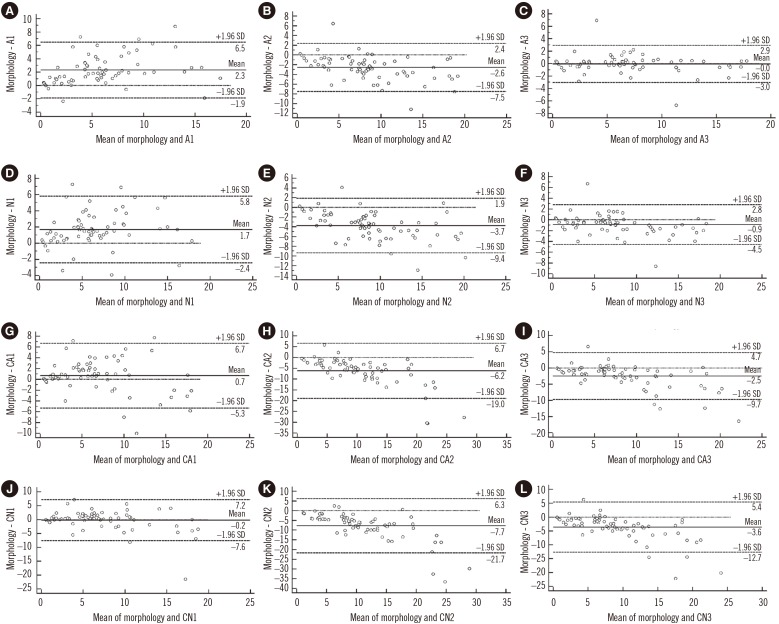
Table 1
Correlation between the percentages of blasts in the bone marrow obtained by flow cytometry and morphology.
|
Method of analysis |
Control subjects (N=20) |
MDS patients (N=69) |
|
Percentage (%) of blasts (mean±SD) |
Correlation with morphology (r2) |
Degree of agreement with morphology |
Percentage (%) of blasts (mean±SD) |
Correlation with morphology (r2) |
Degree of agreement with morphology |
|
Mean difference ±1.96 SD (%) |
Limit of agreement (N) |
Mean difference ±1.96 SD (%) |
Limit of agreement (N) |
|
Morphology |
1.40 ± 1.08 |
|
|
|
7.16 ± 4.47 |
|
|
|
|
A1 |
0.67 ± 0.44 |
0.555 |
0.73 ± 1.59 |
18 |
4.85 ± 3.83 |
0.774 |
2.3 ± 4.2 |
65 |
|
A2 |
2.80 ± 1.02 |
0.584 |
−1.40 ± 1.43 |
18 |
9.72 ± 5.58 |
0.808 |
−2.6 ± 5.0 |
67 |
|
A3 |
1.56 ± 0.90 |
0.869 |
−0.16 ± 0.8 |
19 |
7.20 ± 4.72 |
0.897 |
0 ± 2.9 |
67 |
|
N1 |
0.86 ± 0.59 |
0.704 |
0.54 ± 1.31 |
19 |
5.46 ± 4.08 |
0.780 |
1.7 ± 4.1 |
64 |
|
N2 |
3.16 ± 1.16 |
0.527 |
−1.76 ± 1.63 |
19 |
10.90 ± 5.80 |
0.766 |
−3.7 ± 5.6 |
65 |
|
N3 |
1.97 ± 0.86 |
0.857 |
−0.44 ± 0.84 |
19 |
8.02 ± 5.12 |
0.870 |
−0.9 ± 3.7 |
67 |
|
CA1 |
0.92 ± 0.70 |
0.526 |
0.48 ± 1.52 |
19 |
6.47 ± 5.21 |
0.656 |
0.7 ± 6 |
64 |
|
CA2 |
3.66 ± 1.70 |
0.667 |
−2.25 ± 1.99 |
19 |
13.31 ± 8.89 |
0.500 |
−6.2 ± 12.9 |
66 |
|
CA3 |
2.15 ± 1.60 |
0.707 |
−0.80 ± 1.70 |
19 |
9.63 ± 6.64 |
0.723 |
−2.5 ± 7.2 |
64 |
|
CN1 |
1.21 ± 1.10 |
0.588 |
0.19 ± 1.46 |
19 |
7.35 ± 5.84 |
0.582 |
0.2 ± 7.4 |
67 |
|
CN2 |
4.14 ± 1.98 |
0.621 |
−2.70 ± 2.50 |
19 |
14.89 ± 9.39 |
0.462 |
−7.7 ± 14.0 |
66 |
|
CN3 |
2.50 ± 1.69 |
0.717 |
−1.10 ± 1.90 |
19 |
10.80 ± 7.40 |
0.654 |
−3.6 ± 9 |
64 |


 PDF
PDF ePub
ePub Citation
 Print
Print


 XML Download