

 PDF
PDF ePub
ePub Citation
 Print
Print


INTRODUCTION
Cervical cancer is the fourth most common malignancy and the leading cause of cancer-related death among women worldwide [1]. In Korea, cervical cancer is the third and seventh most common malignancy among women aged 15–34 and 35–64 yr, respectively [2]. Persistent infection with high-risk (HR) human papillomavirus (HPV) is known to cause invasive cervical cancer and its precursor lesions [3]. Although cervical cancer cytology screening has played a vital role in reducing the incidence and mortality due to cervical cancer, cervical cytology has limitations in terms of both sensitivity and reliability. In order to overcome these obstacles, HPV testing has been recommended in combination with cervical cytology for the prevention and early detection of cervical cancer [4].
There are more than 150 HPV genotypes in humans, some of which are known to be carcinogenic [5]. The prevalence and genotype distribution of HPV infection vary across geographical regions and according to the immunity provided by vaccines; the most commonly reported HPV types among women with normal cytology findings are HPV 16 in North America and Europe and HPV 52 in Japan and Taiwan [6]. However, the most commonly reported type may vary within the same country; HPV 16, 58, and 70 have all been reported to be the most frequent type among Korean women [789]. A previous meta-analysis [8] covering the period of 1995–2007 (prior to the introduction of HPV vaccinations and the standardization of HPV detection methods) and including studies investigating various HPV types found no multiple infection cases involving more than two types of HPV. Other studies have focused on women living in localized or restricted areas, and hence are unlikely to be representative of all Korean women [89]. The effect of HPV on the development of premalignant lesions and invasive cervical cancer differs with HPV genotype. Moreover, HPV genotype prevalence and distribution according to cervical lesion exhibit geographical variation.
Based on the above-mentioned observations, the present study was performed to identify the recent prevalence and genotype distribution of HPV according to age and cervical cytology findings throughout Korea. Multiplex PCR was used for HPV genotyping in this study.
METHODS
1. Study subjects
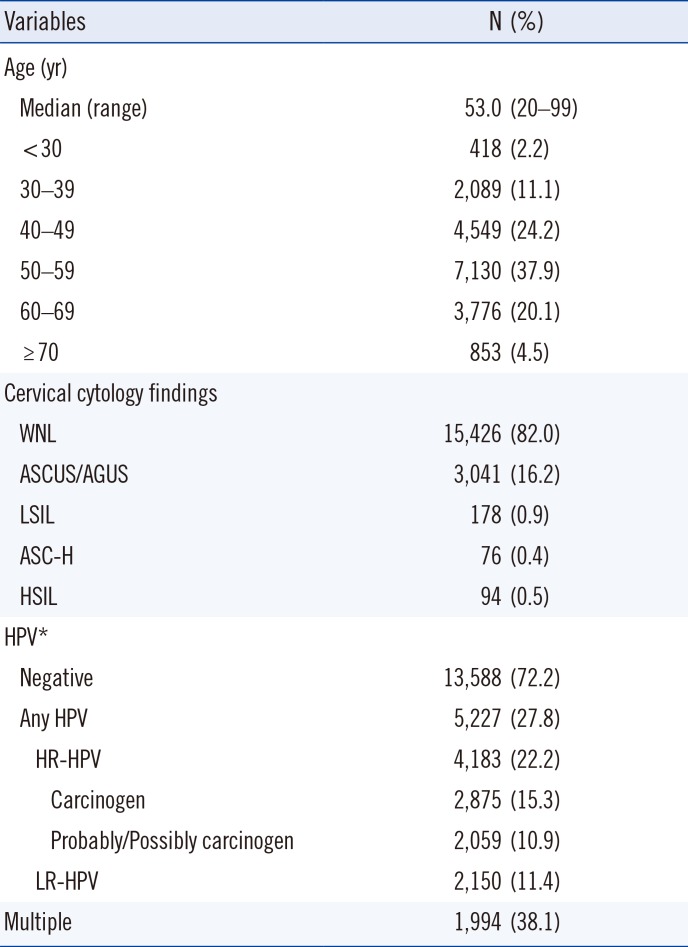
A retrospective cross-sectional study was conducted with 18,815 health examinees undergoing both cervical cytology testing and HPV genotyping as a part of a cervical cancer screen at 16 Health Promotion Centers in 13 Korean cities between January 2014 and October 2015: 5,914 in Seoul, 2,698 in Daegu, 2,179 in Busan, 1,698 in Woolsan, 1,465 in Changwon, 889 in Incheon, 877 in Jeonju, 746 in Gwangju, 691 in Daejeon, 665 in Suwon, 287 in Chuncheon, 212 in Chungju, and 494 in Jeju. A total 18,815 women with a median age of 53 yr (range 20–99 yr) were enrolled in the study. The diagnosis of cervical specimen cytology was classified based on the Bethesda System [10] as follows: negative for malignancy, atypical squamous cells of undetermined significance (ASCUS), atypical glandular cells of undetermined significance (AGUS), low-grade squamous intraepithelial lesion (LSIL), high-grade squamous intraepithelial lesion (HSIL), atypical squamous cells without excluding HSIL (ASC-H), squamous cell carcinoma (SCC), or adenocarcinoma (AC). The following cytology results were obtained: 15,426 (82.0%) normal, 3,041 (16.2%) ASCUS/AGUS, 178 (0.9%) LSIL, 76 (0.4%) ASC-H, 92 (0.5%) HSIL, and 2 (0.01%) cancers. This study was approved by the Institutional Review Board of Korea Association of Health Promotion (130750-201603-HR-018).
2. DNA extraction and HPV genotyping
Cervical cells were collected in liquid from cervical cytology specimens or cervical swab specimens and transported in eNAT medium (Seegene, Seoul, Korea) according to the manufacturer's instructions. DNA was extracted from 400 µL of specimen by using the MICROLAB STARlet system (Hamilton, Reno, NV, USA). HPV was genotyped as recommended by the manufacturer's instructions by using the Anyplex II HPV 28 (Seegene) and a CFX96 real-time thermocycler (Bio-Rad, Hercules, CA, USA). Briefly, 5 µL DNA in 20 µL reaction mixture was amplified with either primer set A or B. Anyplex II HPV 28 uses HPV-specific dual priming oligonucleotides (DPO) and tagging oligonucleotide cleavage and extension (TOCE) technologies for multiplex real-time PCR. Real-time PCR reactions were performed in two wells with primer set A, which identifies 14 HR-HPVs, and primer set B that identifies five HR and nine low-risk (LR) HPVs. The L1 gene of HPV and human beta-globin were simultaneously co-amplified as an internal control to monitor the DNA purification efficacy. Twenty-eight HPV genotypes were analyzed based on the WHO HPV categorizations [1112]: HR-HPV (group 1 carcinogens such as HPV 16, 18, 31, 33, 35, 39, 45, 51, 52, 56, 58, and 59; group 2A probable carcinogens such as 68; and group 2B possible carcinogens such as HPV-66, 26, 53, 69, 70, 73, and 82) and group 3 LR-HPVs such as HPV-6, 11, 40, 42, 43, 44, 54, and 61.
RESULTS
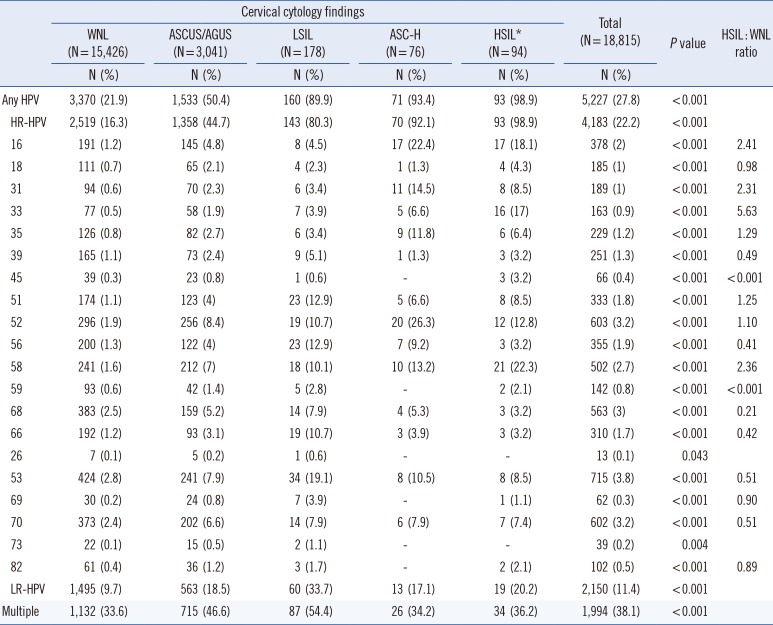
HPV infection was present in 5,227 (27.8%) of the 18,815 women, which included 4,183 (22.2%) with HR-HPV. Multiple infections were present in 1,994 (38.1%) of the 5,227 HPV-positive cases (Table 1). There was a difference in HPV prevalence across the cities. The prevalence of HR-HPV ranged from 15.8% (in Incheon) to 31.0% (in Chuncheon) (data not shown). Analysis of the two cases with cytology diagnosis of cervical cancer revealed that one was SCC and the other was AC. HPV 58 was detected in the SCC, and HPV 45 and 42 were detected in the AC (data are not shown). The two cases with cervical cancer were included in the HSIL group for analysis.
1. Prevalence of HPV types
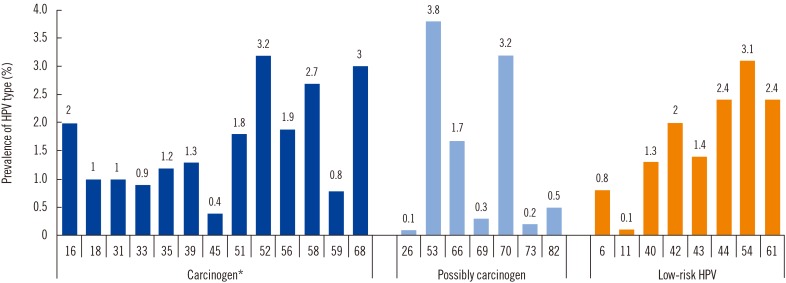
Of the carcinogen types, HPV 52 (3.2%) was the most common, followed by HPV 58 (2.7%), 16 (2.0%), 56 (1.9%), and 51 (1.8%). Of the LR-HPVs, HPV 54 (3.1%) was the most common, followed by HPV 44, 61, 42, and 43 (Fig. 1).
2. Age-specific prevalence of HPV infection and genotype distribution
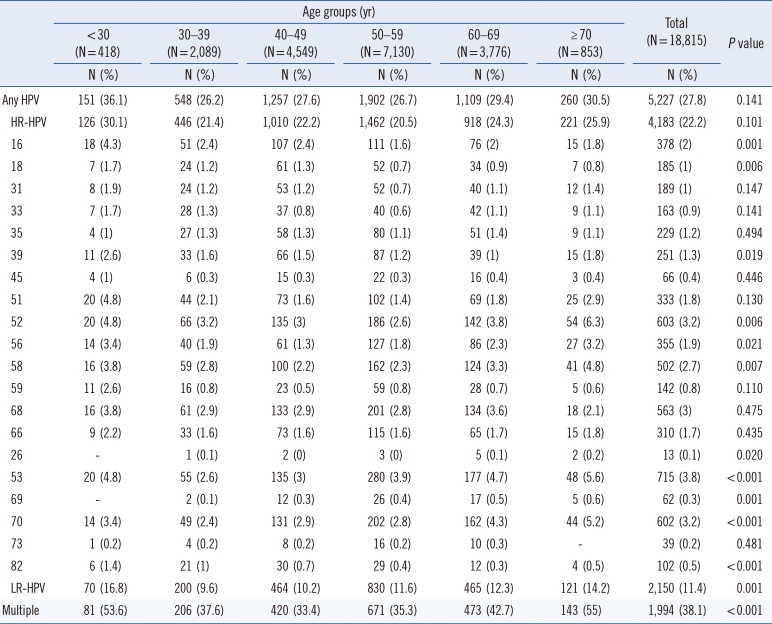
The overall prevalence of HPV infection ranged from 26.2% (in those aged 30–39 yr) to 36.1% (in those aged <30 yr), while the prevalence of HR-HPV infection ranged from 20.5% (in those aged 50–59 yr) to 30.1% (in those aged <30 yr). In terms of the age-specific trends of individual HR-HPV types, the prevalence of HPV 16, 18, 39, 52, 56, 58, 70, and 82 HR-HPV infected individuals decreased significantly with increasing age and then increased again from age 50–60 (P for trend <0.05). In contrast, the prevalence of HPV 69 increased significantly with age (P for trend <0.001). The prevalence of multiple infections was higher in those aged <30 yr (53.6%) and ≥70 yr (55.0%) than in the other age groups (Table 2).
3. Prevalence and genotype distribution of HPV according to cervical cytology findings
The prevalence of HPV and HR-HPV infections were 21.9% and 16.3% respectively, in normal cervical cytology findings. The overall prevalence of HPV and HR-HPV infections increased with the severity of the cervical cytology findings (P for trend <0.001). In the ASC-H/HSIL group, the five most common HR-HPV types were HPV 16 (20.0%), 52 (18.8%), 58 (18.2%), 33 (12.4%), and 31 (11.2%), which constituted 84.0% of all HR-HPV infections (Table 3).
4. Age-specific prevalence of HR-HPV infection in different cervical cytology groups
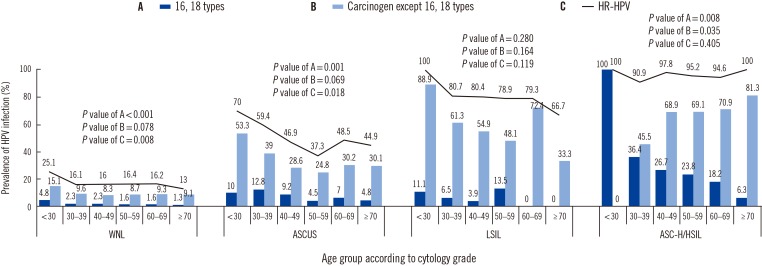
The prevalence of age-specific HR-HPV infection varied with the cervical cytology findings. The prevalence of HR-HPV decreased significantly with increasing age in women with normal cytology findings (P=0.008). In those with ASCUS, the prevalence of HR-HPV infection peaked in women aged<30 yr, decreased to a minimum at age 50–59 yr, and then increased in older women (P<0.05). In those with ASC-H/HSIL, the prevalence of HR-HPV ranged from 90.9% at age 30–39 yr to 100.0% at ages <30 or ≥70 yr. The prevalence of carcinogens, except for HPV 16 and HPV 18, increased significantly with increasing age (P=0.035). Regardless of cytology grade, the prevalence of HPV 16 and/or 18 decreased significantly with increasing age (P<0.005) (Fig. 2).
DISCUSSION
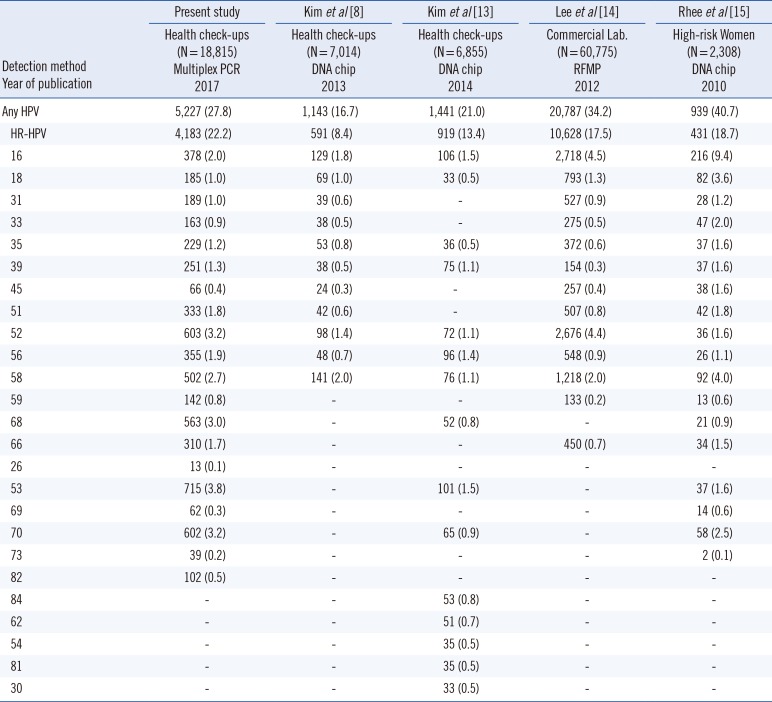
Previous Korean studies found that the overall prevalence of HPV infection varied from 16.7% to 40.7% depending on the detection method, the number of individuals studied, and the types of HPV investigated; HPV 16 was identified as the first or second most common carcinogen (Table 4) [8131415]. However, the present study found that the most common carcinogen was HPV 52 and that HPV 16 was only the third most common carcinogen. This discrepancy might be due to the period of investigation (from January 2014 to October 2015) covered in this study. The wider availability of the quadrivalent HPV vaccine against HPV 16, 18, 6, and 11 (introduced in 2007) and the bivalent HPV vaccine against HPV 16 and 18 (introduced in 2008) might have reduced the prevalence of HPV 16; this hypothesis is supported by previous reports demonstrating that the prevalence of HPV 16 and 18 was reduced following the introduction of HPV vaccines [161718].
This study also investigated the prevalence and distribution of HPV according to cervical cytology groups. The prevalence of HR-HPV in normal cytology cases (16.3%) was slightly higher than those reported in previous studies performed in France (13.7%) [19] and the UK (12.2%) [20]. In addition, the present study found that the five most common HR-HPVs in normal cytology findings were HPV 53, 68, 70, 52, and 58. This contradicts a meta-analysis reporting that HPV 16 was the most common HPV type in all analyzed regions and that the next most common types differed by region: HPV 52, 58, and 18 in Asia; HPV 52 and 18 in Africa; and HPV 53, 52, and 18 in North America [21]. Variation was detected even in previous Korean studies. In a Korean study performed from December 2008 to October 2010, the most common type in normal cytology samples was HPV 58, followed by HPV 16, 52, 18, and 35 [8]; while Shin et al [9] reported that the most frequent types in Korean women were HPV 70, 16, and 33. The subjects of this study consisted of the health examinees from 16 Health Promotion Centers in 13 cities across Korea, which routinely perform National Health Insurance Service (NHIS) health check-ups. This screening population was expected to represent the general population of Korean women, not a specific class or a certain area.
A meta-analysis found that the most common type in HSIL across five continents was HPV 16, whereas the second and third common types differed with regions: HPV 31 and 33 in Africa and Europe, HPV 58 and 18 in Latin America and the Caribbean, HPV 6 and 18 in North America, and HPV 58 and 52 in Asia [21]. A meta-analysis on Korean women found that HPV 16 was predominant regardless of cervical lesion type and that HPV 58, 18, 52, and 33 were prevalent in high-grade lesions [7]; these findings are consistent with the present results except for the finding that HPV 18 was not prevalent in HSIL. Because precancerous lesions, such as HSIL, have a high risk of developing into cancer, HPV 16, 52, 58, and 33, which were prevalent in the HSIL group, are of concern. In particular, HPV 52 and 58 need to be targeted by prophylactic HPV vaccination in Korea, because protection against HPV 33 is already provided by cross-protection from the bivalent vaccine against HPV 16 and 18 [2223].
Prevalence declines in middle age groups, with a second increase in women with normal cytology findings aged 35–44 or 45–54 yr in Central/South America and North America, and Europe, respectively. However, this second increase is less clear in Asian women [24]. A hook-shaped association was observed for ASCUS in the present study. This second peak in older women could be due to new HPV infection caused by changes in sexual behavior after middle age and/or the cumulative number of sexual partners [25], reactivation of latent infection following immune senescence [26], and/or a cohort effect translating lifetime high exposure to older women [27]. We could not identify a contribution due to changes in sexual behavior with this second increase among older women because we did not interview the women about their sexual behavior. An increase in LR-HPV has also been suggested as a cause of the second increase [21]; a second increase in LR-HPV among older women was also detected in the present study.
This study has some limitations. First, it had a cross-sectional design and did not confirm the presence of cervical lesions histologically. The contribution of each HR-HPV to the development of precancerous lesions or cancer needs to be clarified in a future study. Second, the exact impact of vaccination on the HPV distribution could not be evaluated in this study because the HPV vaccination history of the subjects was not obtained. Therefore, a future study using follow-up data from the National Immunization Program (NIP) pertaining to HPV in 12-yr old subjects (which began in 2016), is being planned. Third, the prevalence of ASC-H/HSIL and cancer was very low in those aged <30 yr, which resulted in the prevalence of HPV 16 being 100% (i.e., in one individual) in ASC-H/HSIL. Fourth, the interpretation of group 2B as HR-HPVs needs to be taken into careful consideration.
In conclusion, this study has elucidated nationwide HPV type-specific prevalence among Korean women, which varied according to cervical cytology findings and age. This information is expected to be helpful for developing follow-up guidelines for HR-HPV-positive subjects, prevention policies for cervical cancer, and the NIP for HPV in Korea.
 XML Download