Journal List > Ann Lab Med > v.37(5) > 1091531

Kim, Hur, Lee, Marino, Magrini, Cardelli, Struck, Bergmann, Hartmann, Di Somma, and GREAT Network: Proenkephalin, Neutrophil Gelatinase-Associated Lipocalin, and Estimated Glomerular Filtration Rates in Patients With Sepsis

Abstract

Background

Proenkephalin (PENK) has been suggested as a novel biomarker for kidney function. We investigated the diagnostic and prognostic utility of plasma PENK in comparison with neutrophil gelatinase-associated lipocalin (NGAL) and estimated glomerular filtration rates (eGFR) in septic patients.

Methods

A total of 167 septic patients were enrolled: 99 with sepsis, 37 with septic shock, and 31 with suspected sepsis. PENK and NGAL concentrations were measured and GFR was estimated by using the isotope dilution mass spectrometry traceable-Modification of Diet in Renal Disease (MDRD) Study and three Chronic Kidney Disease Epidemiology Collaboration (CKD-EPI) equations: CKD-EPICr, CDK-EPICysC, and CKD-EPICr-CysC. The PENK, NGAL, and eGFR results were compared according to sepsis severity, presence or absence of acute kidney injury (AKI), and clinical outcomes.

Results

The PENK, NGAL, and eGFR results were significantly associated with sepsis severity and differed significantly between patients with and without AKI only in the sepsis group (all P<0.05). PENK was superior to NGAL in predicting AKI (P=0.022) and renal replacement therapy (RRT) (P=0.0085). Regardless of the variable GFR category by the different eGFR equations, PENK showed constant and significant associations with all eGFR equations. Unlike NGAL, PENK was not influenced by inflammation and predicted the 30-day mortality.

Conclusions

PENK is a highly sensitive and objective biomarker of AKI and RRT and is useful for prognosis prediction in septic patients. With its diagnostic robustness and predictive power for survival, PENK constitutes a promising biomarker in critical care settings including sepsis.

INTRODUCTION

Sepsis is defined as life-threatening organ dysfunction caused by a dysregulated host response to infection. Even a modest degree of organ dysfunction may lead to the further deterioration of septic patients and an overall mortality of approximately 10%; thus, early recognition merits a prompt and appropriate intervention [1]. Acute kidney injury (AKI) is common in critically ill patients and is a potentially life-threatening factor associated with significant morbidity and mortality [23]. Sepsis is the most common precipitating factor in the development of AKI, and sepsis-associated AKI (SA-AKI) is often more acute and severe compared with AKI without sepsis, posing significant clinical challenges [45].
A decrease in urine output and an increase in serum creatinine (Cr) have been used as surrogate markers for decreased glomerular filtration rate (GFR), which defines AKI [6]. However, because of the limitations of these classical parameters in assessing acute kidney attack or damage, new renal biomarkers have been explored. Neutrophil gelatinase-associated lipocalin (NGAL) has been identified as a good predictor of AKI as well as an efficient test for predicting clinical outcome in critically ill patients [78].
Several equations, such as the Isotope Dilution Mass Spectrometry (IDMS) Traceable-Modification of Diet in Renal Disease (MDRD) Study equation [9] and the Chronic Kidney Disease Epidemiology Collaboration (CKD-EPI) equations using serum Cr, serum cystatin C (CysC), or both with demographic variables, have been used to estimate GFR [1011]. However, these equations for estimated GFR (eGFR) were developed for stable patients with chronic renal insufficiency and are not valid for critically ill patients [612].
Enkephalins, encoded by the proenkephalin gene (PENK) on chromosome 8, are endogenous opioids involved in various physiological processes and influence kidney function. Proenkephalin (PENK; amino acids 119–159 of proenkephalin A), a stable surrogate marker for endogenous enkephalins, has been suggested as a novel biomarker for AKI in perioperative and critical settings [131415]. In this study, we investigated the clinical utility of PENK in comparison with NGAL in terms of AKI detection and prognosis prediction in septic patients. In addition, we compared the levels of these two kidney biomarkers using four different eGFR equations (MDRD Study and three CKD-EPI equations) to explore how the equations vary across AKI and sepsis severity. This comparison highlights the necessity or stability of biomarkers in contrast to the unreliability of eGFR in critically ill patients.

METHODS

1. Study population

A total of 374 patients were under clinical suspicion of sepsis from December 2014 to June 2015; of these, 248 patients were diagnosed as having sepsis according to the diagnostic criteria of Surviving Sepsis Campaign 2012 [16]. Except for 81 patients without available samples, a total of 167 patients were enrolled in this study. Because the definition of sepsis and septic shock was revised in early 2016, the 167 enrolled patients were re-categorized according to the new definition [1]; 99 patients (59.2%) were diagnosed as having sepsis, 37 patients (22.2%) as having septic shock, and 31 patients (18.6%), who could not be included in the sepsis group according to the new definition, were arbitrarily grouped as suspected sepsis. This sample size was thought to have approximately 90% power to detect a difference in independent variables between the three sepsis grade groups with a 0.05 two-sided significant level. The patients' medical records were reviewed for clinical and demographic data and their basic characteristics are presented in Table 1.
Presence of AKI was defined by using the Kidney Disease Improving Global Outcomes (KDIGO) diagnostic criteria [17]. PENK, NGAL, serum Cr, and CysC concentrations were measured at the time of patient enrollment; the serum Cr delta value was assessed on the basis of the concentrations 48 hr post enrollment for AKI diagnosis.
This study was performed in accordance with the Declaration of Helsinki, and the study protocol was reviewed and approved as exempt by the Institution Review Board (KUH1200051) of Konkuk University Medical Center, Seoul, Korea. The medical records were reviewed without any identifiable information, and this study did not require additional blood sampling or intervention. The biomarkers were measured by using remnant blood samples that would have been discarded following routine use.
For each patient, available EDTA plasma and serum samples were collected on the same day as sepsis diagnosis, divided into small aliquots to avoid repeated freezing and thawing, and immediately stored at -70℃ until use. Frozen samples were thawed at room temperature and gently mixed just prior to biomarker measurement.

2. Measurement of PENK and NGAL

1) PENK assay

Plasma PENK was measured by using the sphingotest penKid assay (Sphingotec GmbH, Hennigsdorf, Germany), an immunoassay with monoclonal antibodies specific to the PENK peptide (amino acids 119–159 of PENK A). Standards (PENK peptide) and samples (100 µL) were incubated in tubes with the detector antibody (150 µL), the tubes were washed, and bound chemiluminescence was detected with a LB952T/16 luminometer (Berthold, Bad Wildbad, Germany). The lower limit of detection was 5.5 pmol/L, the measurement range was 6.4–2,000.0 pmol/L, and the mean within-laboratory imprecision was <9.5% during the study period. The 99th percentile of the normal distribution was 80 pmol/L, as recently described in the Malmö Diet and Cancer Study (n=4,643) [18], and was considered as a reference limit.

2) NGAL assay

Plasma NGAL was measured by using the Triage NGAL Assay (Alere, Inc., San Diego, CA, USA), according to the manufacturer's instructions. Briefly, several drops of EDTA plasma sample were added to the sample port on the device; the sample then reacts with fluorescent antibody conjugates and the complexes are captured on a discrete zone specific for NGAL. The device displays the concentration of plasma NGAL approximately 15 min later with a measurable range of 15–1,300 ng/mL. The mean within-laboratory imprecision was 2.8% during the study period. Medical decision point of plasma NGAL was set at 150 ng/mL [7].

3. Estimation of GFR

Serum Cr was measured by using the Toshiba 200-FR analyzer (Toshiba Medical Systems, Tokyo, Japan) with the Roche calibrator and reagent (Roche Diagnostics, Indianapolis, IN, USA), which is traceable with the IDMS reference method. The dynamic measuring range was 0.2–25 mg/dL, and the mean within-laboratory imprecision was 1.35% during the study period. CysC was determined with the Roche Cobas 8000 modular system using Roche Tina-quant Cystatin C Gen 2, a particle enhanced immunonephelometric assay. The measurement range was 0.4–8.0 mg/L, and the mean within-laboratory imprecision was 2.7% during the study period. eGFRs were calculated by using the MDRD Study equation and CKD-EPI equations using Cr, CysC, or Cr-CysC as variables with demographic variables [91011]. To assess eGFR, rather than using arbitrary categories, we adopted six eGFR categories according to the KDIGO guidelines: ≥90 mL/min/1.73 m2; 60–89 mL/min/1.73 m2; 45–59 mL/min/1.73 m2; 30–44 mL/min/1.73 m2; 15–29 mL/min/1.73 m2; <15 mL/min/1.73 m2 [19]. GFR ≥60 mL/min/1.73 m2 was considered normal.

4. Statistical analysis

Data were checked for normal distribution by using the Shapiro-Wilk test and expressed as median and interquartile range or number and percentage. Groups were compared by using the Mann-Whitney U test or the Kruskal-Wallis test with post-hoc multiple comparisons. ROC curves and the area under the curves (AUC) were used to illustrate various cut-off levels with their sensitivity and specificity. AUCs were reported with a 95% confidence interval (CI) and assessed as follows: 0.5–0.6, fail; 0.6–0.7, poor; 0.7–0.8, fair; 0.8–0.9, good; 0.9–1.0, excellent [20]. Nested logistic regression models or ROC curves were used to compare variables for the prediction of AKI or renal replacement therapy (RRT). Agreement between the categorized groups was assessed by using the inter-rater agreement statistic (Kappa value): 0, absence of agreement; 0.1–0.2, none to slight; 0.21–0.40, fair; 0.41–0.60, moderate; 0.61–0.80, substantial; 0.81–1.00, almost perfect agreement [21]. Kaplan-Meier survival curves were used to analyze the prognostic value of biomarkers and eGFRs, and 30-day mortality was compared between favorable and unfavorable groups using the hazard ratio (HR, with 95% CI). SPSS software (version 22.0, SPSS Inc., Chicago, IL, USA) and MedCalc Software (version 15.8, MedCalc Software, Mariakerke, Belgium) were used for statistical analyses. P values<0.05 were considered statistically significant.

RESULTS

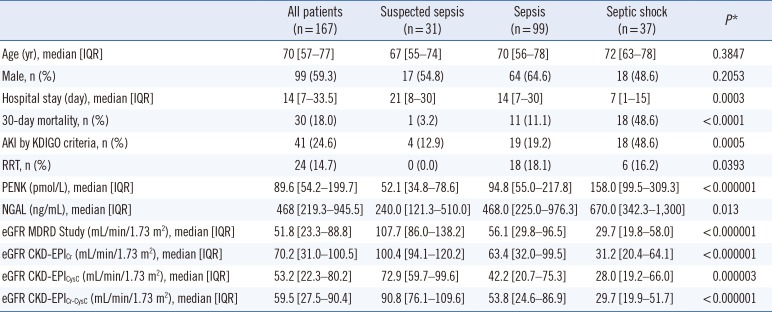
Table 1 shows the comparison of PENK, NGAL, and eGFRs according to sepsis severity. PENK and NGAL concentrations differed significantly according to sepsis severity (P<0.0001 and P=0.013, respectively). eGFRs based on the MDRD Study and three CKD-EPI equations decreased significantly according to sepsis severity (all P<0.0001).
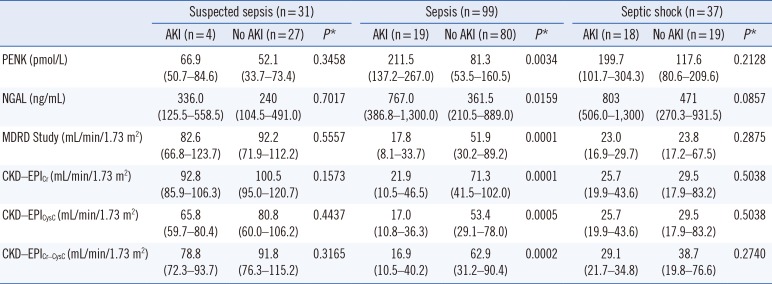
AKI occurred in 12.9% (4/31) of patients with suspected-sepsis, 19.2% (19/99) of patients with sepsis, and 48.6% (18/37) of patients with septic shock (Table 2). The PENK and NGAL biomarkers and four eGFR equations differed significantly between patients with and without AKI at the stage of sepsis. Of note, in the sepsis stage, PENK concentration did not increase without AKI, while NGAL concentration increased substantially compared with the clinical cut-off value even without AKI (81.3 pmol/L vs 361.5 ng/mL). Of the eGFR equations, only CKD-EPICr and CKD-EPICr-CysC indicated normal kidney function (GFR≥60 mL/min/1.73 m2) in septic patients without AKI.
ROC curves were compared for AKI diagnosis in all 167 patients (Fig. 1). PENK (AUC, 0.725) and the four eGFR equations (AUC, 0.757, 0.761, 0.712, and 0.743, respectively) showed fair discriminatory ability, but NGAL demonstrated poor discriminatory ability (AUC, 0.675). However, PENK, NGAL, and the four eGFR equations were all comparable, showing no statistical difference. A more refined analysis based on nested logistic regression models showed that PENK was superior to NGAL (P= 0.022), but inferior to the eGFR equations based on MDRD, Cr, and Cr-CysC (P<0.05). PENK exhibited no statistical superiority over eGFR based on CysC (P=0.473). NGAL was inferior to all eGFR equations (all P<0.05). The optimal cut-off value for AKI diagnosis was 154.5 pmol/L for PENK and 493 ng/mL for NGAL and ranged from 28.3 to 36.4 mL/min/1.73 m2 for the eGFR equations. With regard to RRT, both PENK and NGAL concentrations were significantly higher in patients with RRT than in patients without RRT (PENK, 421.9 vs 82.5 pmol/L, P<0.0001; NGAL, 1,270.0 vs 375.0 ng/mL, P=0.0001). Based on ROC curve analysis, PENK showed good performance and NGAL showed fair performance to predict RRT (AUC, 0.872 vs 0.741, P=0.0085).
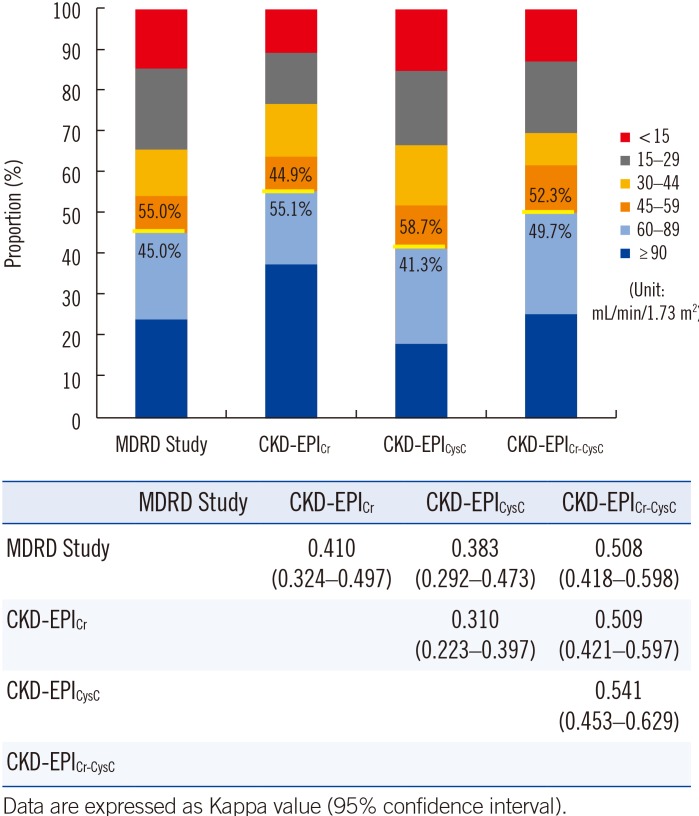
The distribution of GFR categories varied across each eGFR equation (Fig. 2). The proportion of reduced GFR (<60 mL/min/1.73 m2) was the highest based on the CKD-EPICysC equation and the lowest based on the CKD-EPICr equation, showing a significant difference (58.7% vs 44.9%, P<0.0001, Chi-square test). Of note, each pair of eGFR equations showed minimal to weak agreement to define reduced GFR.
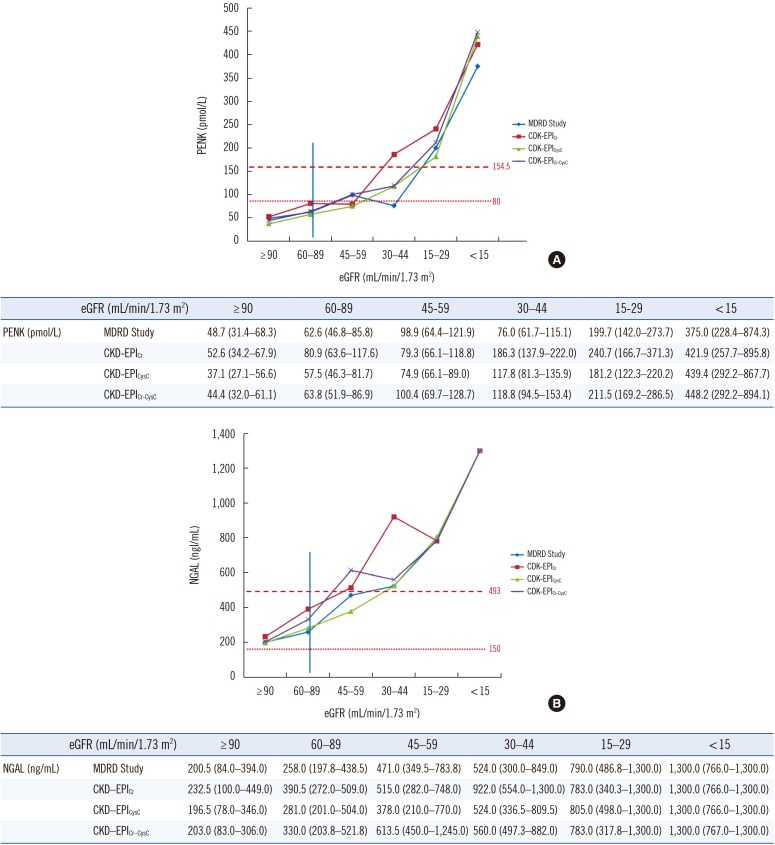
The distribution of PENK and NGAL concentrations differed significantly according to GFR category (all P<0.0001) (Fig. 3). Both PENK and NGAL concentrations increased significantly according to GFR category based on the MDRD Study and CKD-EPI equations (P<0.0001). In normal GFR (≥60 mL/min/1.73 m2) categories, PENK concentration was below the 154.5 pmol/L cut-off obtained by ROC curve analysis and was also lower than or similar to the 99th percentile of the normal range (80 pmol/L). NGAL concentration was also below the 493 ng/mL cut-off obtained by ROC curve analysis; however, it was higher than the literature- and manufacturer-recommended 150 ng/mL cut-off.
In terms of 30-day mortality, except for NGAL, PENK concentration and eGFRs showed significant differences between survivors and non-survivors based on all four equations (all P<0.005) (Table 3). Based on survival analysis using two different cut-offs (optimal ROC curve analysis cut-off and literature- and/or manufacturer-recommended cut-off), PENK and the eGFR equations all showed significant differences between the two groups (favorable vs unfavorable). However, no significant difference was observed for NGAL, regardless of cut-off. PENK showed the highest HR with the 80 pmol/L cut-off value (HR=7.9, P<0.0001).

DISCUSSION

In this study, PENK concentration, NGAL concentration, and eGFRs all showed significant differences according to sepsis severity (Table 1). Both PENK and NGAL concentrations increased significantly, while all eGFRs decreased significantly according to sepsis severity. Based on ROC curve analysis, PENK and the four eGFR equations showed fair discriminatory ability, while NGAL showed poor performance for AKI diagnosis (Fig. 1). In the nested logistic regression models, PENK was superior to NGAL (P=0.022), but inferior to the eGFR equations based on MDRD Study, Cr, and Cr-CysC (P<0.05). PENK did not display statistical superiority over eGFR based on CysC (P=0.473). NGAL was inferior to all eGFR equations (all P<0.05). Of note, both PENK and NGAL concentrations were significantly different between the two groups of RRT, and PENK predicted RRT better than NGAL (P=0.0085). These results indicate that the performance of tested AKI biomarkers is not distinctly better than that of eGFR; however, PENK might predict the need for RRT more accurately.
According to our data, each pair of the four eGFR equations showed only minimal to weak agreement for defining reduced GFR (eGFR<60 mL/min/1.73 m2) (Fig. 2). The proportion of reduced GFR was the highest based on the CKD-EPICysC equation and the lowest based on the CKD-EPICr equation (58.7% vs 44.9%, P<0.0001). This finding implies that the clinical decision regarding reduced GFR can be greatly affected by the eGFR equation used [22]. This is in line with the current recommendation not to use formulas to estimate GFR in critically ill patients [6]. Although it is recommended to estimate GFR by the calculated Cr clearance using the UV/P (mL/min) formula in these patients, this technique requires the collection of at least one hour's worth of urine, which could constitute an obstacle from a practical viewpoint [612]. With the current serum Cr-based AKI definition, AKI mortality and morbidity remain high and the detection of suboptimal and/or early kidney injury is not optimal; thus, AKI diagnosis is shifting from clinical to molecular diagnosis [23]. In this regard, the availability of stable, surrogate renal biomarkers would be beneficial; PENK could be a promising option instead of using equations or formulas.
Another noticeable finding was that PENK, NGAL, and the four eGFR equations showed significant differences between patients with and without AKI only in the sepsis stage (Table 2). Moreover, in the sepsis stage, PENK concentration did not increase without AKI, while NGAL concentration increased substantially above its clinical cut-off value even without AKI (81.3 pmol/L for PENK vs 361.5 ng/mL for NGAL). Of the four eGFR equations, only CKD-EPICr and CKD-EPICr-CysC indicated normal kidney function (GFR≥60 mL/min/1.73 m2) in septic patients without AKI.
The pathophysiology driving SA-AKI is not completely understood and is distinct from other AKIs [52425]. SA-AKI may have numerous drivers, including ischemic-reperfusion injury to the glomerulus, inflammation of specific parts of the nephron, hypoxic and/or oxidant stress, cytokine- and chemokine driven tubular injury, and tubular and mesenchymal apoptosis [526]. Moreover, septic shock is a subset of sepsis characterized by a state of acute circulatory failure associated with infection. Our data shows that both renal biomarkers increased and the four eGFR equations decreased in the septic shock stage, even in patients without AKI (Table 1 and Table 2). In addition to its role as a renal biomarker, PENK has also been reported to be an independent predictor of heart failure [2728]. Taken together, increased PENK concentration in the septic shock stage can be explained by both renal and cardiac dysfunction. The observation of decreased eGFR in septic shock without AKI also supports the recent recommendation not to use eGFR equations for these critically ill patients [6]. In this study, AKI was diagnosed based on serum Cr change according to the KDIGO criteria [17]. However, the increase in serum Cr occurs relatively late, 24–48 hr after kidney injury. In view of this inherent limitation of the serum Cr-based definition of AKI, subclinical AKI has been suggested by the Acute Dialysis Quality Initiative (ADQI)-10 consensus work group [29]. High PENK concentrations in the septic shock stage may suggest the presence of subclinical AKI, which cannot be detected by the current definition.
PENK and NGAL concentrations increased significantly as GFR reduced according to the GFR categories (Fig. 3). Of note, regardless of the eGFR equation used, PENK concentration was constantly lower than the 154.5 pmol/L cut-off in normal GFR (≥60 mL/min/1.73 m2) categories and it was also lower than the 99th percentile of the normal range (80 pmol/L). However, NGAL concentrations were higher than the literature- and manufacturer-recommended 150 ng/mL cut-off, although they were below the 493 ng/mL ROC curve analysis cut-off. These findings imply that PENK may reflect GFR better than NGAL and may not be influenced by inflammation. Otto et al [30] reported that the function of circulating plasma NGAL is not restricted solely to the detection of AKI; it might be involved in immune response during inflammation. PENK would be a reliable and objective alternative to eGFR equations for defining reduced GFR and the presence of AKI in septic patients.
Marino et al [14] reported that admission PENK and NGAL concentrations were increased in patients who died within seven day of admission, while procalcitonin and Cr clearance were not. In the present study, PENK concentration and eGFRs based on the four equations all showed significant differences between survivors and non-survivors (Table 3). We also observed significant differences between the two groups (favorable vs unfavorable) in the survival analysis using two different cut-offs. However, no significant differences were observed for NGAL, regardless of the cut-off. Our data suggests that PENK is superior to NGAL in predicting clinical outcome in septic patients. Moreover, the highest HR was observed when the 80 pmol/L cut-off was applied for PENK. This finding supports the appropriateness and clinical usefulness of this cut-off in septic conditions [18].
This study has several limitations. We focused on the comparison between PENK and NGAL concentrations with eGFR equations in terms of AKI diagnosis and prognosis prediction; thus, we did not investigate the distribution of these biomarkers in relation to the specific bacteriological identification. In addition, we did not compare PENK and NGAL with the other AKI biomarkers including interleukin 8 and kidney injury molecule-1. We could not collect follow-up samples for serial observation of these biomarkers in septic patients. This study was a cross-sectional retrospective registry study; therefore, it was difficult to observe the temporary development of AKI in association with PENK and NGAL increase. Although we compared eGFRs according to the MDRD Study and CKD-EPI equations, we did not measure the actual value of GFR; therefore, we could not determine which eGFR value was the closest to true GFR. Lastly, we had no information regarding PENK dynamics between pre- and post-RRT; because of its low molecular weight (5 kDa), it might have been dialyzed. Thus, further studies are necessary to answer these questions.
In conclusion, this is the first study to demonstrate the usefulness of PENK in comparison with NGAL and eGFR equations for the diagnosis of AKI and prediction of prognosis in septic patients. Regardless of the variability of GFR category by the different eGFR equations, PENK showed constant and significant associations with all the eGFR equations. In contrast to NGAL, PENK was not influenced by inflammation and predicted clinical outcome. With its diagnostic robustness and predictive power for survival, PENK constitutes a promising biomarker in critical care settings including sepsis.

Notes

Authors' Disclosures of Potential Conflicts of Interest: AB, JSt, and OH are employed by Sphingotec GmbH, the company that provided the penKid assays for this study. The other authors declare no conflicts of interest. The authors alone are responsible for the content and writing of the paper.

References

1. Singer M, Deutschman CS, Seymour CW, Shankar-Hari M, Annane D, Bauer M, et al. The third international consensus definitions for sepsis and septic shock (Sepsis-3). JAMA. 2016; 315:801–810. PMID: 26903338.
2. Lameire NH, Bagga A, Cruz D, De Maeseneer J, Endre Z, Kellum JA, et al. Acute kidney injury: an increasing global concern. Lancet. 2013; 382:170–179. PMID: 23727171.
3. Rewa O, Bagshaw SM. Acute kidney injury-epidemiology, outcomes and economics. Nat Rev Nephrol. 2014; 10:193–207. PMID: 24445744.
4. Honore PM, Jacobs R, Hendrickx I, Bagshaw SM, Joannes-Boyau O, Boer W, et al. Prevention and treatment of sepsis-induced acute kidney injury: an update. Ann Intensive Care. 2015; 5:51–60.
5. Alobaidi R, Basu RK, Goldstein SL, Bagshaw SM. Sepsis-associated acute kidney injury. Semin Nephrol. 2015; 35:2–11. PMID: 25795495.
6. Ichai C, Vinsonneau C, Souweine B, Armando F, Canet E, Clec'h C, et al. Acute kidney injury in the perioperative period and in intensive care units (excluding renal replacement therapies). Ann Intensive Care. 2016; 6:48. PMID: 27230984.
7. Ronco C, Legrand M, Goldstein SL, Hur M, Tran N, Howell EC, et al. Neutrophil gelatinase-associated lipocalin: ready for routine clinical use? An international perspective. Blood Purif. 2014; 37:271–285. PMID: 25012891.
8. Zhang A, Cai Y, Wang PF, Qu JN, Luo ZC, Chen XD, et al. Diagnosis and prognosis of neutrophil gelatinase-associated lipocalin for acute kidney injury with sepsis: a systematic review and meta-analysis. Crit Care. 2016; 20:41. PMID: 26880194.
9. Levey AS, Bosch JP, Lewis JB, Greene T, Rogers N, Roth D. Modification of Diet in Renal Disease Study Group. A more accurate method to estimate glomerular filtration rate from serum creatinine: a new prediction equation. Ann Intern Med. 1999; 130:461–470. PMID: 10075613.
10. Levey AS, Stevens LA, Schmid CH, Zhang YL, Castro AF 3rd, Feldman HI, et al. A new equation to estimate glomerular filtration rate. Ann Intern Med. 2009; 150:604–612. PMID: 19414839.
11. Inker LA, Schmid CH, Tighiouart H, Eckfeldt JH, Feldman HI, Greene T, et al. Estimating glomerular filtration rate from serum creatinine and cystatin C. N Engl J Med. 2012; 367:20–29. PMID: 22762315.
12. Hoste EA, Damen J, Vanholder RC, Lameire NH, Delanghe JR, Van den, et al. Assessment of renal function in recently admitted critically ill patients with normal serum creatinine. Nephrol Dial Transplant. 2005; 20:747–753. PMID: 15701668.
13. Shah KS, Taub P, Patel M, Rehfeldt M, Struck J, Clopton P, et al. Proenkephalin predicts acute kidney injury in cardiac surgery patients. Clin Nephrol. 2015; 83:29–35. PMID: 25512100.
14. Marino R, Struck J, Hartmann O, Maisel AS, Rehfeldt M, Magrini L, et al. Diagnostic and short-term prognostic utility of plasma pro-enkephalin (pro-ENK) for acute kidney injury in patients admitted with sepsis in the emergency department. J Nephrol. 2015; 28:717–724. PMID: 25486879.
15. Schulz CA, Christensson A, Ericson U, Almgren P, Hindy G, Nilsson PM, et al. High level of fasting plasma proenkephalin-A predicts deterioration of kidney function and incidence of CKD. J Am Soc Nephrol. 2017; 28:291–303. PMID: 27401687.
16. Dellinger RP, Levy MM, Rhodes A, Annane D, Gerlach H, Opal SM, et al. Surviving sepsis campaign: international guidelines for management of severe sepsis and septic shock: 2012. Crit Care Med. 2013; 41:580–637. PMID: 23353941.
17. The Kidney Disease Improving Global Outcomes (KDIGO) Working Group. KDIGO clinical practice guideline for acute kidney injury. Kidney Int Suppl. 2012; 2:1–138.
18. Persson M, Berglund G, Nelson JJ, Hedblad B. Lp-PLA2 activity and mass are associated with increased incidence of ischemic stroke: a population-based cohort study from Malmö, Sweden. Atherosclerosis. 2008; 200:191–198. PMID: 18201705.
19. Kidney Disease Improving Global Outcomes Chronic Kidney Disease Guideline Development Work Group Members. KDIGO 2012 clinical practice guideline for the evaluation and management of chronic kidney disease. Kidney Int Suppl. 2013; 3:1–150.
20. Muller MP, Tomlinson G, Marrie TJ, Tang P, McGeer A, Low DE, et al. Can routine laboratory tests discriminate between severe acute respiratory syndrome and other causes of community-acquired pneumonia? Clin Infect Dis. 2005; 40:1079–1086. PMID: 15791504.
21. McHugh ML. Interrater reliability: the kappa statistic. Biochem Med (Zagreb). 2012; 22:276–282. PMID: 23092060.
22. Zhu Y, Ye X, Zhu B, Pei X, Wei L, Wu J, et al. Comparisons between the 2012 new CKD-EPI (Chronic Kidney Disease Epidemiology Collaboration) equations and other four approved equations. PLoS One. 2014; 9:e84688. PMID: 24454737.
23. Ronco C. Acute kidney injury: from clinical to molecular diagnosis. Crit Care. 2016; 20:201. PMID: 27384344.
24. Romanovsky A, Morgan C, Bagshaw SM. Pathophysiology and management of septic acute kidney injury. Pediatr Nephrol. 2014; 29:1–12. PMID: 23400860.
25. Schrier RW, Wang W. Acute renal failure and sepsis. N Engl J Med. 2004; 351:159–169. PMID: 15247356.
26. Gomez H, Ince C, De Backer D, Pickkers P, Payen D, Hotchkiss J, et al. A unified theory of sepsis-induced acute kidney injury: inflammation, microcirculatory dysfunction, bioenergetics, and the tubular cell adaption to injury. Shock. 2014; 41:3–11.
27. Arbit B, Marston N, Shah K, Lee EL, Aramin H, Clopton P, et al. Prognostic usefulness of proenkephalin in stable ambulatory patients with heart failure. Am J Cardiol. 2016; 117:1310–1314. PMID: 26916537.
28. Ng LL, Sandhu JK, Narayan H, Quinn PA, Squire IB, Davies JE, et al. Proenkephalin and prognosis after acute myocardial infarction. J Am Coll Cardiol. 2014; 63:280–289. PMID: 24140658.
29. Murray PT, Mehta RL, Shaw A, Ronco C, Endre Z, Kellum JA, et al. Potential use of biomarkers in acute kidney injury: report and summary of recommendations from the 10th Acute Dialysis Quality Initiative consensus conference. Kidney Int. 2014; 85:513–521. PMID: 24107851.
30. Otto GP, Hurtado-Oliveros J, Chung HY, Knoll K, Neumann T, Müller HJ, et al. Plasma neutrophil gelatinase-associated lipocalin is primarily related to inflammation during sepsis: a translational approach. PLoS One. 2015; 10:e0124429. PMID: 25893429.
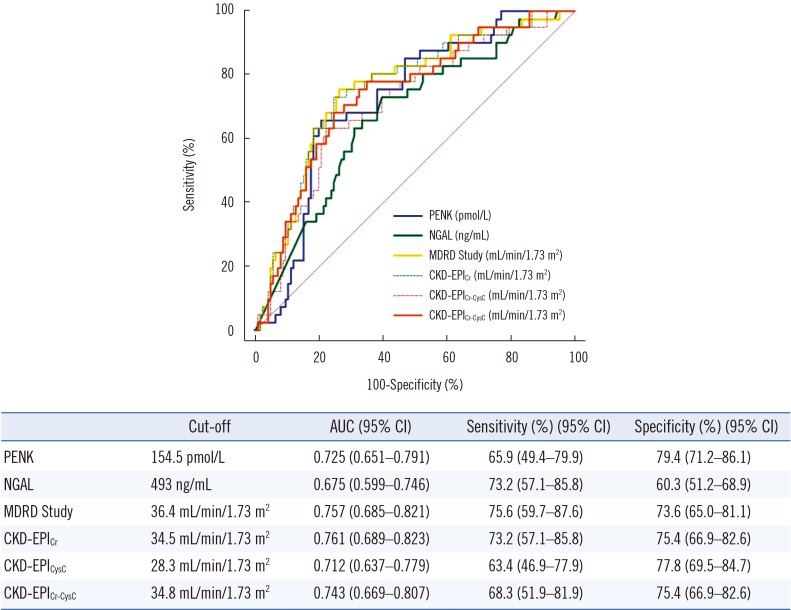
Fig. 1

Comparison of the receiver operating characteristics curves for the diagnosis of AKI in septic patients. PENK and the four eGFR equations showed fair discriminatory ability, but NGAL showed poor discriminatory ability. However, PENK, NGAL, and the four eGFR equations were all comparable and showed no statistical difference.

Abbreviations: see Table 1.
alm-37-388-g001
Fig. 2

Distribution and agreement of glomerular filtration rate (GFR) categories by each eGFR equation. The distribution of GFR categories varied across each eGFR equation. The proportion of reduced GFR (<60 mL/min/1.73 m2) was the highest based on the CKD-EPICysC equation and the lowest based on the CKD-EPICr equation (58.7% vs 44.9%, P<0.0001, Chi-square test). All eGFR equations showed minimal to weak agreement with each other (Kappa value, 0.310–0.541). Abbreviations: see Table 1.

alm-37-388-g002
Fig. 3

Comparison of PENK and NGAL concentrations according to GFR category. The distribution of PENK and NGAL concentrations differed significantly according to eGFR by each eGFR equation (all P<0.000001, Kruskal-Wallis test). (A) The median PENK concentration was below the 154.5 pmol/L cut-off obtained by the ROC curve analysis and was also lower than or similar to the 99th percentile of the normal range (80 pmol/L) in the normal GFR categories (≥60 mL/min/1.73 m2). (B) The median concentration of NGAL was below the 493 ng/mL cut-off that was obtained by the ROC curve analysis; however, it was higher than the literature- and manufacturer-recommended 150 ng/mL cut-off in the normal GFR categories. Data are expressed as median (interquartile range). Abbreviations: see Table 1.

alm-37-388-g003
Table 1

Characteristics of the study population and comparison between PENK, NGAL, and eGFRs according to sepsis severity

alm-37-388-i001
All patients (n=167) Suspected sepsis (n=31) Sepsis (n=99) Septic shock (n=37) P*
Age (yr), median [IQR] 70 [57–77] 67 [55–74] 70 [56–78] 72 [63–78] 0.3847
Male, n (%) 99 (59.3) 17 (54.8) 64 (64.6) 18 (48.6) 0.2053
Hospital stay (day), median [IQR] 14 [7–33.5] 21 [8–30] 14 [7–30] 7 [1–15] 0.0003
30-day mortality, n (%) 30 (18.0) 1 (3.2) 11 (11.1) 18 (48.6) < 0.0001
AKI by KDIGO criteria, n (%) 41 (24.6) 4 (12.9) 19 (19.2) 18 (48.6) 0.0005
RRT, n (%) 24 (14.7) 0 (0.0) 18 (18.1) 6 (16.2) 0.0393
PENK (pmol/L), median [IQR] 89.6 [54.2–199.7] 52.1 [34.8–78.6] 94.8 [55.0–217.8] 158.0 [99.5–309.3] <0.000001
NGAL (ng/mL), median [IQR] 468 [219.3–945.5] 240.0 [121.3–510.0] 468.0 [225.0–976.3] 670.0 [342.3–1,300] 0.013
eGFR MDRD Study (mL/min/1.73 m2), median [IQR] 51.8 [23.3–88.8] 107.7 [86.0–138.2] 56.1 [29.8–96.5] 29.7 [19.8–58.0] <0.000001
eGFR CKD-EPICr (mL/min/1.73 m2), median [IQR] 70.2 [31.0–100.5] 100.4 [94.1–120.2] 63.4 [32.0–99.5] 31.2 [20.4–64.1] <0.000001
eGFR CKD-EPICysC (mL/min/1.73 m2), median [IQR] 53.2 [22.3–80.2] 72.9 [59.7–99.6] 42.2 [20.7–75.3] 28.0 [19.2–66.0] 0.000003
eGFR CKD-EPICr-CysC (mL/min/1.73 m2), median [IQR] 59.5 [27.5–90.4] 90.8 [76.1–109.6] 53.8 [24.6–86.9] 29.7 [19.9–51.7] <0.000001

Data are expressed as median [interquartile range] or number (percentage).

*Kruskal-Wallis test.

Abbreviations: IQR, interquartile range; AKI, acute kidney injury; KDIGO, Kidney Disease Improving Global Outcomes; RRT, renal replacement therapy; PENK, proenkephalin; NGAL, neutrophil gelatinase-associated lipocalin; eGFR, estimated glomerular filtration rate; MDRD, Modification of Diet in Renal Disease; CKD-EPI, Chronic Kidney Disease Epidemiology Collaboration; Cr, creatinine; CysC, cystatin C.

Table 2

Comparison of PENK, NGAL, and eGFR equations according to the presence or absence of AKI in each stage of sepsis

alm-37-388-i002
Suspected sepsis (n=31) Sepsis (n=99) Septic shock (n=37)
AKI (n=4) No AKI (n=27) P* AKI (n=19) No AKI (n=80) P* AKI (n=18) No AKI (n=19) P*
PENK (pmol/L) 66.9 (50.7–84.6) 52.1 (33.7–73.4) 0.3458 211.5 (137.2–267.0) 81.3 (53.5–160.5) 0.0034 199.7 (101.7–304.3) 117.6 (80.6–209.6) 0.2128
NGAL (ng/mL) 336.0 (125.5–558.5) 240 (104.5–491.0) 0.7017 767.0 (386.8–1,300.0) 361.5 (210.5–889.0) 0.0159 803 (506.0–1,300) 471 (270.3–931.5) 0.0857
MDRD Study (mL/min/1.73 m2) 82.6 (66.8–123.7) 92.2 (71.9–112.2) 0.5557 17.8 (8.1–33.7) 51.9 (30.2–89.2) 0.0001 23.0 (16.9–29.7) 23.8 (17.2–67.5) 0.2875
CKD–EPICr (mL/min/1.73 m2) 92.8 (85.9–106.3) 100.5 (95.0–120.7) 0.1573 21.9 (10.5–46.5) 71.3 (41.5–102.0) 0.0001 25.7 (19.9–43.6) 29.5 (17.9–83.2) 0.5038
CKD–EPICysC (mL/min/1.73 m2) 65.8 (59.7–80.4) 80.8 (60.0–106.2) 0.4437 17.0 (10.8–36.3) 53.4 (29.1–78.0) 0.0005 25.7 (19.9–43.6) 29.5 (17.9–83.2) 0.5038
CKD–EPICr–CysC (mL/min/1.73 m2) 78.8 (72.3–93.7) 91.8 (76.3–115.2) 0.3165 16.9 (10.5–40.2) 62.9 (31.2–90.4) 0.0002 29.1 (21.7–34.8) 38.7 (19.8–76.6) 0.2740

Data are expressed as median (interquartile range).

*Mann-Whitney U test.

Abbreviations: see Table 1.

Table 3

Kaplan-Meier survival analysis in terms of 30-day mortality

alm-37-388-i003
Total (n=167) Optimal cut-off by ROC curve 30-day mortality (death/N, %) HR (95% CI) P Designated cut-off 30-day mortality (death/N, %) HR (95% CI) P
Non-survivor (N=30) Survivor (N=137) P* Favorable Unfavorable Favorable Unfavorable
PENK (pmol/L) 186.9 [103.4–273.5] 76.0 [50.4–158.1] 0.0001 154.5 12/114 (10.5) 18/53 (34.0) 3.9 (1.7–8.6) 0.0001 80 3/72 (4.2) 27/95 (28.4) 7.9 (3.9–16.2) <0.0001
NGAL (ng/mL) 548.5 [253.0–985.0] 407 [210.8–914.0] 0.4014 493 14/87 (16.1) 16/80 (20.0) 1.4 (0.7–2.9) 0.3551 150 4/26 (15.4) 26/141 (18.4) 1.4 (0.5–3.5) 0.5746
MDRD Study (mL/min/1.73 m2) 24.7 [15.3–42.3] 60.0 [28.0–92.6] 0.0033 36.4 9/102 (8.8) 21/65 (32.3) 4.3 (2.0–9.2) 0.0001 60 6/75 (8.0) 24/92 (26.1) 3.9 (1.9–8.0) 0.0011
CKD-EPICr (mL/min/1.73 m2) 33.2 [20.0–60.0] 82.8 [36.9–103.2] 0.0019 34.5 13/118 (11.0) 17/49 (34.7) 3.6 (1.6–8.1) 0.0002 60 7/92 (7.6) 23/75 (30.7) 4.8 (2.3–9.9) 0.0001
CKD-EPICysC (mL/min/1.73 m2) 22.7 [13.0–54.8] 56.7 [29.2–87.5] 0.0002 28.3 10/114 (8.8) 20/53 (37.7) 4.7 (2.2–10.4) <0.0001 60 6/69 (8.7) 24/98 (24.5) 3.2 (1.6–6.6) 0.0067
CKD-EPICr-CysC (mL/min/1.73 m2) 26.8 [17.5–48.4] 67.7 [30.8–91.2] 0.0003 34.8 10/108 (9.26) 20/59 (33.9) 3.9 (1.8–8.3) 0.0001 60 7/83 (8.4) 23/84 (27.4) 3.9 (1.9–8.0) 0.0006

Data are expressed as median [interquartile range] or number (percentage).

*Mann-Whitney U test.

Abbreviations: HR, hazard ratio; CI, confidence interval; see Table 1.

TOOLS
Similar articles