

 PDF
PDF ePub
ePub Citation
 Print
Print


INTRODUCTION
The chronic kidney disease-mineral and bone disorder (CKD-MBD) syndrome, which is defined by abnormalities in mineral and hormone metabolism, bone histomorphometric changes, and/or soft-tissue calcification, is an extremely important complication of kidney disease. Emerging evidence suggests that features of CKD-MBD may be present at early stages of CKD, with increases in parathyroid hormone (PTH) that begin at glomerular filtration rate (eGFR) levels of approximately 45 mL/min/1.73 m2; up to 56% of patients with an eGFR<60 mL/min/1.73 m2 will have elevated PTH levels [1234]. The recent Kidney Disease Improving Global Outcomes (KDIGO) guidelines underscore the complexity of managing secondary hyperparathyroidism, especially among the CKD population not yet on dialysis [5]. Measuring PTH is a significant clinical problem among CKD patients because of large variations between assays that recognize C-terminal fragments [67].
The second-generation assay (intact PTH assay), which was widely used until recent years, uses a capture antibody directed against the C-terminus (39–84) and a signal antibody against different sections of the N-terminus (15–20 or 26–32) [8]. This assay overestimates PTH-mediated bone/mineral abnormalities (CKD-MBD) because it detects non-functioning, long C-terminal fragments (mostly 7–84 fragments) that accumulate as kidney function deteriorates [910].
The third-generation bio-intact PTH assay uses antibodies against the C-terminus as well as the first amino acids, 1–4 or 1–5, in the N-terminus and was designed to overcome the limitations of the second-generation assay that detected all the functioning as well as the non-functioning fragments [1112]. A recent study that measured the kidney extraction of PTH (by second-generation assay) among participants with a mean eGFR of 66 mL/min/1.73 m2 reported a result of 44.2% for the single-pass extraction of PTH, double the value for creatinine clearance, which was 22% [13]. This finding emphasizes the importance of kidney function in clearing PTH molecules and their fragments.
The second-generation PTH assay is still widely used in most laboratories for non-dialysis CKD patients, and the results instruct nephrologists during the diagnosis and treatment of CKD-MBD. However, few studies have compared PTH results between the second- and third-generation assays for different stages of CKD [14151617]. The present study evaluated the correlation between the third-generation Liaison 1–84 PTH assay (bio-intact PTH) and the Cobas, second generation PTH assay (intact PTH) among CKD patients varying in illness severity from stage 3 through stage 5. In addition, PTH values obtained with both assays were correlated with biological parameters.
METHODS
Blood samples were collected from 2014 through 2015 from 98 consecutive patients with CKD stages 3 to 5 during routine follow-up visits, kept on ice, and delivered to the laboratory within 60 min. The severity of the kidney disease was based on the eGFR calculated by using the CKD-EPI formula [18]. Twenty patients had CKD stage 3, 40 had CKD stage 4, and 38 had CKD stage 5. The samples were centrifuged immediately in a cold centrifuge, and the plasma was frozen at −20℃ until PTH analysis, within one week. Associated serum biomarkers obtained at the same time as PTH collection included albumin, creatinine, urea, phosphorus, hemoglobin, c-reactive protein (CRP), HbA1c, and 25(OH) and 1,25(OH)2 vitamin D. The Meir Medical Center Ethical Review Committee approved the study, and the data were reviewed retrospectively.
1. PTH assays
Quantitative PTH values were analyzed concurrently by using the second-generation PTH assay (Cobas, Roche Diagnostic GmbH, Mannheim, Germany) and the third-generation bio-intact 1–84 PTH assay (Liaison, DiaSorin, Saluggia, Italy). The second-generation PTH intact-STAT is a two-step, sandwich immunoassay. It uses chemiluminescent technology, in which a biotinylated antibody reacts with the N-terminal fragment (1–37) and a monoclonal antibody reacts with the C-terminal fragment (38–84). The new Liaison 1–84 PTH is a third-generation, two-site, automated sandwich immunoassay, in which the antibodies used specifically recognize 1–84 PTH and do not cross-react with the amino-truncated C-terminal fragments that accumulate in CKD patients. QC was performed with each assay and was found to be within the acceptable range for both kits. The range of the intact PTH STAT is 1.20–5,000 pg/mL (defined by the lower detection limit and the maximum of the master curve). Precision was determined by using pooled human sera (HS) and controls. For example, the following values were obtained: HS1=2.47±0.243 pg/mL (CV 16.5%), HS2=47.4±1.19 pg/mL (CV 2.7%), and the control=38.4±0.817 (CV 2.6%). The range of the bio-intact PTH liaison is 4–1,800 pg/mL. In this assay, precision was determined by using seven samples to determine its repeatability and reproducibility. For example, the following values were obtained: 12.2±0.73 pg/mL (CV 5.9%), 197±5.97 pg/mL (CV 3%), and 1,126±39.56 pg/mL (CV 3.5%). The derived functional sensitivity from the regression analysis of the precision profile was ≤4 pg/mL.
2. Statistical analysis
Data are expressed as the mean±SD and median (range). Variables were tested for normality (Shapiro-Wilk test). For the variables that were not normally distributed, the median (range) are presented. The PTH assays were compared by using two different methods for correlation analysis: Passing-Bablock linear regression analysis and the Bland-Altman limits of agreement plots. The latter analysis compares the validity of a new method (third-generation assay) with that of a known method (second-generation assay) to determine whether the two measurements agree sufficiently to be used interchangeably. For each parameter, the 95% agreement interval (mean difference between methods±1.96 SD) was calculated and compared with the clinically acceptable interval. The methods were considered interchangeable if the agreement interval fell entirely within this interval. The ratios of bio-intact 1–84 PTH/intact PTH among three groups of CKD patients were checked with one-way ANOVA. Continuous parameters were evaluated with Spearman rho correlation coefficients. P<0.05 was considered statistically significant. Data were analyzed by using SPSS-23 version software (IBM Coroporation, Armonk, NY, USA) and MedCalc version 12.7.8 (https://www.medcalc.org/).
RESULTS
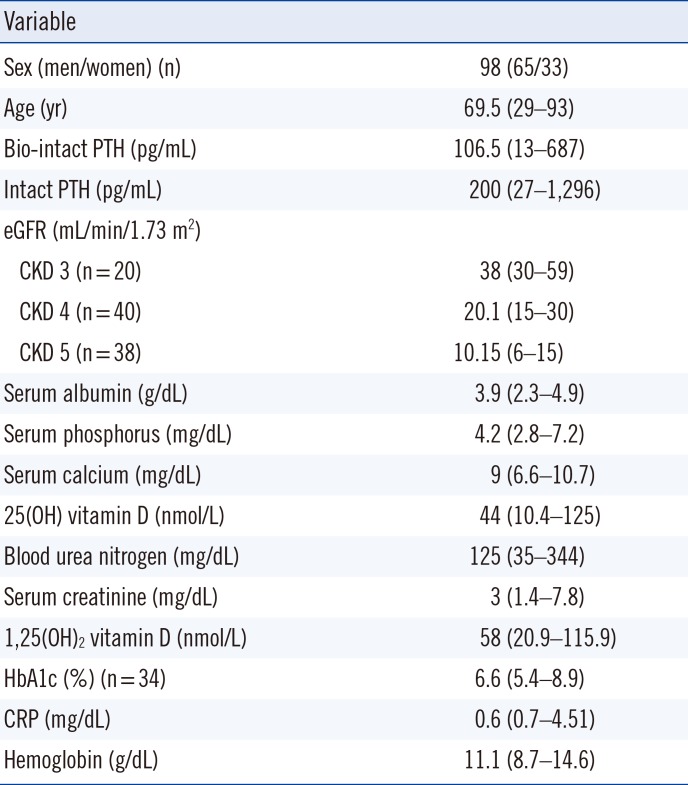
Sera from 98 patients with CKD stages 3 to 5 were obtained. All patients were Caucasian with a median age of 69.5 yr (29–93). The patients' laboratory results are summarized in Table 1. The primary causes of kidney diseases were diabetic nephropathy (38%), hypertensive nephrosclerosis (32%), chronic glomerulonephritis (18%), and others (12%).
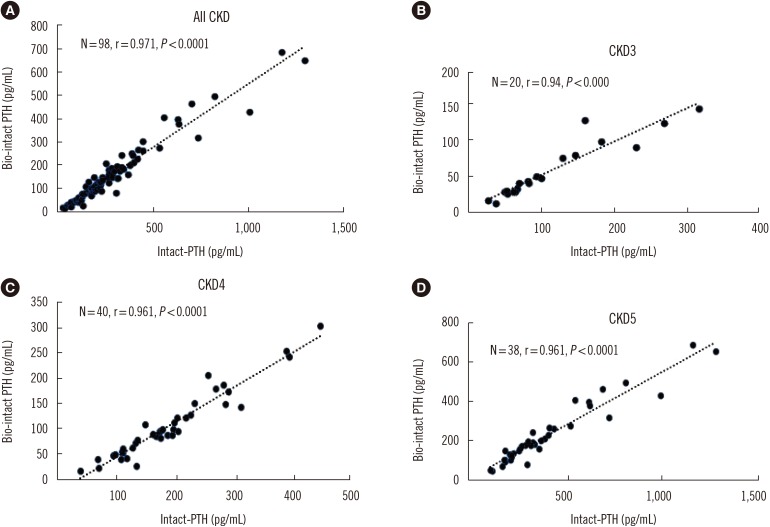
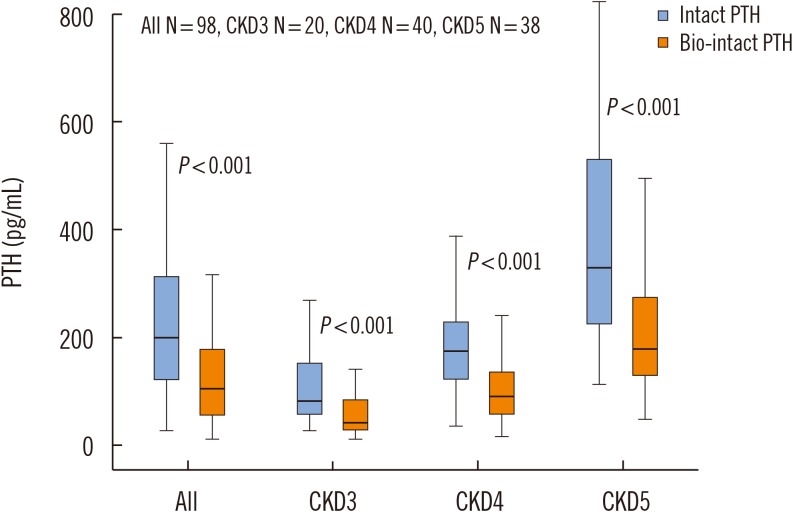
The average serum PTH concentrations obtained with the bio-intact PTH assay were significantly lower compared with the intact PTH concentrations detected by the second-generation assay (106 pg/mL (13–687) vs 200 pg/mL (27–1,296), respectively; P<0.0001). Correlations between assays for the CKD stages were tested by Passing-Bablok regression line with bio-intact PTH=−8.85±0.6 intact PTH, r=0.963, P<0.0001 (Fig. 1) and Bland-Altman limits of agreement analysis, with an average bias of 118.6 pg/mL, 95% CI: 97.24–139.9 (Fig. 2), which demonstrated sufficient agreement between the two assays across all CKD stages).
Stratifying the results according to CKD severity demonstrated significantly lower serum 1–84 PTH concentrations at all CKD stages with the bio-intact assay compared with the values with the intact PTH assay (data are presented as median (range): CKD 3: 42.5 (13–143) vs 83 (27–371), P<0.001; CKD 4: 92 (17–303) vs 175 (38–447), P<0.001; and CKD 5 179 (49–687) vs 330 (114–1,296), P<0.001) (Fig. 3).
PTH concentrations in both assays increased with CKD progression. However, the ratio between bio-intact and intact PTH was not affected by eGFR (CKD 3: 0.52±0.10 vs CKD 4: 0.54±0.11 vs CKD 5: 0.55±0.10, P=0.548).
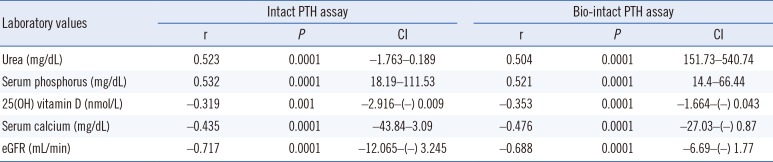
Serum PTH concentrations, as measured by both assays, were positively correlated with blood urea, phosphorus, and the calcium-phosphorus product (CaxP) and inversely correlated with blood calcium, 25(OH) vitamin D, and eGFR (Table 2). The diabetic patients, who constituted 38% of the study population, had significantly lower levels of serum albumin (P=0.01), calcium (P=0.05), and 25(OH) vitamin D (P=0.006) compared with the non-diabetic patients. Gender had no significant influence on the associated biomarkers (data not shown).
DISCUSSION
The current study compared the results of PTH concentration measurements obtained from the second-generation intact PTH-STAT assay and the third-generation bio-intact 1–84 PTH assay among patients with CKD stages 3 to 5. Bio-intact PTH concentrations were significantly lower than intact PTH concentrations, approximately 40% lower at all CKD stages, beginning at stage 3 (eGFR<60 mL/min/1.73 m2).
As described in the Methods section, bio-intact and intact PTH concentrations in our laboratory have almost identical reference intervals, suggesting similar levels among the general population. However, previous reports have noted large variations in PTH immunoassay results [19]. A study in a non-CKD population reported that the bio-intact PTH concentration was on average 38% lower than the intact PTH concentration [20].
The difference in PTH concentrations between the second- and third-generation assays has been studied among hemodialysis patients [202122]. PTH concentrations with the third-generation assay were lower than those with the second-generation assay at a magnitude of 40% to 50%, with a good correlation between them [822232425]. The current study demonstrated similar findings among a CKD population not on dialysis, with a good correlation between assays and lower concentrations of bio-intact PTH across CKD stages 3 to 5. As expected, PTH concentrations increased with CKD progression, but the ratios between bio-intact PTH and intact PTH at various CKD stages were similar.
Studies that compared other second- and third-generation PTH assays among CKD patients reported similar results. Bio-intact PTH concentrations measured by third-generation assays were consistently lower than intact PTH concentrations, but the differences varied [14151617]. Two studies reported differences similar to those found in our study [1417], whereas two other studies found a smaller difference [1516]. One study demonstrated an eGFR-dependent effect on the ratio between bio-intact PTH and intact PTH in one assay, but not in the other [14].
The process of PTH metabolism and extraction is not completely understood; however, the kidneys have a significant role in this process [13]. PTH concentrations increase with CKD progression due to increased secretion, but reduced clearance, mainly of C-terminal PTH fragments, is also suggested to play a role.
PTH concentrations with the intact PTH assay were higher in all CKD stages compared with the concentrations with the bio-intact PTH. We cannot explain precisely why the ratio between bio-intact and intact PTH did not change with CKD progression in our study. It could be that subtle eGFR-dependent changes could not be captured owing to assay variations, as previously reported, especially among the CKD population [817]. This finding emphasizes the need for additional large studies and standardization of the various assay methods among the CKD population. An attempt to apply a correction factor between third-generation bio-intact PTH assays and second-generation PTH assays resulted in the misclassification of about 20% of patients. Furthermore, these results were restricted to hemodialysis patients and could not be reproduced for the entire CKD population [8].
As expected, we observed a positive correlation between the two PTH assays and blood urea, phosphorus, and the CaxP. An inverse correlation was observed with blood calcium, 25(OH) vitamin D, and eGFR. These results agree with those of previous studies and confirm the relationship between specific biologic parameters and secondary hyperparathyroidism in CKD patients [2627].
The patients with diabetes had significantly lower blood calcium, albumin, and 25(OH) vitamin D concentrations. These results could be indicators of a poorer nutritional status or/and malabsorbtive mechanisms, which are more prevalent in diabetic patients. Low 25(OH) vitamin D concentrations have been reported among diabetic patients [28]. We saw a non-significant trend toward higher intact PTH concentrations compared to the non-diabetic population (276±268 vs 245±129 pg/mL; P=0.449), which could be attributed to low vitamin D concentrations.
A panel of experts recently discussed the role of the second- and third-generation PTH assays in the diagnosis of primary hyperparathyroidism (PHPT). The panel concluded that the third-generation PTH assays were not more sensitive for detecting PHPT than the second-generation assays and recommended using the second-generation assay with careful identification of the proper reference range [29]. However, this recommendation was based on a PHPT population, and its relevance to the CKD population has not been determined.
Intact PTH concentrations measured by the second-generation assays have been used as a surrogate marker of bone turnover in patients with CKD stages 3 to 5, based on histomorphometric studies. Features of CKD-MBD were observed in CKD as early as stages 3 to 4, with secondary hyperparathyroidism frequently developing at GFR<45 mL/min/1.73 m2 [31730]. The advantage of the third-generation assays in predicting bone turnover disease was evaluated among CKD 5 dialysis patients and were not found to be superior to intact PTH assays [3132]. However, Lehmann et al [17] assessed patients with CKD stages 3 to 4 and found a modest improvement in discriminating between low and high bone turnover disease in this group when using the bio-intact PTH assay compared with the intact PTH assay. No advantage was found in the CKD 5 dialysis population [17].
The present study found that significantly higher PTH concentrations were measured with the second-generation assay than with the third-generation assay, beginning with CKD as early as stage 3. This difference might affect CKD-MBD management in this population, leading to increased efforts to suppress PTH production and secretion and consequent concerns regarding the over-prescription of medications and potential development of low turnover bone disease. Additional studies that correlate the diagnosis and management of CKD-MBD with bone turnover findings are needed to determine whether bio-intact PTH assays are a better surrogate marker in these early stages of CKD.

 XML Download