

 PDF
PDF ePub
ePub Citation
 Print
Print


INTRODUCTION
The equation derived in the Modification of Diet in Renal Disease (MDRD) study was recommended by the 2002 Kidney Disease Outcomes Quality Initiative of the National Kidney Foundation practice guidelines for chronic kidney disease (CKD) to calculate the serum creatinine (Scr)-based estimated glomerular filtration rate (eGFR) in adults [1]. Following its introduction, many clinical laboratories have calculated the eGFR in adults using the MDRD equation and have reported this value along with the Scr concentration via laboratory information systems (LISs). However, the MDRD equation has a major disadvantage, in that bias is increased at higher GFRs [2]. To overcome this limitation, the Scr-based Chronic Kidney Disease Epidemiology Collaboration (CKD-EPIcr) equation was developed, and the eGFR equation recommended for adults in the current 2012 Kidney Disease: Improving Global Outcomes (KDIGO) guidelines for CKD has been changed from the MDRD to the CKD-EPIcr equation [234].
According to the 2012 KDIGO guidelines for CKD, it is acceptable to use an alternative Scr-based eGFR equation instead of the CKD-EPIcr equation; however, the accuracy of the alternative equation should be compared to that of the CKD-EPIcr equation [4]. New eGFR equations, including the revised Lund–Malmö (revised LM) [56] and full age spectrum (FAS) equations [7], were developed for use with Western (mainly Caucasian) populations. Both equations reportedly produce accurate and precise eGFRs compared with those of the CKD-EPIcr equation [57]. When estimating GFR using the Scr-based eGFR equation, the most significant factor is the Scr concentration, which reflects individual lean body mass that is in turn influenced by sex, age, body mass index (BMI), and race. In addition, laboratory-related factors can affect Scr levels, such as the calibrator used to measure Scr concentration (isotope dilution mass spectrometry [IDMS]-traceable vs non-IDMS-traceable calibrator), type of test reagent (Jaffe vs enzymatic method), and the analytical performance of individual laboratories [8].
The recently introduced FAS and revised LM equations were developed from the Scr results for Caucasians obtained by using an enzymatic method with an IDMS-traceable calibrator [57]. Thus, it was necessary to evaluate whether these equations could be applied to Koreans. Ji et al [9] compared the revised LM equation with the MDRD and CKD-EPI equations for use in Koreans; however, the accuracy of the revised LM equation was not evaluated, because eGFR was not compared with measured GFR (mGFR) in that study. In addition, studies on the performance evaluation of the Asian CKD-EPI and FAS equations for Koreans are limited. Therefore, the purpose of this study was to assess the analytical and clinical performance of the eGFR equations, including the revised LM and FAS equations, in Koreans.
METHODS
1. Study population
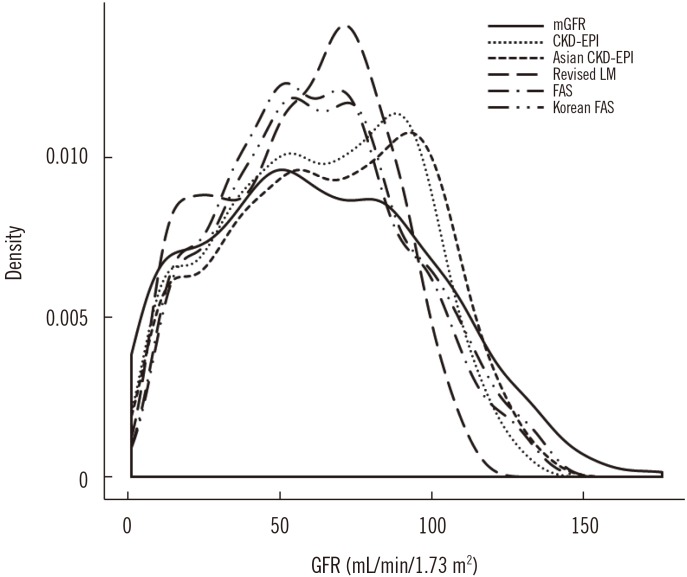
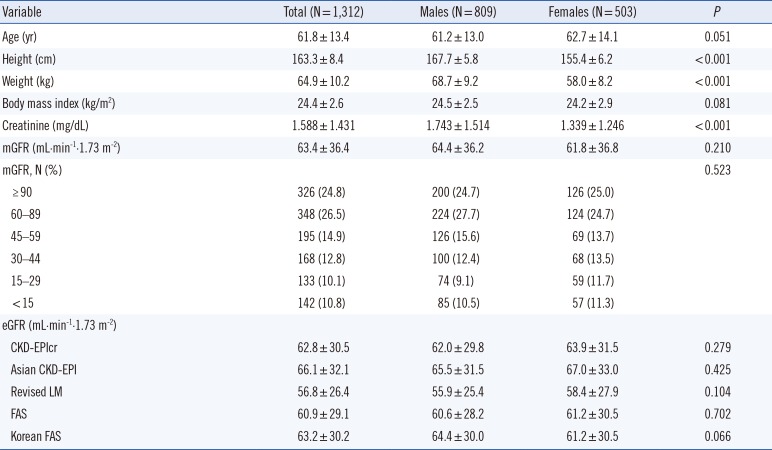
We reviewed the electronic medical records of patients. The inclusion criteria were as follows: (1) patients who underwent GFR measurements (mGFR); (2) age ≥20 yr; and (3) Scr concentrations measured on the same day of GFR measurement. In total, 3,019 patients underwent mGFR using 51Cr-EDTA between July 2009 and May 2016 at Asan Medical Center (Seoul, Korea). Among these patients, 2,331 were adults aged 20 yr and above, 1,368 of whom had their Scr concentrations measured on the day of 51Cr-EDTA mGFR. Exclusion criteria were as follows: (1) extreme BMI; and (2) a very low Scr concentration. Five subjects with a BMI<18.5 kg/m2 and 13 subjects with a BMI>30.0 kg/m2 were excluded. In addition, since most eGFR equations will largely overestimate the true GFR when the Scr concentration is too low, 38 subjects with Scr concentrations lower than the lower limit of the population reference interval (0.73–1.18 mg/dL for Korean adult males and 0.52–0.90 mg/dL for Korean adult females) were excluded. The reference intervals for the Scr assay were established according to the CLSI document EP28-A3C [10] using data from the Korea National Health and Nutrition Examination Survey (KNHANES VI, 2013–2015; see Supplemental Table S1 and Table S2). Finally, a total of 1,312 subjects were included in the study. Of the 1,312 patients, 809 (61.7%) were males. The mean age was 61.8 yr, and the mean Scr concentration was 1.588 mg/dL. The mean 51Cr-EDTA GFR value was 63.4 mL·min-1·1.73 m-2. The detailed characteristics of the study groups and the sex-specific comparisons are presented in Table 1. The distribution of GFR values is summarized in Fig. 1. This study was approved by the Institutional Review Board of Asan Medical Center (approval number: 2016-0535).
2. Measurement of 51Cr-EDTA GFR
GFR was measured by using the radioactive isotope 51Cr-EDTA. The detailed measurement procedure has been described previously [11]. 51Cr-EDTA GFR was taken as the reference GFR value.
3. Measurement of Scr
Scr concentrations were measured by a rate-blanked compensated kinetic Jaffe method (Roche Diagnostics, Indianapolis, IN, USA) using an IDMS-traceable calibrator (C.f.a.s calibrator; Roche Diagnostics). The mean within-laboratory imprecision (%CV) of the Scr assay during the study period was 2.8%.
4. Calculation of eGFR
The eGFR was calculated by using the following equations.
1) CKD-EPIcr equation [2]
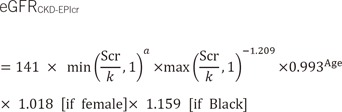
Where: k, 0.7 for females and 0.9 for males
α, −0.329 for females and −0.411 for males
2) Asian CKD-EPI equation [12]
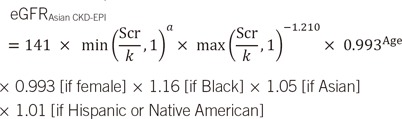
Where: k, 0.7 for females and 0.9 for males
α, −0.328 for females and −0.412 for males
3) Revised LM equation [5]
Where X= 2.50 + 0.0121×(150–Scr) for females with Scr<150 µmol/L
X= 2.50−0.926×ln(Scr/150) for females with Scr≥150 µmol/L
X= 2.56 + 0.00968×(180–Scr) for males with Scr<180 µmol/L
X= 2.56−0.926×ln(Scr/180) for males with Scr≥180 µmol/L
4) FAS equation [7]
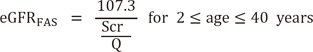
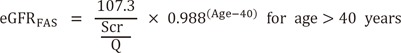
Where Q is the median Scr value for the age- or sex-specific healthy populations listed in a previous report [7]. The Q-value of the FAS equation was determined with reference to that of a Belgian population, as follows: males aged >20 yr, 0.90 mg/dL (80 µmol/L); and females aged >20 yr, 0.70 mg/dL (62 µmol/L) [7].
To evaluate the Korean version of the FAS equation (Korean FAS), the Q-value for Koreans was calculated from the National Health and Nutrition Examination Survey VI (2013–2015) data. The Q-value for Koreans was 0.96 mg/dL (85 µmol/L) for males aged >20 yr and was 0.70 mg/dL (62 µmol/L) for females aged >20 yr (see Supplemental Table S3).
5. Statistical analysis
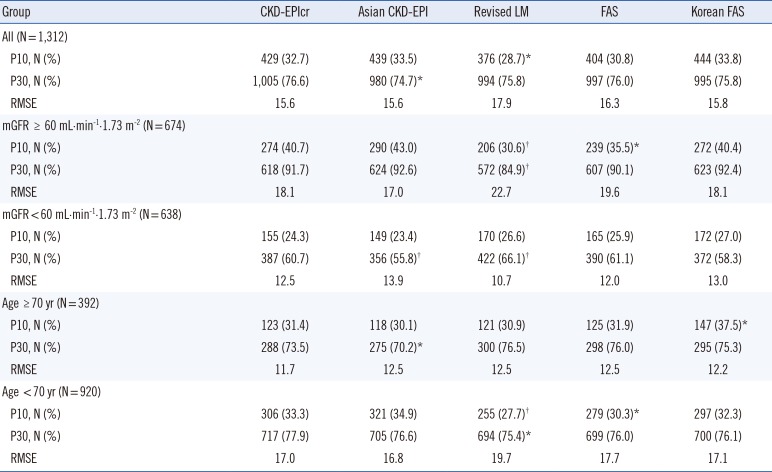
To assess analytical accuracy, the bias (eGFR–mGFR) of each eGFR equation was calculated, and the one-sample t-test was used to compare the average bias of each eGFR equation in differing significantly from zero. To evaluate clinical accuracy, we calculated the fraction of 51Cr-EDTA GFR ±10% (P10) and ±30% (P30) of each eGFR equation. The McNemar test was used to compare the P10 and P30 values between equations. The root mean square error (RMSE) was calculated to evaluate the precision of the eGFR equations. Subgroup analyses were performed based on GFR (<60 vs ≥60 mL·min-1·1.73 m-2) and age (<70 vs ≥70 yr old).
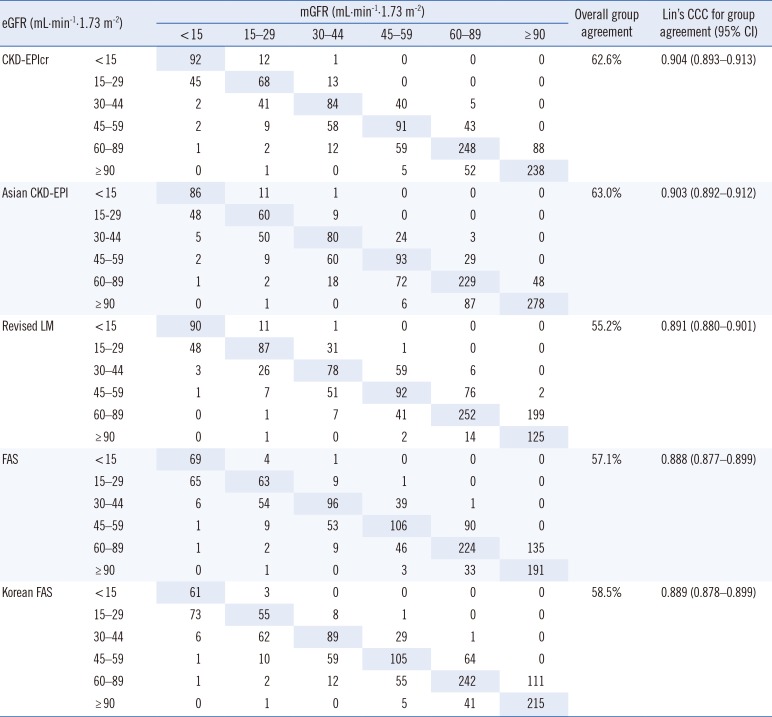
The mGFR was divided into six categories (GFR category 1, ≥90; 2, 60–89; 3A, 45–59; 3B, 30–44; 4, 15–29; and 5,<15; all values are expressed in mL·min-1·1.73 m-2) based on the 2012 KDIGO guidelines [4]. The overall group agreement between mGFR and eGFR categories and the Lin's concordance correlation coefficient (CCC) for group agreement were assessed. McBride proposed the strength of agreement criteria for Lin's CCC as follows: <0.90, poor; 0.90–0.95, moderate; 0.95–0.99, substantial; and >0.99, almost perfect [13].
Statistical analyses were performed by using MedCalc (ver. 14.12.0; MedCalc Software, Ostend, Belgium) and Analyse-it for Microsoft Excel software (ver. 4.65.2; Analyse-it Software, Ltd., Leeds, UK). Continuous variables are expressed as mean±SD and categorical variables are expressed as percentages (%). P values<0.05 were considered statistically significant.
RESULTS
1. Accuracy of eGFR values
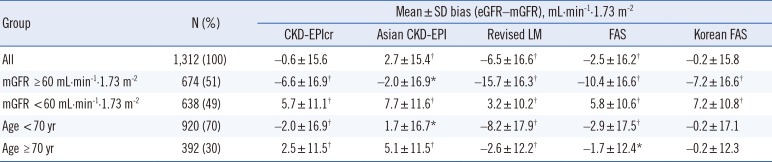
The mean±SD bias values (mL·min-1·1.73 m-2) of each eGFR equation, when applied to all patients, are shown in Table 2. The bias of the Asian CKD-EPI, revised LM, and FAS showed a significant difference from zero (P<0.001); however, the bias of the other two equations did not. All five eGFR equations showed a significant negative bias ranging from −15.7 to −2.0 mL·min-1· 1.73 m-2 in the mGFR ≥60 mL·min-1·1.73 m-2 group, whereas all eGFR equations showed a significant positive bias ranging from 3.2 to 7.7 mL·min-1·1.73 m-2 in the mGFR<60 mL·min-1·1.73 m-2 group. In the age-based analysis (<70 vs ≥70 yr), there was a significant difference in the bias from zero for four of the equations except for the Korean FAS equation (Table 2).
When applied to males, the bias (mL·min-1·1.73 m-2) of the five eGFR equations was as follows: CKD-EPIcr, −2.3±15.5; Asian CKD-EPI, 1.2±15.3; revised LM, −8.5±16.6; FAS, −3.8±16.0; and Korean FAS, 0.0±15.6. Except for the Korean FAS, the bias of the other four equations was significantly different from zero. When applied to females, the bias (mL·min-1·1.73 m-2) of the five eGFR equations was as follows: CKD-EPIcr, 2.1±15.3; Asian CKD-EPI, 5.2±15.2; revised LM, −3.4±16.1; FAS, −0.5±16.2; and Korean FAS, −0.5±16.2. Except for the FAS and Korean FAS, the bias of the other three equations showed a significant difference from zero.
The mGFR P30 values are shown in Table 3, and these were similar among the eGFR equations in all subjects (74.7–76.6%). The P30 of the Asian CKD-EPI equation was significantly lower than that of the CKD-EPIcr equation (P<0.05).
In the mGFR ≥60 mL·min-1·1.73 m-2 group, the P30 of the revised LM was significantly lower than that of the CKD-EPIcr equation (P<0.05), whereas the P30 of the revised LM was significantly higher than that of the CKD-EPIcr equation (P<0.001) in the mGFR<60 mL·min-1·1.73 m-2 group. The P30 of the Asian CKD-EPI was significantly lower than that of the CKD-EPIcr equation (P<0.05) in the mGFR<60 mL·min-1·1.73 m-2 group.
The RMSE values of the eGFR equations are shown in Table 3, and these were similar for the five equations (range: 15.6–17.9).
2. Comparison between mGFR and eGFR
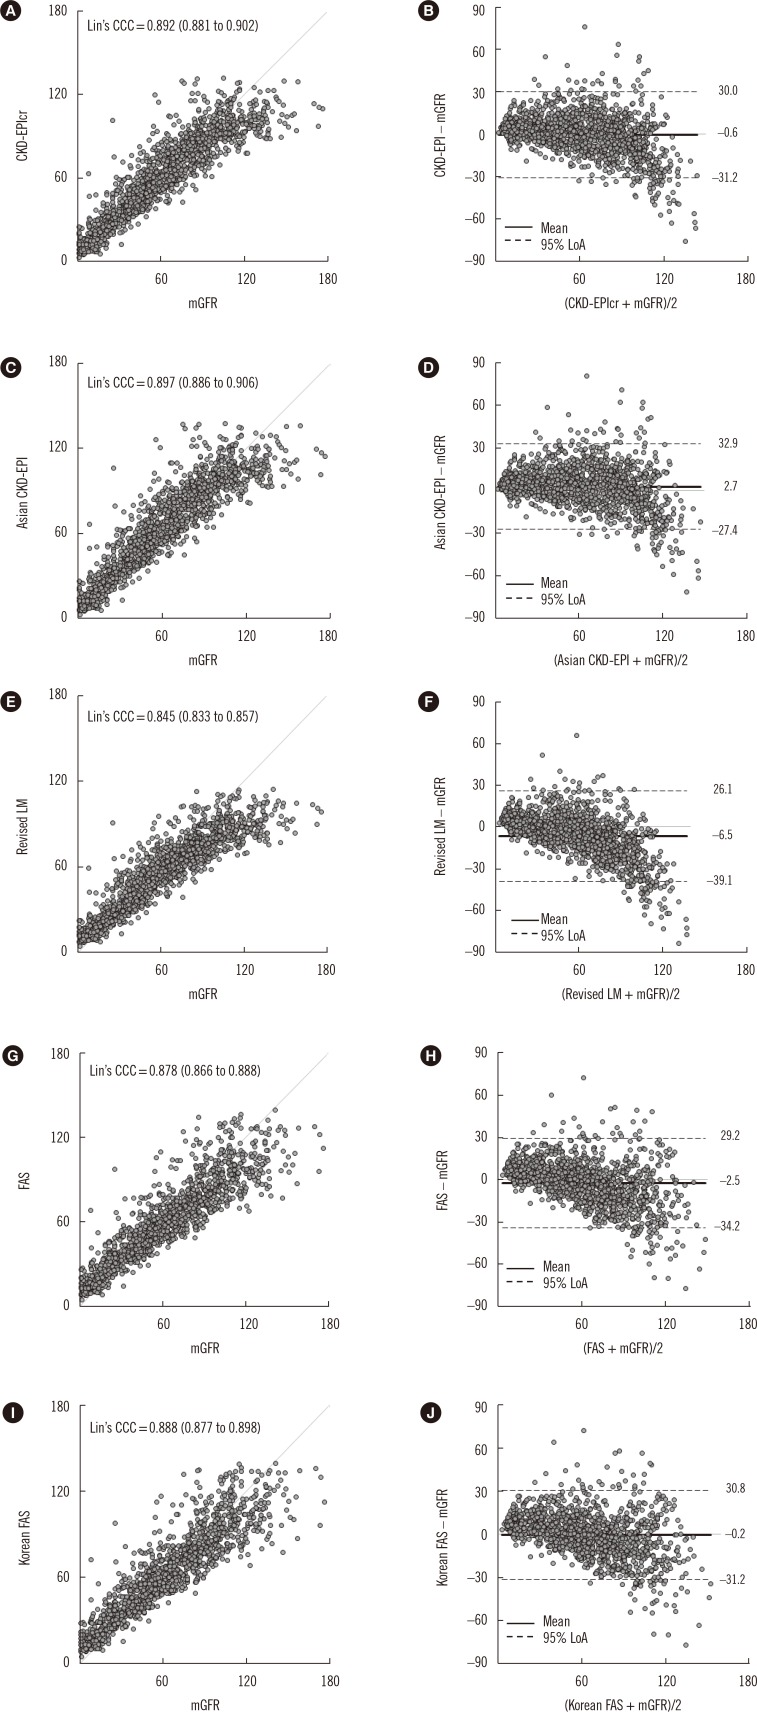
The Lin's CCC (95% confidence interval) values between the numeric value of mGFR and that of each eGFR equation were as follows: CKD-EPI, 0.892 (0.881–0.902); Asian CKD-EPI, 0.897 (0.886–0.906); revised LM, 0.845 (0.833–0.857); FAS, 0.878 (0.866–0.888); and Korean FAS, 0.888 (0.877–0.898) (Fig. 2).
Table 4 shows the overall group agreement of the six GFR categories between the mGFR and eGFR values of each equation, which were all >50%, with the highest agreement observed for CKD-EPI and Asian CKD-EPI, and the lowest observed for revised LM.
DISCUSSION
Although the bias of each eGFR equation varied depending on sex, mGFR, and age group, overall, the mean bias of the CKD-EPIcr and Korean FAS equations was not significantly different from zero. Moreover, among the five eGFR equations, the mean bias of the Korean FAS equation was nearest to zero and was smaller than that of the CKD-EPIcr equation (−0.2 vs −0.6). The P30 values of the five eGFR equations ranged from 74.7% to 76.6%, with the highest value obtained for CKD-EPIcr, and the remaining four equations showing clinically irrelevant differences. Both the CKD-EPIcr and Asian CKD-EPI equations showed the lowest RMSE value of 15.6; the RMSE values for the revised LM, FAS, and Korean FAS equations were 17.9, 16.3, and 15.8, respectively.
Comparison of the numeric values between mGFR and eGFR showed that although the Lin's CCC values of the five eGFR equations were all <0.90 (range 0.845–0.897), since both the mGFR and eGFR do not involve analytical chemistry measurement procedures, we considered that a Lin's CCC range of 0.85 to 0.90 is quite acceptable. Consequently, these results suggest that the Korean FAS equation has equivalent analytical and clinical performance to the CKD-EPIcr equation in Korean adults compared with the Asian CKD-EPI, revised LM, and FAS equations. Overall, both the CKD-EPIcr and Korean FAS were able to provide precise and accurate GFR estimates, but the other equations were also advantageous in the sub-group analysis. For example, the Asian CKD-EPI and revised LM equations showed the lowest bias for the mGFR ≥ 60 mL·min-1·1.73 m-2 group and for the mGFR<60 mL·min-1·1.73 m-2 group, respectively.
The performance of the eGFR equation could be improved by using coefficients specific for local ethnic groups [812]. The Asian CKD-EPI equation, as one of the four-level race (White and other, Black, Asian, Native American and Hispanic) CKD-EPI equations, was modified from the CKD-EPIcr equation [12]. In a previous study, the bias (eGFR–mGFR, mL·min-1·1.73 m-2) of the Asian CKD-EPI equation was found to be significantly improved compared with the CKD-EPIcr equation (−0.8 vs −2.1, P<0.005) [12]. In the present study, however, the mean bias of the Asian CKD-EPI equation was significantly higher than that of the CKD-EPIcr equation (2.7 vs −0.6 mL·min-1·1.73 m-2, P<0.001). In addition, the P30 of the Asian CKD-EPI equation was significantly lower than that of the CKD-EPIcr equation (74.7% vs 76.6%, P<0.05). These conflicting results may be explained by the following reasons. First, the Asian CKD-EPI equation may be less representative because it was developed from a relatively small group of participants (n=100) compared with the White and other (n=5,216), Black (n=2,585), or Native American and Hispanic (n=353) equations. Second, even the same Asian individual may have different clinical characteristics depending on their local region of origin or residence. Third, several factors related to the above-mentioned Scr assay can have an influence on the results. In a previous study, we reported that the bias of the Korean version of the CKD-EPI equation was significantly smaller than that of the CKD-EPIcr equation (−2.3 vs −3.0 mL·min-1·1.73 m-2, P<0.001) [11]. Therefore, the bias of the eGFR equation can vary depending on which equation is applied to which study group [1214].
The revised LM equation showed a positive bias at lower GFR levels and a negative bias at higher GFR levels [51516]. Our results are in accordance with these findings: the mean bias of the revised LM equation was lower than that of the CKD-EPIcr equation (3.2 vs 5.7), and the P30 value of the revised LM equation was significantly higher (66.1% vs 60.7%, P<0.001) than that of the CKD-EPIcr equation at mGFR<60 mL·min-1·1.73 m-2. In contrast, the mean bias of the revised LM equation was higher at mGFR ≥60 mL·min-1·1.73 m-2 than that of the CKD-EPIcr equation (−15.1 vs −6.6), and the P30 of the revised LM equation was lower (84.9% vs 91.7%, P<0.001). In other words, the revised LM equation predicted GFR more precisely and accurately than the CKD-EPI equation at GFR<60 mL·min-1·1.73 m-2, and the opposite was true for GFR ≥60 mL·min-1·1.73 m-2.
In general, the performance of the eGFR equation reflects the characteristics of the subjects involved in the development of the corresponding eGFR equation. The revised LM equation was intended to improve performance at a lower GFR level, and the median GFR of the study group was 55 mL·min-1·1.73 m-2 [6]. By contrast, the CKD-EPIcr equation was developed to improve the performance at a higher GFR level, and the mean GFR of the study group was 68 mL·min-1·1.73 m-2 [2]. Therefore, the characteristics of these research groups are reflected in the performance evaluation conducted in the present study. In addition to the characteristics of the study participants, performance evaluation of the eGFR equations may be influenced by the Scr concentration and GFR measurement methods [8]. For example, the revised LM equation used iohexol to measure GFR, whereas the CKD-EPIcr equation used iothalamate. For measurement of the Scr concentration, the revised LM equation used the enzymatic and modified Jaffe methods according to age, and the CKD-EPIcr equation used the enzymatic method. These differences in measurement methods could have affected the analytical performance of the eGFR equations.
The FAS equation has a simple structure compared with that of the MDRD, CKD-EPIcr, and revised LM equations. It is very important that the Q-value is set appropriately for application to the FAS equation. Because the Q-value for the FAS equation was derived from a Belgian population, we determined the Korean version of Q-values from a Korean population and compared the performance of the FAS equation with that of the Korean FAS equation. Our results showed that the Q-value of Korean males was higher than that of Belgian males (85 vs 80 µmol/L), while the values for females were the same in both populations (62 µmol/L) [7]. This difference may be explained by the characteristics of the population (Belgian vs Korean) or the analytical method used for Scr measurement (Jaffe vs enzymatic method). In this study, the overall mean bias of the Korean FAS equation was significantly lower than that of the FAS equation (−0.2 vs −2.5, P<0.0001), according to the concept of population-based Scr. These results are consistent with the implications of the FAS equation. Although we did not evaluate children, the FAS equation has the advantage of being able to apply the same equation to the age group of two years and older, unlike the CKD-EPIcr equation.
In conclusion, both the CKD-EPIcr and Korean FAS equations showed equivalent analytical and clinical performances, and thus may be the preferred choice for laboratories to report eGFR along with Scr in the Korean adult population.
 XML Download