

 PDF
PDF ePub
ePub Citation
 Print
Print


Dear Editor,
Many hospitals use blood glucose monitoring systems (BGMSs) supported by software for internal quality control (IQC) data management and transmission of patient data to the hospital information system (HIS). However, in some cases, user friendliness for patients or the cost of the device is prioritized over the availability of data transfer software. Consequently, some hospitals use BGMSs without the support of software. This method may be appropriate to familiarize patients with the system during the hospitalization period, if they will use the same system for the self-monitoring of blood glucose. Therefore, for the management and analysis of IQC data, we established a laboratory-developed quality control program (LDQCP) as an IQC data management program for the BGMS in the absence of software.
In total, 50 BGMSs (Barozen, Handok Inc., Seoul, Korea) were used at 24 locations within the Bucheon St. Mary's Hospital, Korea. Unit managers (UM) at each site analyzed two glucose levels in control material (high and low) daily; the IQC data were entered into Microsoft Excel 2010 spreadsheets (Microsoft Corporation, Redmond, WA, USA). Each cell in the spreadsheets contained formulae corresponding to the Westgard multirules, (12s, 13s, R4s, and 22s) for conditional formatting of the cell; the resultant coloring of the cell could alert operators to any violation of the multirules. On the last day of each month, the UM uploaded the spreadsheet files to a platform shared with a point-of-care testing committee, available on the HIS. At the beginning of the following month, all files were downloaded, imported into R version 3.3.2 statistical software [1], and analyzed on a personal computer. Mean, SD, CV, SD index (SDI), CV ratio (CVR), bias, total error (TE), and sigma-metric of the jth BGMS on the ith site were calculated by using the following equations with overall mean (meangrand) and SD (SDgrand) for each level of control for the month. The meangrand was always considered a target value regardless of the lot, even when more than two lots of control material were used. Desirable specification of the TE due to biological variation for plasma glucose of 5.5% was used as the allowable total error (TEa) to calculate the sigma-metric [2].
CVij=SDij/meanij×100
SDIij=(meanij-meangrand)/SDgrand
CVRij=CVij/CVgrand
Biasij=(meanij-meangrand)/meangrand×100
TEij=biasij+1.96×CVij
Sigma-metricij=(TEa-|biasij|)/CVij
Every month, from March to October 2016, the rank of an individual BGMS based on the sigma-metric along with the Levey-Jennings control chart created by the LDQCP was uploaded to the HIS. This study was approved by the Institutional Review Board of Catholic Medical Center at Catholic University of Korea (HC16EISI0099:HIRB-00205_3-003).
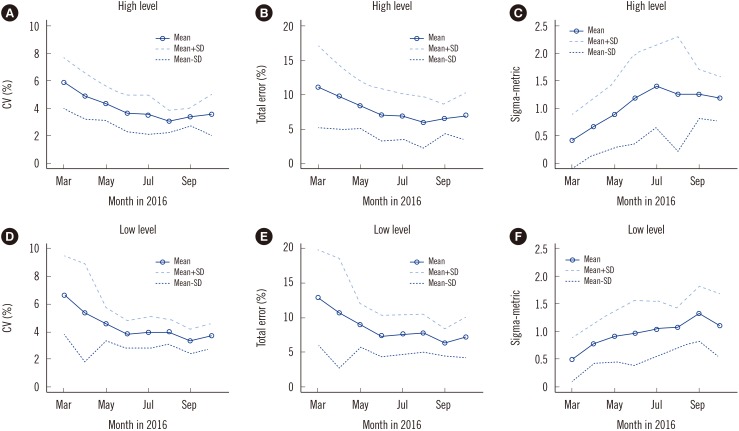
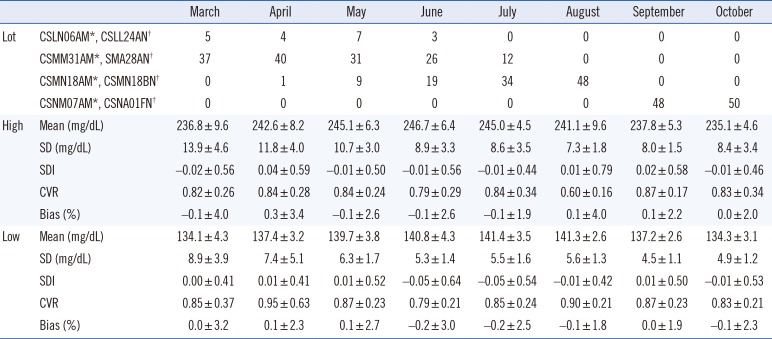
Hospital-wide means (SD) during the period ranged from 235.1 (4.6) to 246.7 (6.4) mg/dL (high level) and from 134.1 (4.3) to 141.4 (3.5) mg/dL (low level). Seven months from the beginning of the LDQCP, hospital-wide means for CV, bias, and TE were reduced for both the high and low levels. Sigma-metrics for the high and low levels increased from 0.4 (0.5) to 1.2 (0.4) and from 0.5 (0.4) to 1.1 (0.6), respectively, after a seven-month period (Table 1 and Fig. 1). Even in the period from March to July, when more than two lots of control material were used, both the TE and CV decreased. The mean of SDI, CVR, and bias showed little difference over the study period because they were calculated on the basis of the monthly overall mean and SD. Although sigma-metrics could differ depending on the TEa adopted for the calculation, the general trend would be similar.
Several factors are considered to contribute to the reduction in the imprecision of BGMS. When users receive their monthly IQC report, including the sigma-metric-based rank, they are generally more interested in the performance of their BGMS and motivated to do better than other sites. For instance, when a cell in the spreadsheet was colored, operators might have been more likely to focus on the IQC result violating Westgard multirules, for example, to analyze a new bottle of control or to replace the BGMS with another one in stock. As a result, the BGMSs in use at each site could maintain appropriate precision. It was also assumed that this factor affected the test results with patient specimens.
In conclusion, even in hospitals where a BGMS without IQC data management software is used, adoption of this LDQCP could improve the analytical performance of BGMSs.
 XML Download