The presence of minimal residual disease (MRD) after chemotherapy or bone marrow transplantation has been an important prognostic factor in B-lymphoblastic leukemia (B-ALL) [
12]. Conventionally, MRD can be detected by using multi-color flow cytometry or real-time PCR with high sensitivity. However, the detection of MRD can be limited in a subset of patients that lack leukemia-specific cell markers or harbor genetic abnormalities [
13].
In the early stage of B-cell differentiation, the immunoglobulin gene cluster regions undergo a complex rearrangement process to produce diverse antibody-coding sequences [
4]. When the immunoglobulin gene cluster regions are amplified by using specific primers, normal polyclonal cells show amplicons with variable sizes reflecting the broad antibody repertoire, whereas tumor cells derived from a single clone show amplicons with one or a few fixed sizes [
5]. Therefore, clonal immunoglobulin gene rearrangement can be a useful diagnostic and monitoring marker in a broad range of B-cell lymphoproliferative neoplasms, including B-ALL, plasma cell myeloma, and mature B-cell lymphoma [
678]. However, conventional fluorescent PCR and fragment analysis have drawbacks, including difficulty in interpretation of peak patterns in some cases and relatively low sensitivity compared with other highly sensitive assays [
9].
Rapid progression in next-generation sequencing (NGS) technologies has enabled highly sensitive cancer genomic testing in clinical laboratories [
10]. Although some NGS-based clonal immunoglobulin heavy chain gene (
IGH) rearrangement assays have already been tried for MRD monitoring of B-ALLs [
611], a considerable need still remains for a standardized
IGH clonality testing with acceptable performance and streamlined workflow suitable to clinical laboratory. LymphoTrack
IGH Assay (InVivoScribe Technologies, San Diego, CA, USA) includes a primer set targeting
IGH loci for preparing multiplex PCR library preparation and can be used on two NGS platforms: Ion Torrent Personal Genome Machine (PGM; Thermo Fisher Scientific, Waltham, MA, USA) and the MiSeq system (Illumina, San Diego, CA, USA). We further validated the clinical utility of NGS for
IGH rearrangement in a clinical setting, using amplicon-based library preparation kit and two NGS platforms: Ion Torrent PGM (for 1st-7th patients) and the MiSeq system (for 8th patient).
Written informed consent was obtained from the patients' parents, according to the ethical guidance of the institutional review board of the Severance Hospital, Yonsei University College of Medicine, Seoul, Korea. Genomic DNA was extracted from bone marrow samples by using the QIAamp DNA Blood Mini Kit (Qiagen, Venlo, The Netherlands).
PCR amplification for fragment analysis was performed by using the IdentiClone IGH Gene Clonality Assay kit (InVivoScribe Technologies). Multiplex primer sets in five master mixes target the variable, joining, and diversity region of the IGH locus. Fragment detection and analysis was performed by using 3130 DNA Analyzer (Applied Biosystems, Foster City, CA, USA) and GeneMapper 3.2 software (Applied Biosystems). Interpretation of clonal peaks in diagnostic samples was based on two criteria. The suspected peak should fall within the valid size range supplied by the manufacturer and be at least three times higher than the height of the third largest peak in the background. In follow-up samples, peaks with identical sizes in diagnostic samples and with a height exceeding that of an adjacent peak were interpreted as positive.
For NGS library preparation, DNA concentration was checked by using a Qubit 2.0 fluorometer (Thermo Fisher Scientific) and the Qubit dsDNA HS assay kit (Thermo Fisher Scientific), and adjusted to 10 ng/µL. The library was generated from 50 ng of DNA per sample using the LymphoTrack
IGH assay kit. The kit uses single multiplex master mixes targeting the conserved site in the variable region and the joining region of
IGH. For each run, positive and negative controls included in the kit were assayed simultaneously. After PCR amplification, the libraries were purified by using the Agencourt AMPure XP system (Beckman Coulter, Brea, CA, USA). Eighteen samples from patient 1–7 were tested by using the Ion Torrent PGM. Emulsion PCR was conducted by using the Ion OneTouch 400 template kit, and the enriched libraries were sequenced on the 318 chip with the Ion PGM Sequencing 400 kit (all from Thermo Fisher Scientific). Four samples from patient 8 were sequenced on the MiSeq System using the MiSeq Reagent Nano Kit v2 (Illumina) and the MiSeq Reagent Kit v2 (Illumina). Raw sequence data in FASTQ format were analyzed by using the Lymphotrack software package (InVivoScribe Technologies). The frequency of identical sequences in NGS was calculated by dividing the number of sequence reads by the total number of sequence reads in the sample. For interpretation, we adopted previously reported criteria [
12] and determined a 5% frequency as the cut-off for a leukemic clone in initial diagnostic samples. The presence of MRD in follow-up samples was determined by the presence of identical sequences of leukemic clones in the initial samples, even if the frequency of clone was less than 5%.
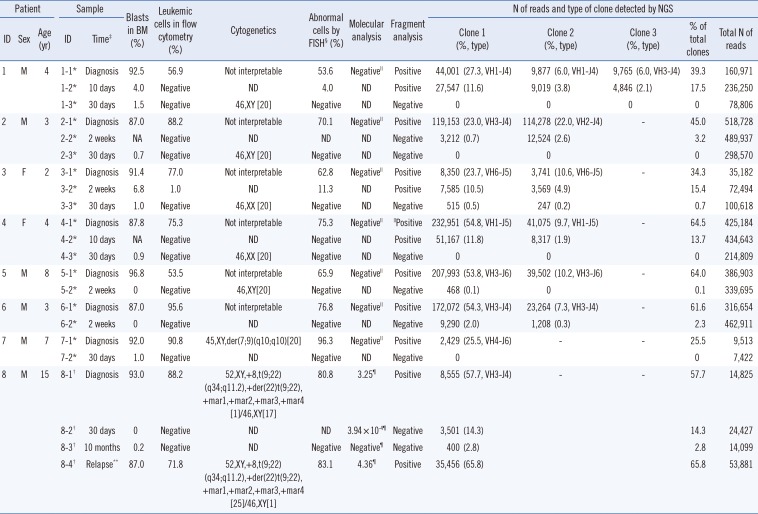
Patient demographics and the results of
IGH clonality tests are summarized in
Table 1. Total read counts ranged from 7,422 to 518,728. Interpretable results were obtained with higher sensitivity compared with fragment analysis, even in samples with relatively fewer reads (patients 3 and 7). Seven patients (patients 1–7) had no molecular markers other than the clonal
IGH rearrangement, whereas patient 8 was positive for t(9;22)(q34;q11.2);
BCR-ABL1. All initial diagnostic samples were positive for
IGH clonality by both fragment analysis and NGS.
Two patients (patients 7 and 8) had a single monoclonal clone according to the sequences identified by NGS, while five patients (patients 2–6) had two different clones and one patient (patient 1) had three clones. The proportion of leukemic clones in the IGH repertoire varied among samples (median 51.4%; range 25.5–64.5%). Among 14 follow-up samples, excluding one in relapse, three were positive in both fragment analysis and NGS (median 15.4%; range 13.7–17.5%). In contrast, six follow-up samples were negative by fragment analysis but positive by NGS (median 2.6%; range 0.1–14.3%). The proportions decreased as chemotherapy progressed, and converted to negative in four patients at 30 days after initial diagnosis.
Patient 8 was under long-term monitoring with real-time PCR for the
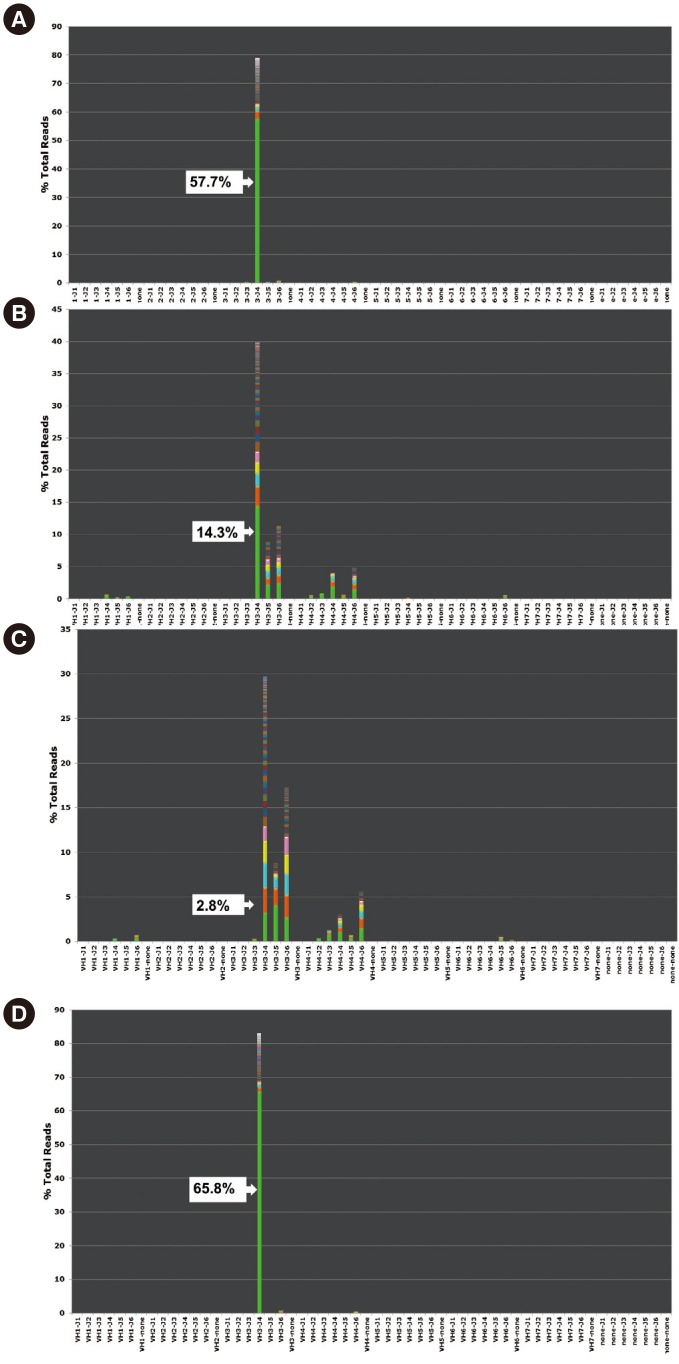
BCR-ABL1 fusion transcript. He received an allogenic bone marrow transplantation after eight months of chemotherapy. However, the disease relapsed one year after initial diagnosis and the patient died six months thereafter from pneumonia and systemic shock. At 10 months after initial diagnosis, which was just before full-blown relapse, BCR/ABL1 was negative but
IGH NGS showed the presence of initial clones (
Fig. 1).
Clonal
IGH rearrangement in B-ALL has an advantage as an MRD marker owing to its broad applicability and high positivity rate (84–95%) in all B-ALL cases [
1213]. Because the conventional method , fluorescence PCR-fragment analysis using a capillary electrophoresis sequencer, has a limitation of low sensitivity (1–10%), other sensitive methods such as real-time PCR with patient-specific primers have been tested for
IGH clonality detection in MRD monitoring [
9]. However, the labor- and time-consuming procedures of designing and validating patient-specific primers have been major hurdles of its widespread application in clinical laboratories [
12]. Moreover, there is a possibility of false-negative results because primers specifically designed for initial diagnostic clones can miss newly emerging clones with different genetic properties [
12].
The sensitivity of NGS for detecting
IGH clonality has been reported at 0.001–0.00001% in recent studies using different platforms [
61214]. In addition to fragment analysis, we detected six more positives by NGS in follow-up samples with a low proportion of clonal leukemic cells. Four patients (patients 2, 3, 5, and 6) with discrepant results were followed up with a complete remission state until 30–59 months after diagnosis. However, in one relapsed patient with the
BCR-ABL1 fusion, the MRD level detected by NGS was comparable to or even more sensitive than
BCR-ABL1 detection with real-time PCR. An additional experiment with six follow-up samples from six other B-ALL patients (data not shown) revealed a similar pattern: five samples showed concordant results (two positives and three negatives), and one sample showed a positive result in NGS and a negative result in fragment analysis. The clinical implication of these findings should be further validated in a study with a larger patient cohort.
Another advantage of NGS is that it can identify the number and DNA sequence of tumor clones within a sample. In this study, the numbers of clones at initial diagnosis ranged from one to three among patients. Previous studies reported the possibility of multiple leukemic clones in each B-ALL sample because of ongoing clonal evolution [
13]. Because of the small number of cases in this study, the clinical significance of the number and type of leukemic clones could not be analyzed. This should be explored in future studies involving a large and diverse patient series.
In summary, we evaluated an NGS-based IGH clonality assay using initial and follow-up samples of B-ALL patients. Using pre-designed primer set in library preparation kit and the provided software optimized for bioinformatics analysis, the experimental and bioinformatics analysis processes were streamlined. Furthermore, compared with conventional fluorescence PCR-fragment analysis, the NGS method was more sensitive in detecting positive follow-up samples. The prognostic impact of these low-level MRD detected by NGS should be validated with more data and further investigation. Nevertheless, we suggest that this NGS assay can be applicable for MRD monitoring in B-ALL in clinical laboratories.


 PDF
PDF ePub
ePub Citation
 Print
Print


 XML Download