

 PDF
PDF ePub
ePub Citation
 Print
Print


INTRODUCTION
According to the WHO's global estimates, more than 240 million people are chronically infected with Hepatitis B virus (HBV), and 780,000 people die every year as a consequence [1]. The prevalence of chronic HBV infection varies geographically, but Southeast Asia is an area with high prevalence (8–15%) [2]. Detection of HBV DNA is essential for diagnosis, and HBV DNA quantification is a key determinant of treatment for both HBV envelope antigen (HBeAg)-negative or HBeAg-positive chronic Hepatitis B (CHB) [34]. Recent studies suggested that after completing successful treatment, remaining HBV DNA correlates with relapse and recurrence of HBV infection, even at a low concentration [56].
The application of real-time PCR for viral diagnostics has been reported to exhibit high sensitivity, a broad dynamic range, and short turnaround time, and therefore is considered as the standard method for quantification [78]. To date, many HBV DNA assays are commercially available. Although two assays may be comparable, assays may report discrepant viral load levels [910]. Therefore, it is important to adopt a highly reliable PCR-based assay to quantify HBV DNA in order to enable appropriate clinical management of CHB. The QIAGEN artus HBV QS-RGQ assay (QIAGEN GmbH, Hilden, Germany) was newly launched but so far, only two abstracts have been published about its performance [1112].
Our study aimed to verify the performance of the artus HBV QS-RGQ assay compared with the Roche COBAS AmpliPrep/COBAS TaqMan HBV assay (Roche Molecular Diagnostics, Pleasanton, CA, USA) in clinical samples.
Go to : 
METHODS
1. Samples
A total of 508 serum samples where HBV DNA quantification had been requested by clinicians and determined by CAP/CTM v2.0 assay were randomly collected from 2008 to 2014. The remaining samples were stored at −70℃ until examined by the artus QS-RGQ assay. This study was performed according to the World Medical Association's Declaration of Helsinki guidelines and waived from the institutional review board of the Severance Hospital.
2. HBV DNA quantification assays
1) The COBAS AmpliPrep/COBAS TaqMan HBV assay (CAP/CTM v2.0)
The CAP/CTM v2.0 is an automated real-time PCR assay that targets the precore and core regions of the HBV genome. The HBV DNA preparation with the COBAS AmpliPrep instrument requires 650 µL of serum or plasma. DNA is extracted and eluted in a volume of 65 µL, 50 µL of which is then analyzed by PCR. Real-time PCR is performed by using the COBAS TaqMan 96 analyzer with a multiplex TaqMan assay. Two targets are amplified, HBV DNA and the internal quantitation standard. All procedures were performed according to the manufacturer's protocol. HBV DNA levels were expressed in international units per milliliter (IU/mL) with a conversion factor of 5.82 copies of HBV DNA per IU. The lower limit of detection (LOD) provided by the manufacturer is 20.0 IU/mL, and the dynamic range of quantification is from 20.0 to 1.7×10⁸ IU/mL (1.3–8.2 log10 IU/mL). This assay is capable of analyzing 24 specimens in about two hours [131415].
2) The artus HBV QS-RGQ assay (artus QS-RGQ)
The artus QS-RGQ kit requires an input of 1,000 µL of plasma sample. In this study, clinical serum samples were used instead of plasma. Nucleic acids are extracted and eluted in a final volume of 60 µL in elution buffer. Total nucleic acids were extracted with the QIAsymphony SP using the QIAsymphony DSP Virus/Pathogen Midi kits. Samples processed on the QIAsymphony SP can be transferred automatically to the QIAsymphony AS module (integrated operation) for assay setup. The QIAsymphony AS sets up the PCR reaction by mixing 30 µL of master mix and 20 µL of DNA template. The master mix contains reagents and enzymes for specific amplification of a 134-bp region of the HBV core gene and for direct detection of the amplicon. The real-time PCR was performed on Rotor-Gene Q instruments under conditions described in the QIAGEN artus HBV QS-RGQ kit handbook. Data were analyzed with the Rotor-Gene Q software version 2.02 using thresholds of 0.04 and 0.03 to detect signals from HBV and the internal control, respectively. Quantification of HBV DNA was determined by using 5-point external standards. The 1 IU/mL corresponds to 8.21 copies/mL for HBV DNA detection on the Rotor-Gene Q. The LOD claimed by the manufacturer is 10.0 IU/mL, and the linear range of quantification is from 31.6 to 2.0×10⁷ IU/mL (1.5–7.3 log10 IU/mL) (Table 1).
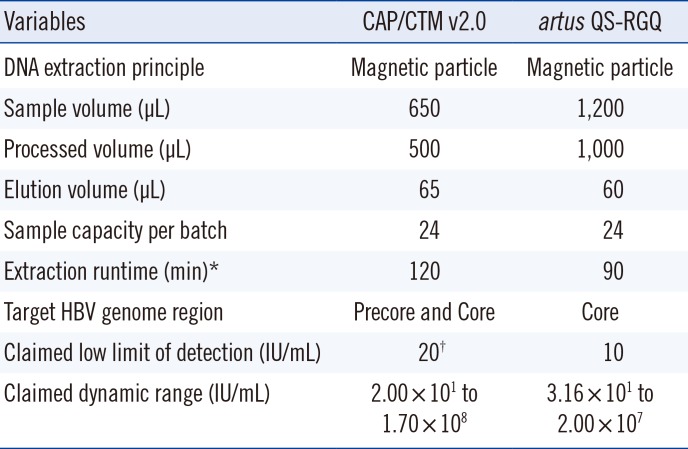
Table 1
Comparison between the characteristics of two Hepatitis B virus (HBV) DNA quantification assays
![]()
3. Interpretative criteria of HBV DNA viral load
The qualitative results were interpreted as “Detected” or “Not detected” on the basis of each claimed LOD. The quantitative results were included for further analysis, only if exceeding the limit of quantification (LOQ), i.e. above 20.0 IU/mL (CAP/CTM v2.0) and 31.6 IU/mL (artus QS-RGQ).
4. Serologic CHB assay
The HBeAg status was simultaneously evaluated by the Architect i2000SR analyzer (Abbott Diagnostics, Abbott Park, IL, USA) using a chemiluminescent microparticle immunoassay in clinical samples before frozen storage. According to HBeAg-negative or -positive status, the differences in viral loads detected by the assays were determined.
5. Performance characteristics of the artus QS-RGQ assay
The second WHO international standard for HBV DNA (NIBSC code 97/750, 1×10⁶ IU/mL) and clinical samples with high viral load were serially diluted with human serum matrix. The precision performances near the two clinically important levels (low: 2,000 IU/mL; high: 20,000 IU/mL) were evaluated in four replicates over five days using clinical samples. To evaluate linearity, serial dilutions of the WHO standard (20 to 105 IU/mL) and clinical samples (10 to 107 IU/mL) were simultaneously tested in two to four replicate measurements. The diluted WHO standard materials of 1, 2.5, 5, 10, and 20 IU/mL were tested in 12 replicates to determine the LOD.
6. Statistical analysis
Data was analyzed by using Analyse-it Method Evaluation Edition, version 3.76 software (Analyse-it Software Ltd., Leeds, UK) and IBM SPSS Statistics 22 (International Business Machines Corp., Armonk, NY, USA). The method comparisons were performed by the Kappa test and Pearson Chi-squared test for qualitative results, and the Spearman's test and Passing-Bablok regression for quantitative results. The differences between two methods were presented in a Bland-Altman plot. Linear regression analysis and Probit analysis were used for verification of the artus QS-RGQ assay performance. The P values <0.05 were considered significant.
Go to :
RESULTS
1. Agreement and correlation between the two assays
Among the 508 serum samples tested, HBV DNA was quantified in 308 samples (60.6%) by the CAP/CTM v2.0 assay, and 268 (52.8%) were quantified by the artus QS-RGQ assay. The detection rate by the artus QS-RGQ assay was significantly lower than that by the CAP/CTM v2.0 assay (P<0.0001). The kappa coefficient between the qualitative results of the two assays was 0.79 (95% confidence interval [CI]=0.74 to 0.85). By both assays (Table 2), 229 (45.1%) samples were detected and 196 (38.6%) samples were not detected. However, the CAP/CTM v2.0 assay detected HBV viral load in 46 (9.1%) samples whereas the artus QS-RGQ did not detect HBV viral load. Conversely, the artus QS-RGQ assay detected six (1.2%) positive samples but not CAP/CTM v2.0. Overall, 12 samples with ≥20,000 IU/mL and 29 with 2,000 to 20,000 IU/mL, based on the result from CAP/CTM v2.0 assay, were quantified as lower viral loads by the artus QS-RGQ assay. Inversely, one sample (4,230 IU/mL) among the results from artus QS-RGQ assay was measured as a lower level by the CAP/CTM v2.0 assay (755 IU/mL).
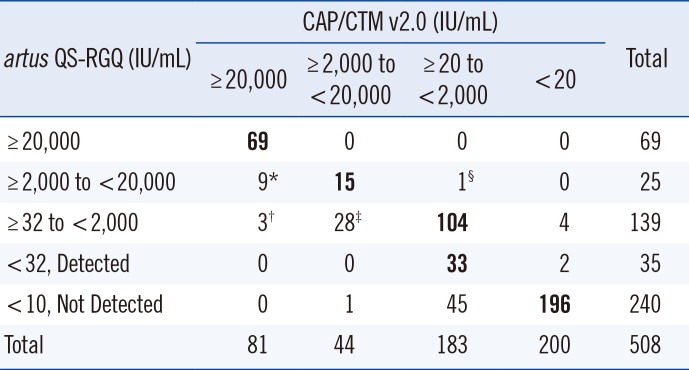
Table 2
Comparison of viral load results in 508 clinical samples using the CAP/CTM v2.0 and artus QS-RGQ assays (N)
Hepatitis B virus DNA levels described below are shown as median (1st to 3rd quartiles) (IU/mL) obtained by the artus QS-RGQ and CAP/CTM v2.0, respectively: *7,280 (3,324−10,500) vs 92,189 (34,467–145,000), †1,602 (1,482–1,700) vs 41,200 (29,133–57,717), ‡812 (437–1,124) vs 6,162 (2,752–6,848), §4,230 vs 755.
![]()
The mean±SD of HBV DNA was 4.18±1.89 IU/mL for the CAP/CTM v2.0 assay and 3.55±1.77 IU/mL for the artus QS-RGQ assay. The viral loads quantified by artus QS-RGQ assay were significantly lower than those quantified by the CAP/CTM v2.0 assay (P<0.0001). Further, 38 (7.5%) samples showed significant difference of ≥1 log10 IU/mL.
Both assays quantified 105 (20.7%) samples with an HBV DNA level <2,000 IU/mL (3.30 log10 IU/mL) and showed fair correlation (r=0.49; 95% CI, 0.33 to 0.63; P<0.0001). Of samples detected by both assays, Passing-Bablok regression analysis and Bland-Altman plot are shown in Fig. 1A and Fig. 1B, respectively.
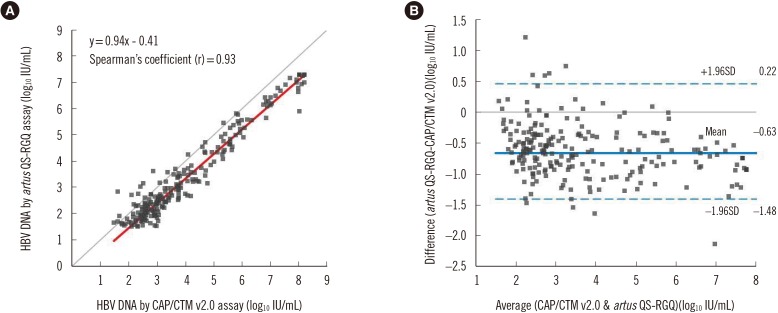 | Fig. 1Comparison of Hepatitis B virus (HBV) DNA levels in clinical samples between CAP/CTM v2.0 and artus QS-RGQ assays (N=229). (A) The Passing-Bablok equation (95% CI of intercept: −0.52 to −0.27, slope: 0.92 to 0.0.96, r=0.91 to 0.95). (B) The mean difference (QS/RGQ-CAP/CTM) in Bland-Altman plot was −0.63±0.85 log10 IU/mL.
|
Of the 508 study samples, 177 samples were evaluated by the HBeAg assay, which found 106 HBeAg-negative and 71 HBeAg-positive samples. The CAP/CTM assay detected 63 samples (59.4%) and 53 samples (74.6%), meanwhile the artus QS-RGQ assay detected 53 samples (50.0%) and 50 samples (70.4%) that were HBeAg-negative and HBeAg-positive, respectively. The tendency for viral load difference between the two assays was consistent regardless of HBeAg negativity or positivity. However, the viral load (mean±SD) in the HBeAg-negative group was lower than that in the HBeAg-positive group in both assays (3.97±0.25 vs 5.25±0.34 for CAP/CTM assay, P<0.0001; 3.35±0.24 vs 4.60±0.31 for artus QS-RGQ assay, P<0.0001).
2. Performance characteristics of the artus QS-RGQ assay
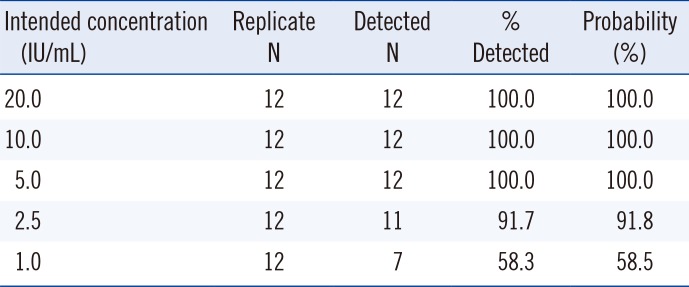
The mean levels and total % CV for the artus QS-RGQ assay at two clinically important HBV DNA levels (target levels), i.e. 3.30 log10 IU/mL (2,000 IU/mL) and 4.30 log10 IU/mL (20,000 IU/mL), were 3.29 log10 IU/mL and 4.31 log10 IU/mL, and 1.1% and 1.4%, respectively (Table 3). The linearity of the artus QS-RGQ assay was verified in the claimed linear range for each HBV DNA level of the WHO standard (ranged 1.30 to 5.00 log10 IU/mL, y=0.94x + 0.28, r=0.995) and clinical samples (ranged 1.00 to 7.00 log10 IU/mL, y=0.97x + 0.10, r=0.997) (Table 4). Unlike results for the WHO standard, the artus QS-RGQ assay showed less than 100% recovery at >102 IU/mL viral loads and increased % CV at 2.00 log10 IU/mL in clinical samples. The probit analysis for the artus QS-RGQ assay resulted in an LOD of 2.95 IU/mL (Table 5).
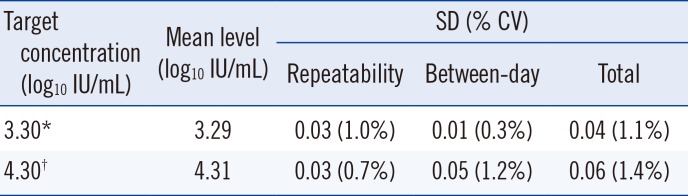
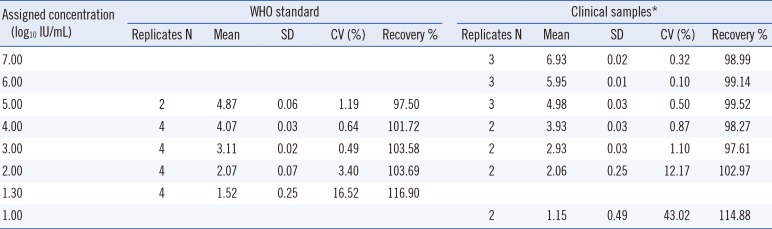
Table 3
Precision performance of the artus QS-RGQ assay
| Target concentration (log10 IU/mL) | Mean level (log10 IU/mL) | SD (% CV) | ||
|---|---|---|---|---|
| Repeatability | Between-day | Total | ||
| 3.30* | 3.29 | 0.03 (1.0%) | 0.01 (0.3%) | 0.04 (1.1%) |
| 4.30† | 4.31 | 0.03 (0.7%) | 0.05 (1.2%) | 0.06 (1.4%) |
![]()
Table 4
Linearity of the artus QS-RGQ assay for WHO standard and clinical samples
![]()
Go to :
DISCUSSION
CHB is a major cause of cirrhosis and hepatocellular carcinoma in Southeast Asia, China, and Africa [16]. HBV DNA quantification is essential for monitoring disease status and treatment response in CHB patients. Until now, several commercially available real-time PCR assays for this have been developed. Newly launched artus QS-RGQ assay suggested a lower LOD, higher sample volume, and higher LOQ than CAP/CTM v2.0 assay by manufacturer. This new assay has not been researched enough about its performance, except for two abstracts with plasma samples [1112]. Brichler et al [11] reported good correlation and agreement (r2=0.89, mean difference=0.1 log10 IU/mL) between the new assay and CAP/CTM v2.0 assay. However, 23% of the 230 samples showed more than ±0.5 log10 IU/mL difference range, and the HBV DNA levels by the artus QS-RGQ assay were lower than the results by the CAP/CTM v2.0 assay in their study (P value is not shown). Fielder et al [12] suggested that new assay showed detection capability of all eight genotypes, no cross-reactivity with 30 different pathogens and low LOD of 4.1 IU/mL.
In our study, there were significant differences between the CAP/CTM v2.0 and the artus QS-RGQ assays in the detection rate and viral load when quantifying HBV DNA levels in clinical serum samples, even though good correlation was observed (r= 0.93). The HBV DNA levels determined by the artus QS-RGQ assay were substantially lower than the results by the CAP/CTM v2.0 assay. In addition, the correlation between the results of the two assays in low viral load samples (<2,000 IU/mL) was not as strong as the correlation for all samples (r=0.49). According to the manufacturer's protocol, the LOD of the artus QS-RGQ assay (10 IU/mL) is lower than that of the CAP/CTM v2.0 assay (20 IU/mL). However, our results from the artus QS-RGQ assay showed a lower positive rate than those from the CAP/CTM v2.0. Hence, discrepancies between the assays were observed when sample results were plotted against important HBV DNA target levels for clinical management points and each claimed LOD and LOQ (Table 2). These discrepancies may result in different classifications of inactive HBsAg carriers and active CHB patients, and may even change CHB management strategy.
There are several possible factors that may lead to assay discrepancies. Yeh et al [10] showed that the B genotype and low HBV viral load were two factors that contribute to significant differences in HBV DNA viral load detection, i.e. ≥1 log10 IU/mL, when comparing the CAP/CTM v2.0 assay with the Real-Time HBV assay (Abbott Laboratories, Abbott Park, IL, USA). When Ismail et al [9] evaluated the Abbott RealTime HBV assay and artus assays on two different platforms, the two artus assays showed low quantitative values in comparison with the RealTime assay, especially in samples with low viral load. In our study, the artus QS-RGQ assay also determined relatively lower viral loads than other assays, especially in samples with low viral load (≤2,000 IU/mL).
Mutations in precore and core promoter regions may occur as CHB progresses [17]. These mutations may influence the result of HBV DNA quantification [1819]. Yeh et al [19] concluded that the detection difference between the CAP/CTM v2.0 and Abbott Real-Time assays in low viral load samples may be influenced by the tyrosine-methionine-aspartate-aspartate (YMDD) mutation, which confers lamivudine resistance. Because of sample volume limitations, we could not genotype our samples, but almost all HBV genotypes are reported as genotype C in Korea, and mutations in the core promoter are more prevalent than mutations in the precore region. Moreover, two mutations are often associated with HBeAg-negative results or reduced HBeAg production [2021]. Thus, detection sensitivity for HBV mutants in the common target region may differ depending on the assay. However, no additional study was performed to identify HBV genotype and mutation of precore and core regions due to insufficient sample volume and the retrospective study design that utilized reserved samples. Finally, the artus QS-RGQ assay showed less reliable performance in clinical serum samples than in the WHO standard samples. This discrepancy may be due to the sample type. The QS-RGQ assay recommends the use of plasma samples only, while other manufacturers adopt both sample types, i.e. plasma or serum.
Our study has limitations because this study examined stored clinical samples to evaluate the newly launched reagents in a clinical laboratory. A well-designed prospective study with freshly drawn blood samples is preferable according to the manufacturer; however, in this case, we retrospectively studied stored samples to determine whether to adopt a clinical test.
In conclusion, the newly launched artus QS-RGQ assay displayed good precision at important HBV DNA target levels, linearity over clinically significant ranges, and an acceptable LOD. However, this assay showed a significantly decreased detection rate and viral load compared with results of the CAP/CTM v2.0 assay in serum samples, especially in samples with low viral load. However, this assay recommends plasma only as the sample type. Thus, careful consideration of sample type and sample volume is necessary when evaluating the relevance of these results to determine the clinical application of the QS-RGQ assay.
Go to :
 XML Download