This article has been
cited by other articles in ScienceCentral.
Abstract
Background
Medical laboratories play a central role in health care. Many laboratories are taking a more focused and stringent approach to quality system management. In Korea, laboratory standardization efforts undertaken by the Korean Laboratory Accreditation Program (KLAP) and the Korean External Quality Assessment Scheme (KEQAS) may have facilitated an improvement in laboratory performance, but there are no fundamental studies demonstrating that laboratory standardization is effective. We analyzed the results of the KEQAS to identify significant differences between laboratories with or without KLAP and to determine the impact of laboratory standardization on the accuracy of diagnostic tests.
Methods
We analyzed KEQAS participant data on clinical chemistry tests such as albumin, ALT, AST, and glucose from 2010 to 2013. As a statistical parameter to assess performance bias between laboratories, we compared 4-yr variance index score (VIS) between the two groups with or without KLAP.
Results
Compared with the group without KLAP, the group with KLAP exhibited significantly lower geometric means of 4-yr VIS for all clinical chemistry tests (P<0.0001); this difference justified a high level of confidence in standardized services provided by accredited laboratories. Confidence intervals for the mean of each test in the two groups (accredited and non-accredited) did not overlap, suggesting that the means of the groups are significantly different.
Conclusions
These results confirmed that practice standardization is strongly associated with the accuracy of test results. Our study emphasizes the necessity of establishing a system for standardization of diagnostic testing.
Keywords: The Korean Association of External Quality Assessment Service, The Korean External Quality Assessment Scheme, Quality assurance, Quality system management, Standardization, Accuracy
INTRODUCTION
Medical laboratories play a central role in health care. Laboratory data are an integral part of physicians' decision-making processes; 70% of all critical medical decisions are based on laboratory test results [
1]. The purpose of a laboratory is to provide physicians and other health care professionals with information that enables them to: (1) detect a disease or predisposition to a disease, (2) confirm or reject a diagnosis, (3) establish prognosis, (4) guide patient management, and (5) monitor the efficacy of therapy. To successfully achieve these goals, every laboratory should strive to achieve medical, scientific, and technical expertise, obtain resources such as personnel, laboratory equipment, supplies, and facilities, and, most importantly, have a management set-up that ensures quality laboratory services.
Many laboratories are adopting a more focused and stringent approach to quality system management. The International Organization for Standardization (ISO) is the first quality management system for medical laboratories. It establishes guidelines that reflect the highest level of quality [
2]. The ISO 15189 has been adopted by the College of American Pathologists (CAP) in an effort to improve patient care through quality laboratory practices [
3]. Similarly, the CLSI has developed 12 Quality System Essentials based on ISO standards. These 12 essentials serve as a starting point in establishing a quality system that covers pre-testing, testing, and post-testing operations [
3]. In the United States, laboratory activities are highly regulated by healthcare-related legislation such as the Clinical Laboratory Improvement Amendments (CLIA) of 1988 [
4]. Most clinical laboratories in the United States have received CLIA certification to perform testing on human samples, which indicates that they meet personnel, operational, safety, and quality standards based on test complexity.
In Korea, no national regulatory standards have been developed for clinical laboratories. The standardization of laboratory practice depends on a private sector entity, the Korean Laboratory Accreditation Program (KLAP), and the Korean External Quality Assessment Scheme (KEQAS) [
56]. The KLAP was developed by the Korean Society of Laboratory Medicine in 1999, and was reorganized as the Laboratory Medicine Foundation in 2010 [
6]. A laboratory that meets the requirements of laboratory accreditation schemes can receive KLAP certification, which expresses confidence in the quality of services provided by that laboratory [
6]. The KEQAS was set up in 1976, and is currently run by the Korean Association of External Quality Assessment Service. The main objectives of the KEQAS are to compare test results among participating laboratories nationwide by using the same test item. The number of participants in the KEQAS is gradually increasing [
5].
The standardization efforts undertaken by the KLAP and KEQAS may have facilitated an improvement in laboratory performance in Korea; however, there are no fundamental studies demonstrating that laboratory standardization is useful. We analyzed the results of the KEQAS to identify significant differences between laboratories with and without KLAP, and to determine the impact of laboratory practice standardization on the accuracy of diagnostic testing.
METHODS
1. Study subjects and parameters
Data from the KEQAS gathered between 2010 and 2013 by the clinical chemistry subcommittee of the Korean Association of External Quality Assessment Service were included in this study. A total of 19 test items related to clinical chemistry were analyzed: albumin, alkaline phosphatase, ALT, AST, blood urea nitrogen, chloride, creatinine, γ-glutamyl transferase, glucose, lactate dehydrogenase, phosphorus, potassium, sodium, total bilirubin, total calcium, total cholesterol, total protein, triglyceride, and uric acid [
7]. As a statistical parameter to assess bias in performance between laboratories, we used the variance index score (VIS). The VIS ranges from 0 to 400, and it provides an overall comparison of test results for each test item. The value of the VIS is calculated as follows: VIS=[(X
lab–DV)/DV×100]/CCV×100; where X
lab is the result from the participating laboratory; DV is the designated value, which is the mean result from the participating laboratories using that method after excluding outliers more than two standard deviations from the mean; and CCV is the chosen coefficient of variation, taken from the National External Quality Assessment Scheme in the United Kingdom (1971) [
8].
2. Comparison of 4-yr VIS between laboratories with or without KLAP
KEQAS participants, whose data on clinical chemistry tests were available, were categorized into two subgroups based on their KLAP status, and the VIS of each test item from 2010–2013 was compared. The number of laboratories participating in the KEQAS was 1,333 in 2013 [
7]. Among the KEQAS participants with available data, the number of laboratories with or without KLAP, by year, was 233/767 (23% accredited; 77% non-accredited) in 2010, 245/844 (22% accredited; 78% non-accredited) in 2011, 258/908 (22% accredited; 78% non-accredited) in 2012, and 265/1,008 (21% accredited; 79% non-accredited) in 2013.
3. Comparison of 4-yr VIS between laboratories categorized by institution type
All participants in the KEQAS were categorized into four laboratory subgroups based on the institutional type; these subgroups were general hospitals with 100 or more beds, hospitals with 30–99 beds, clinics with less than 30 beds, and entrusted laboratory agencies. During 2010–2013, the number of laboratories in general hospitals varied between 321 and 356; the number of laboratories in hospitals varied between 314 and 453; the number of laboratories in clinics varied between 272 and 351; and the number laboratories in entrusted laboratory agencies varied between 11 and 15. We analyzed the VIS difference in each test by institutional type. Furthermore, we analyzed the difference in VIS between laboratories in general hospitals based on their KLAP status to rule out confounding factors such as personnel, laboratory equipment, supplies, and facilities. These factors are likely to affect the value of the VIS, because the hospital and clinic institutional types had a very small number of KLAP-accredited laboratories. Therefore, only data from the general hospital group, which had a sufficient number of laboratories with or without KLAP spanning, were included in further analysis.
4. Statistical analysis
VIS differences between laboratories with or without KLAP were compared by Student's t-test. One-way ANOVA followed by Tukey's multiple comparison test was used to evaluate the statistical significance of the differences among the institutional types. Logarithmic transformation of VIS was performed because of its right skewed distribution. The values of VIS were reported as the geometric mean with 95% confidence intervals. P values were based on two-sided comparisons, and P values<0.05 were considered statistically significant.
RESULTS
1. Differences in the VIS between laboratories with or without KLAP
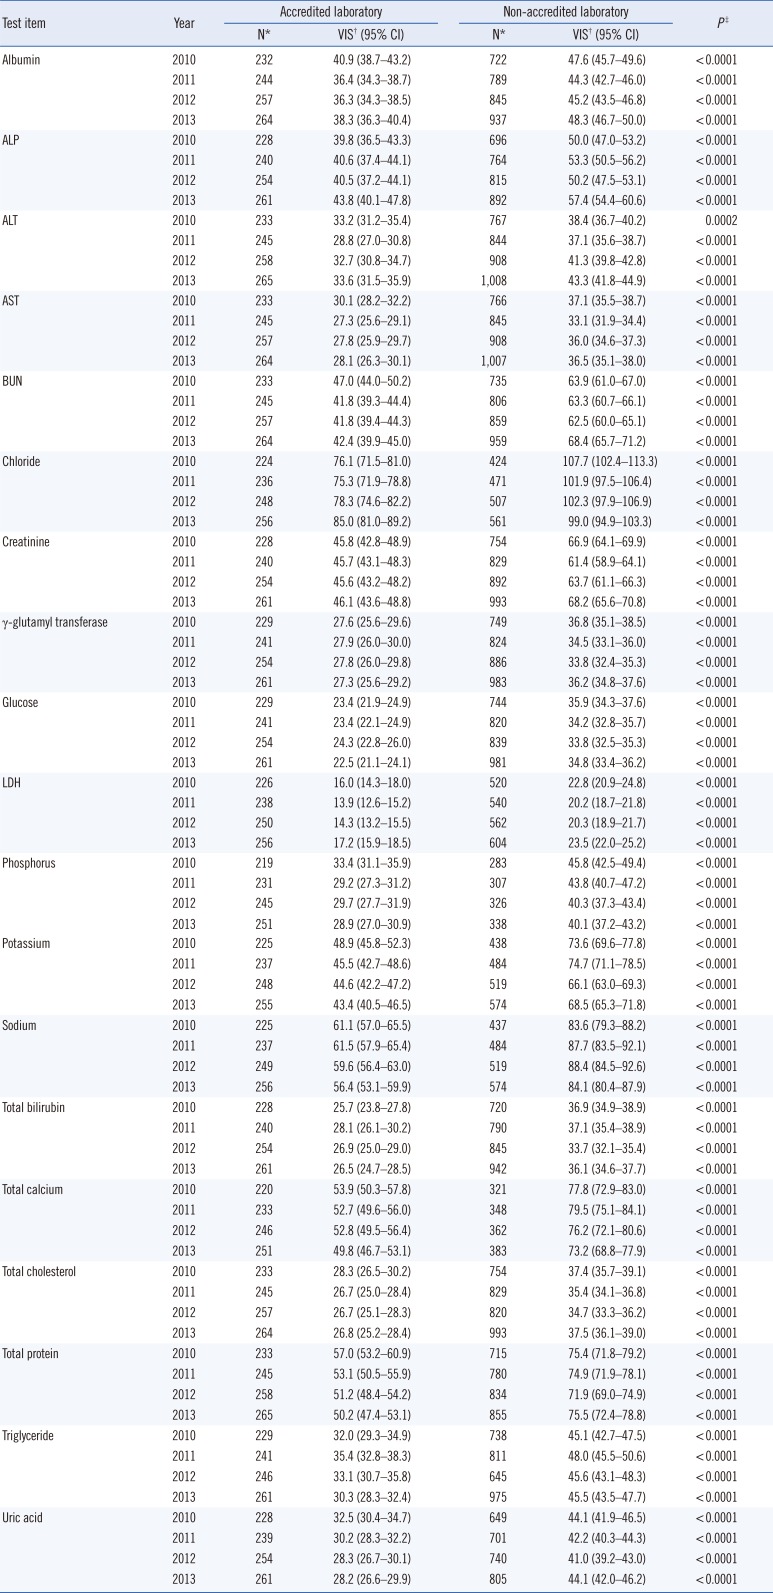
Statistical data on VIS, by test, are listed in
Table 1. Most of the VIS data received scores of less than 100, except for a chloride test result from laboratories without KLAP (107.7 in 2010, 101.9 in 2011, and 102.3 in 2012). Relative to the group of laboratories without KLAP, the group of laboratories with KLAP exhibited significantly lower geometric means of 4-yr VIS in all tests (
P<0.0001). Confidence intervals for the mean of each test item in the two groups (accredited and non-accredited) did not overlap; this gap suggested that the means of the two groups were significantly different (
Table 1). The geometric means of VIS in 2013 are shown in
Fig. 1.
2. Differences in the VIS between laboratories categorized by institution type
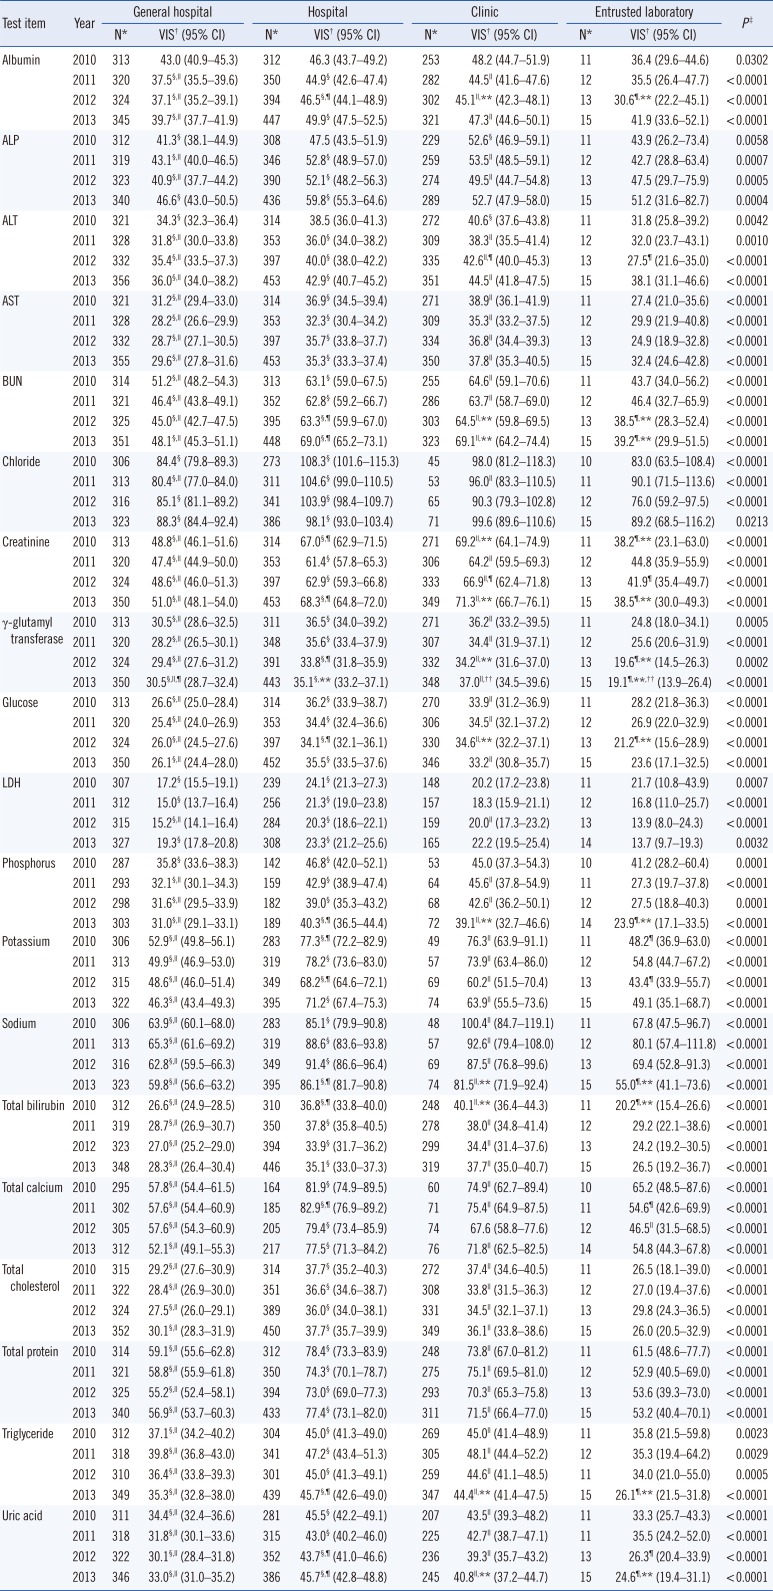
Laboratories in general hospitals and entrusted laboratory agencies exhibited significantly lower geometric means of 4-yr VIS for all test items compared with that of laboratories in hospitals and clinics (
P<0.0001) (
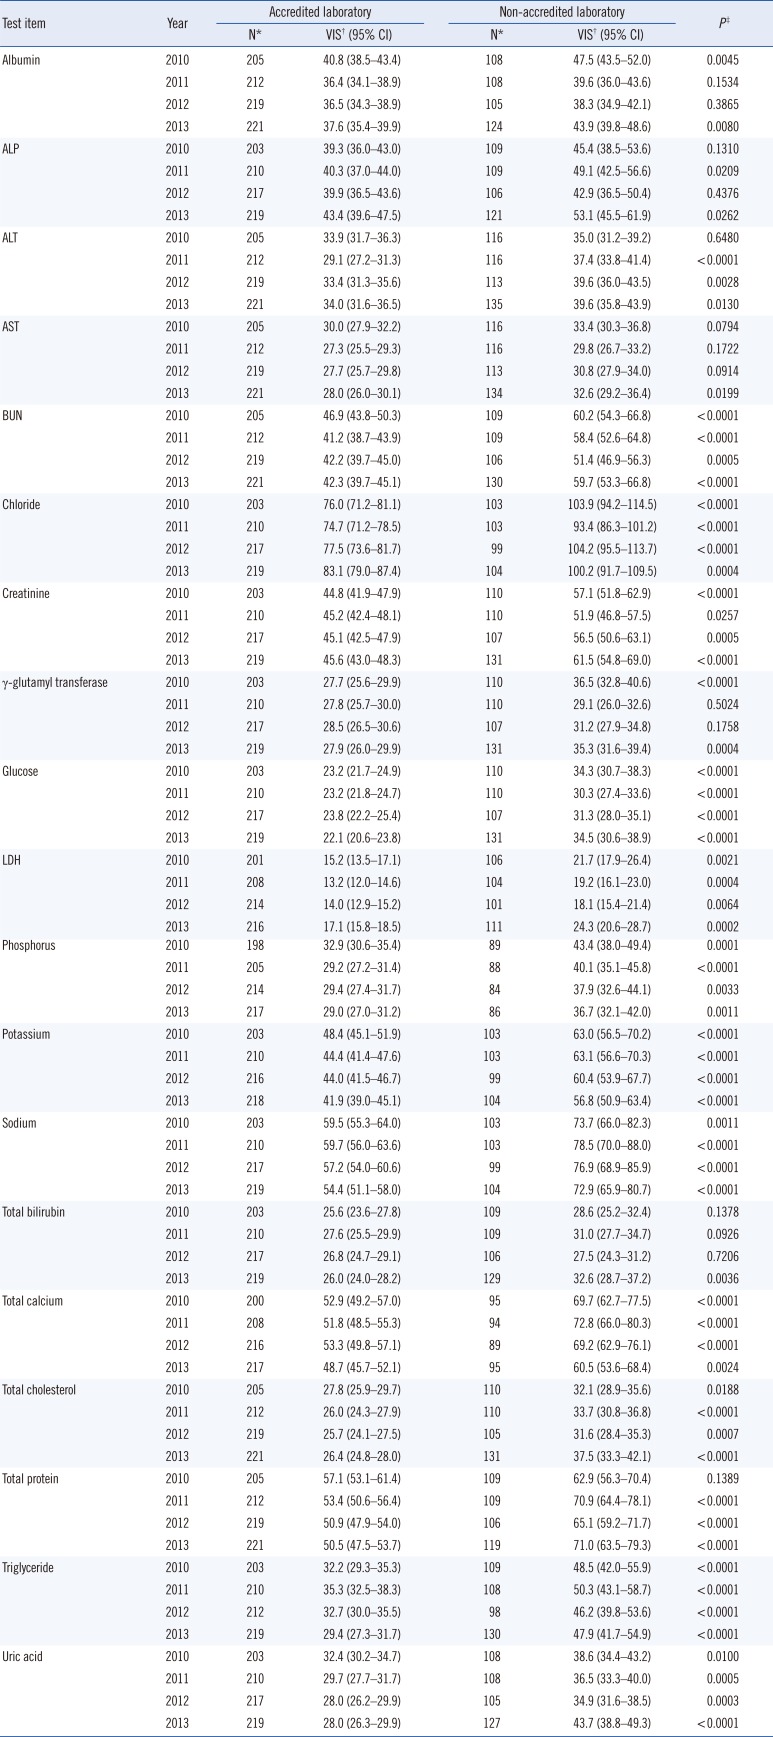
Table 2). The laboratories in general hospitals were further classified into two subgroups based on their KLAP status; the numbers in the accredited and non-accredited groups were 205 (64%) and 116 (36%) in 2010, 212 (65%) and 116 (35%) in 2011, 219 (66%) and 113 (34%) in 2012, and 221 (62%) and 135 (38%) in 2013, respectively. Among the laboratories in general hospitals, the means of 4-yr VIS in laboratories with KLAP were significantly lower than those in laboratories without KLAP for blood urea nitrogen, chloride, creatinine, glucose, lactate dehydrogenase, phosphorus, potassium, sodium, total calcium, total cholesterol, triglyceride, and uric acid (
Table 3).
DISCUSSION
The major finding of this study is that the 4-yr VIS was significantly different between laboratories with or without KLAP. The VIS scores in KLAP-accredited laboratories were significantly lower than those in laboratories without KLAP for all clinical chemistry tests; this difference justifies a high level of confidence in standardized services provided by accredited laboratories. The present study is the first to demonstrate a strong impact of practice standardization on the accuracy of test results.
Implementation of laboratory standards is verified through the process of accreditation. In many countries, accreditation of medical laboratories has been established for several decades [
9101112]. Accredited medical laboratories should have a well-functioning quality management system, demonstrate technical competence, and provide timely and customer-focused services that contribute to patient care. Our observation of a lower VIS in KLAP-accredited laboratories suggests that the KLAP assesses laboratories in accordance with the accepted standards. This finding provides external validation that KLAP-accredited laboratory services are accurate, traceable, and reproducible.
Clinical laboratories must provide high-quality services by producing accurate, precise, relevant, and comprehensive data, which have a direct impact on the medical management of patients [
1]. Enhancement of the quality of laboratory services involves laboratory quality management plans, including pre-analytic, analytic, and post-analytic plans, and standardization of activities and practices. A lack of standardization makes it impossible to guarantee the reliability or accuracy of laboratory test results, which increases the error rate and endangers patient safety [
13]. Laboratory standards critical to patient safety include proficiency testing, laboratory accreditation, continuing education, safety goals, health information technology use, and electronic records. Therefore, accreditation bodies, consisting of independent entities as well as government authorities, should work to improve the quality of laboratory practices and patient safety.
We used the VIS statistical parameter, obtained from the KEQAS, to assess the standardized performance of different laboratories. One could argue that the parameter accurately reflects laboratory standardization, because the KEQAS is run by a voluntary organization, and not government authorities. However, the KEQAS has great value in quality assessment, allowing a laboratory to confirm that its results are consistent with those of other laboratories using the same or similar methods, and thus to confirm that it is correctly following the methods [
14]. It is also important for maintaining long-term accuracy of analytical methods, and thus, it was chosen as a parameter to assess the effect of standardization.
In conclusion, our investigation of the KEQAS data confirmed that practice standardization is strongly associated with the accuracy of test results. Our analysis emphasizes the necessity of establishing a system for providing standardized diagnostic testing.
Acknowledgments
We thank the Korean Association of External Quality Assessment Service and the Laboratory Medicine Foundation for providing the data used in this study. This work was supported by the Soonchunhyang University Research Fund, and by the Korea Centers for Disease Control and Prevention, Korea (2014-187).
References
1. Forsman RW. Why is the laboratory an afterthought for managed care organizations? Clin Chem. 1996; 42:813–816. PMID:
8653920.
2. Burnett D. ISO 15189:2003--quality management, evaluation and continual improvement. Clin Chem Lab Med. 2006; 44:733–739. PMID:
16729862.
3. McPherson RA, Pincus MR, editors. Henry's clinical diagnosis and management by laboratory methods. 23th ed. St. Louis, MO: Elsevier;2017. p. 2–5.
4. Medicare, Medicaid and CLIA programs; regulations implementing the Clinical Laboratory Improvement Amendments of 1988 (CLIA)--HCFA. Final rule with comment period. Fed Regist. 1992; 57:7002–7186. PMID:
10170937.
5. Cho HI. Twenty-years of experiences in external quality assurance in Korea. Southeast Asian J Trop Med Public Health. 1999; 30(S3):32–38.
6. Shin BM, Chae SL, Min WK, Lee WG, Lim YA, Lee DH, et al. The implementation and effects of a clinical laboratory accreditation program in Korea from 1999 to 2006. Korean J Lab Med. 2009; 29:163–170. PMID:
19411785.
7. Jun SH, Song J. Annual Report on the External Quality Assessment Scheme in Clinical Chemistry in Korea (2013). J Lab Med Qual Assur. 2014; 36:113–121.
8. Whitehead TP, Woodford FP. External quality assessment of clinical laboratories in the United Kingdom. J Clin Pathol. 1981; 34:947–957. PMID:
7024326.
9. Huisman W, Horvath AR, Burnett D, Blaton V, Czikkely R, Jansen RT, et al. Accreditation of medical laboratories in the European Union. Clin Chem Lab Med. 2007; 45:268–275. PMID:
17311523.
10. Guzel O, Guner EI. ISO 15189 accreditation: Requirements for quality and competence of medical laboratories, experience of a laboratory I. Clin Biochem. 2009; 42:274–278. PMID:
19863920.
11. Kibet E, Moloo Z, Ojwang PJ, Sayed S, Mbuthia A, Adam RD. Measurement of improvement achieved by participation in international laboratory accreditation in sub-Saharan Africa: the Aga Khan University Hospital Nairobi experience. Am J Clin Pathol. 2014; 141:188–195. PMID:
24436265.
12. Gershy-Damet GM, Rotz P, Cross D, Belabbes el H, Cham F, Ndihokubwayo JB, et al. The World Health Organization African region laboratory accreditation process: improving the quality of laboratory systems in the African region. Am J Clin Pathol. 2010; 134:393–400. PMID:
20716795.
13. Sciacovelli L, Plebani M. The IFCC Working Group on laboratory errors and patient safety. Clin Chim Acta. 2009; 404:79–85. PMID:
19328194.
14. Jamtsho R, Nuchpramool W. Implementation of External Quality Assessment Scheme in clinical chemistry for district laboratories in Bhutan. Indian J Clin Biochem. 2012; 27:300–305. PMID:
26405392.
Fig. 1
Comparison of geometric means of the variance index score (VIS) for clinical chemistry tests between laboratories with or without KLAP in 2013. The 95% confidence intervals for the mean of each test in the two groups did not overlap. (A) VIS<50 and (B) VIS: 50–100. The graph shows the clinical chemistry tests on the X-axis and the geometric means of the VIS on the Y-axis.
Abbreviations: BUN, blood urea nitrogen; KLAP, Korean Laboratory Accreditation Program; γ-GT, γ-glutamyl transferase; VIS, variance index score.
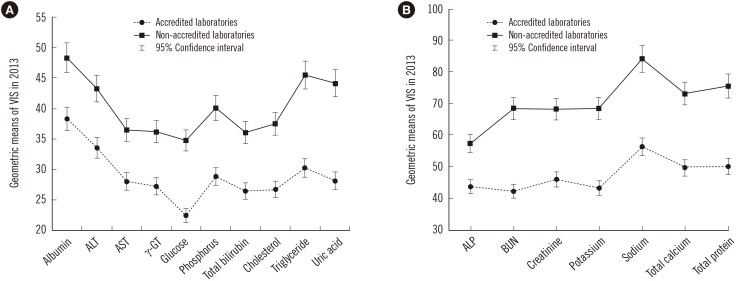
Table 1
Comparison of variance index scores between laboratories with or without KLAP from 2010 to 2013
|
Test item |
Year |
Accredited laboratory |
Non-accredited laboratory |
P‡
|
|
N*
|
VIS† (95% CI) |
N*
|
VIS† (95% CI) |
|
Albumin |
2010 |
232 |
40.9 (38.7–43.2) |
722 |
47.6 (45.7–49.6) |
< 0.0001 |
|
2011 |
244 |
36.4 (34.3–38.7) |
789 |
44.3 (42.7–46.0) |
< 0.0001 |
|
2012 |
257 |
36.3 (34.3–38.5) |
845 |
45.2 (43.5–46.8) |
< 0.0001 |
|
2013 |
264 |
38.3 (36.3–40.4) |
937 |
48.3 (46.7–50.0) |
< 0.0001 |
|
ALP |
2010 |
228 |
39.8 (36.5–43.3) |
696 |
50.0 (47.0–53.2) |
< 0.0001 |
|
2011 |
240 |
40.6 (37.4–44.1) |
764 |
53.3 (50.5–56.2) |
< 0.0001 |
|
2012 |
254 |
40.5 (37.2–44.1) |
815 |
50.2 (47.5–53.1) |
< 0.0001 |
|
2013 |
261 |
43.8 (40.1–47.8) |
892 |
57.4 (54.4–60.6) |
< 0.0001 |
|
ALT |
2010 |
233 |
33.2 (31.2–35.4) |
767 |
38.4 (36.7–40.2) |
0.0002 |
|
2011 |
245 |
28.8 (27.0–30.8) |
844 |
37.1 (35.6–38.7) |
< 0.0001 |
|
2012 |
258 |
32.7 (30.8–34.7) |
908 |
41.3 (39.8–42.8) |
< 0.0001 |
|
2013 |
265 |
33.6 (31.5–35.9) |
1,008 |
43.3 (41.8–44.9) |
< 0.0001 |
|
AST |
2010 |
233 |
30.1 (28.2–32.2) |
766 |
37.1 (35.5–38.7) |
< 0.0001 |
|
2011 |
245 |
27.3 (25.6–29.1) |
845 |
33.1 (31.9–34.4) |
< 0.0001 |
|
2012 |
257 |
27.8 (25.9–29.7) |
908 |
36.0 (34.6–37.3) |
< 0.0001 |
|
2013 |
264 |
28.1 (26.3–30.1) |
1,007 |
36.5 (35.1–38.0) |
< 0.0001 |
|
BUN |
2010 |
233 |
47.0 (44.0–50.2) |
735 |
63.9 (61.0–67.0) |
< 0.0001 |
|
2011 |
245 |
41.8 (39.3–44.4) |
806 |
63.3 (60.7–66.1) |
< 0.0001 |
|
2012 |
257 |
41.8 (39.4–44.3) |
859 |
62.5 (60.0–65.1) |
< 0.0001 |
|
2013 |
264 |
42.4 (39.9–45.0) |
959 |
68.4 (65.7–71.2) |
< 0.0001 |
|
Chloride |
2010 |
224 |
76.1 (71.5–81.0) |
424 |
107.7 (102.4–113.3) |
< 0.0001 |
|
2011 |
236 |
75.3 (71.9–78.8) |
471 |
101.9 (97.5–106.4) |
< 0.0001 |
|
2012 |
248 |
78.3 (74.6–82.2) |
507 |
102.3 (97.9–106.9) |
< 0.0001 |
|
2013 |
256 |
85.0 (81.0–89.2) |
561 |
99.0 (94.9–103.3) |
< 0.0001 |
|
Creatinine |
2010 |
228 |
45.8 (42.8–48.9) |
754 |
66.9 (64.1–69.9) |
< 0.0001 |
|
2011 |
240 |
45.7 (43.1–48.3) |
829 |
61.4 (58.9–64.1) |
< 0.0001 |
|
2012 |
254 |
45.6 (43.2–48.2) |
892 |
63.7 (61.1–66.3) |
< 0.0001 |
|
2013 |
261 |
46.1 (43.6–48.8) |
993 |
68.2 (65.6–70.8) |
< 0.0001 |
|
γ-glutamyl transferase |
2010 |
229 |
27.6 (25.6–29.6) |
749 |
36.8 (35.1–38.5) |
< 0.0001 |
|
2011 |
241 |
27.9 (26.0–30.0) |
824 |
34.5 (33.1–36.0) |
< 0.0001 |
|
2012 |
254 |
27.8 (26.0–29.8) |
886 |
33.8 (32.4–35.3) |
< 0.0001 |
|
2013 |
261 |
27.3 (25.6–29.2) |
983 |
36.2 (34.8–37.6) |
< 0.0001 |
|
Glucose |
2010 |
229 |
23.4 (21.9–24.9) |
744 |
35.9 (34.3–37.6) |
< 0.0001 |
|
2011 |
241 |
23.4 (22.1–24.9) |
820 |
34.2 (32.8–35.7) |
< 0.0001 |
|
2012 |
254 |
24.3 (22.8–26.0) |
839 |
33.8 (32.5–35.3) |
< 0.0001 |
|
2013 |
261 |
22.5 (21.1–24.1) |
981 |
34.8 (33.4–36.2) |
< 0.0001 |
|
LDH |
2010 |
226 |
16.0 (14.3–18.0) |
520 |
22.8 (20.9–24.8) |
< 0.0001 |
|
2011 |
238 |
13.9 (12.6–15.2) |
540 |
20.2 (18.7–21.8) |
< 0.0001 |
|
2012 |
250 |
14.3 (13.2–15.5) |
562 |
20.3 (18.9–21.7) |
< 0.0001 |
|
2013 |
256 |
17.2 (15.9–18.5) |
604 |
23.5 (22.0–25.2) |
< 0.0001 |
|
Phosphorus |
2010 |
219 |
33.4 (31.1–35.9) |
283 |
45.8 (42.5–49.4) |
< 0.0001 |
|
2011 |
231 |
29.2 (27.3–31.2) |
307 |
43.8 (40.7–47.2) |
< 0.0001 |
|
2012 |
245 |
29.7 (27.7–31.9) |
326 |
40.3 (37.3–43.4) |
< 0.0001 |
|
2013 |
251 |
28.9 (27.0–30.9) |
338 |
40.1 (37.2–43.2) |
< 0.0001 |
|
Potassium |
2010 |
225 |
48.9 (45.8–52.3) |
438 |
73.6 (69.6–77.8) |
< 0.0001 |
|
2011 |
237 |
45.5 (42.7–48.6) |
484 |
74.7 (71.1–78.5) |
< 0.0001 |
|
2012 |
248 |
44.6 (42.2–47.2) |
519 |
66.1 (63.0–69.3) |
< 0.0001 |
|
2013 |
255 |
43.4 (40.5–46.5) |
574 |
68.5 (65.3–71.8) |
< 0.0001 |
|
Sodium |
2010 |
225 |
61.1 (57.0–65.5) |
437 |
83.6 (79.3–88.2) |
< 0.0001 |
|
2011 |
237 |
61.5 (57.9–65.4) |
484 |
87.7 (83.5–92.1) |
< 0.0001 |
|
2012 |
249 |
59.6 (56.4–63.0) |
519 |
88.4 (84.5–92.6) |
< 0.0001 |
|
2013 |
256 |
56.4 (53.1–59.9) |
574 |
84.1 (80.4–87.9) |
< 0.0001 |
|
Total bilirubin |
2010 |
228 |
25.7 (23.8–27.8) |
720 |
36.9 (34.9–38.9) |
< 0.0001 |
|
2011 |
240 |
28.1 (26.1–30.2) |
790 |
37.1 (35.4–38.9) |
< 0.0001 |
|
2012 |
254 |
26.9 (25.0–29.0) |
845 |
33.7 (32.1–35.4) |
< 0.0001 |
|
2013 |
261 |
26.5 (24.7–28.5) |
942 |
36.1 (34.6–37.7) |
< 0.0001 |
|
Total calcium |
2010 |
220 |
53.9 (50.3–57.8) |
321 |
77.8 (72.9–83.0) |
< 0.0001 |
|
2011 |
233 |
52.7 (49.6–56.0) |
348 |
79.5 (75.1–84.1) |
< 0.0001 |
|
2012 |
246 |
52.8 (49.5–56.4) |
362 |
76.2 (72.1–80.6) |
< 0.0001 |
|
2013 |
251 |
49.8 (46.7–53.1) |
383 |
73.2 (68.8–77.9) |
< 0.0001 |
|
Total cholesterol |
2010 |
233 |
28.3 (26.5–30.2) |
754 |
37.4 (35.7–39.1) |
< 0.0001 |
|
2011 |
245 |
26.7 (25.0–28.4) |
829 |
35.4 (34.1–36.8) |
< 0.0001 |
|
2012 |
257 |
26.7 (25.1–28.3) |
820 |
34.7 (33.3–36.2) |
< 0.0001 |
|
2013 |
264 |
26.8 (25.2–28.4) |
993 |
37.5 (36.1–39.0) |
< 0.0001 |
|
Total protein |
2010 |
233 |
57.0 (53.2–60.9) |
715 |
75.4 (71.8–79.2) |
< 0.0001 |
|
2011 |
245 |
53.1 (50.5–55.9) |
780 |
74.9 (71.9–78.1) |
< 0.0001 |
|
2012 |
258 |
51.2 (48.4–54.2) |
834 |
71.9 (69.0–74.9) |
< 0.0001 |
|
2013 |
265 |
50.2 (47.4–53.1) |
855 |
75.5 (72.4–78.8) |
< 0.0001 |
|
Triglyceride |
2010 |
229 |
32.0 (29.3–34.9) |
738 |
45.1 (42.7–47.5) |
< 0.0001 |
|
2011 |
241 |
35.4 (32.8–38.3) |
811 |
48.0 (45.5–50.6) |
< 0.0001 |
|
2012 |
246 |
33.1 (30.7–35.8) |
645 |
45.6 (43.1–48.3) |
< 0.0001 |
|
2013 |
261 |
30.3 (28.3–32.4) |
975 |
45.5 (43.5–47.7) |
< 0.0001 |
|
Uric acid |
2010 |
228 |
32.5 (30.4–34.7) |
649 |
44.1 (41.9–46.5) |
< 0.0001 |
|
2011 |
239 |
30.2 (28.3–32.2) |
701 |
42.2 (40.3–44.3) |
< 0.0001 |
|
2012 |
254 |
28.3 (26.7–30.1) |
740 |
41.0 (39.2–43.0) |
< 0.0001 |
|
2013 |
261 |
28.2 (26.6–29.9) |
805 |
44.1 (42.0–46.2) |
< 0.0001 |
Table 2
Comparison of variance index scores between laboratories categorized by institution type between 2010 and 2013
|
Test item |
Year |
General hospital |
Hospital |
Clinic |
Entrusted laboratory |
P‡
|
|
N*
|
VIS† (95% CI) |
N*
|
VIS† (95% CI) |
N*
|
VIS† (95% CI) |
N*
|
VIS† (95% CI) |
|
Albumin |
2010 |
313 |
43.0 (40.9–45.3) |
312 |
46.3 (43.7–49.2) |
253 |
48.2 (44.7–51.9) |
11 |
36.4 (29.6–44.6) |
0.0302 |
|
2011 |
320 |
37.5§,∥ (35.5–39.6) |
350 |
44.9§ (42.6–47.4) |
282 |
44.5∥ (41.6–47.6) |
12 |
35.5 (26.4–47.7) |
< 0.0001 |
|
2012 |
324 |
37.1§,∥ (35.2–39.1) |
394 |
46.5§,¶ (44.1–48.9) |
302 |
45.1∥,** (42.3–48.1) |
13 |
30.6¶,** (22.2–45.1) |
< 0.0001 |
|
2013 |
345 |
39.7§,∥ (37.7–41.9) |
447 |
49.9§ (47.5–52.5) |
321 |
47.3∥ (44.6–50.1) |
15 |
41.9 (33.6–52.1) |
< 0.0001 |
|
ALP |
2010 |
312 |
41.3§ (38.1–44.9) |
308 |
47.5 (43.5–51.9) |
229 |
52.6§ (46.9–59.1) |
11 |
43.9 (26.2–73.4) |
0.0058 |
|
2011 |
319 |
43.1§,∥ (40.0–46.5) |
346 |
52.8§ (48.9–57.0) |
259 |
53.5∥ (48.5–59.1) |
12 |
42.7 (28.8–63.4) |
0.0007 |
|
2012 |
323 |
40.9§,∥ (37.7–44.2) |
390 |
52.1§ (48.2–56.3) |
274 |
49.5∥ (44.7–54.8) |
13 |
47.5 (29.7–75.9) |
0.0005 |
|
2013 |
340 |
46.6§ (43.0–50.5) |
436 |
59.8§ (55.3–64.6) |
289 |
52.7 (47.9–58.0) |
15 |
51.2 (31.6–82.7) |
0.0004 |
|
ALT |
2010 |
321 |
34.3§ (32.3–36.4) |
314 |
38.5 (36.0–41.3) |
272 |
40.6§ (37.6–43.8) |
11 |
31.8 (25.8–39.2) |
0.0042 |
|
2011 |
328 |
31.8§,∥ (30.0–33.8) |
353 |
36.0§ (34.0–38.2) |
309 |
38.3∥ (35.5–41.4) |
12 |
32.0 (23.7–43.1) |
0.0010 |
|
2012 |
332 |
35.4§,∥ (33.5–37.3) |
397 |
40.0§ (38.0–42.2) |
335 |
42.6∥,¶ (40.0–45.3) |
13 |
27.5¶ (21.6–35.0) |
< 0.0001 |
|
2013 |
356 |
36.0§,∥ (34.0–38.2) |
453 |
42.9§ (40.7–45.2) |
351 |
44.5∥ (41.8–47.5) |
15 |
38.1 (31.1–46.6) |
< 0.0001 |
|
AST |
2010 |
321 |
31.2§,∥ (29.4–33.0) |
314 |
36.9§ (34.5–39.4) |
271 |
38.9∥ (36.1–41.9) |
11 |
27.4 (21.0–35.6) |
< 0.0001 |
|
2011 |
328 |
28.2§,∥ (26.6–29.9) |
353 |
32.3§ (30.4–34.2) |
309 |
35.3∥ (33.2–37.5) |
12 |
29.9 (21.9–40.8) |
< 0.0001 |
|
2012 |
332 |
28.7§,∥ (27.1–30.5) |
397 |
35.7§ (33.8–37.7) |
334 |
36.8∥ (34.4–39.3) |
13 |
24.9 (18.9–32.8) |
< 0.0001 |
|
2013 |
355 |
29.6§,∥ (27.8–31.6) |
453 |
35.3§ (33.3–37.4) |
350 |
37.8∥ (35.3–40.5) |
15 |
32.4 (24.6–42.8) |
< 0.0001 |
|
BUN |
2010 |
314 |
51.2§,∥ (48.2–54.3) |
313 |
63.1§ (59.0–67.5) |
255 |
64.6∥ (59.1–70.6) |
11 |
43.7 (34.0–56.2) |
< 0.0001 |
|
2011 |
321 |
46.4§,∥ (43.8–49.1) |
352 |
62.8§ (59.2–66.7) |
286 |
63.7∥ (58.7–69.0) |
12 |
46.4 (32.7–65.9) |
< 0.0001 |
|
2012 |
325 |
45.0§,∥ (42.7–47.5) |
395 |
63.3§,¶ (59.9–67.0) |
303 |
64.5∥,** (59.8–69.5) |
13 |
38.5¶,** (28.3–52.4) |
< 0.0001 |
|
2013 |
351 |
48.1§,∥ (45.3–51.1) |
448 |
69.0§,¶ (65.2–73.1) |
323 |
69.1∥,** (64.2–74.4) |
15 |
39.2¶,** (29.9–51.5) |
< 0.0001 |
|
Chloride |
2010 |
306 |
84.4§ (79.8–89.3) |
273 |
108.3§ (101.6–115.3) |
45 |
98.0 (81.2–118.3) |
10 |
83.0 (63.5–108.4) |
< 0.0001 |
|
2011 |
313 |
80.4§,∥ (77.0–84.0) |
311 |
104.6§ (99.0–110.5) |
53 |
96.0∥ (83.3–110.5) |
11 |
90.1 (71.5–113.6) |
< 0.0001 |
|
2012 |
316 |
85.1§ (81.1–89.2) |
341 |
103.9§ (98.4–109.7) |
65 |
90.3 (79.3–102.8) |
12 |
76.0 (59.2–97.5) |
< 0.0001 |
|
2013 |
323 |
88.3§ (84.4–92.4) |
386 |
98.1§ (93.0–103.4) |
71 |
99.6 (89.6–110.6) |
15 |
89.2 (68.5–116.2) |
0.0213 |
|
Creatinine |
2010 |
313 |
48.8§,∥ (46.1–51.6) |
314 |
67.0§,¶ (62.9–71.5) |
271 |
69.2∥,** (64.1–74.9) |
11 |
38.2¶,** (23.1–63.0) |
< 0.0001 |
|
2011 |
320 |
47.4§,∥ (44.9–50.0) |
353 |
61.4§ (57.8–65.3) |
306 |
64.2∥ (59.5–69.3) |
12 |
44.8 (35.9–55.9) |
< 0.0001 |
|
2012 |
324 |
48.6§,∥ (46.0–51.3) |
397 |
62.9§ (59.3–66.8) |
333 |
66.9∥,¶ (62.4–71.8) |
13 |
41.9¶ (35.4–49.7) |
< 0.0001 |
|
2013 |
350 |
51.0§,∥ (48.1–54.0) |
453 |
68.3§,¶ (64.8–72.0) |
349 |
71.3∥,** (66.7–76.1) |
15 |
38.5¶,** (30.0–49.3) |
< 0.0001 |
|
γ-glutamyl transferase |
2010 |
313 |
30.5§,∥ (28.6–32.5) |
311 |
36.5§ (34.0–39.2) |
271 |
36.2∥ (33.2–39.5) |
11 |
24.8 (18.0–34.1) |
0.0005 |
|
2011 |
320 |
28.2§,∥ (26.5–30.1) |
348 |
35.6§ (33.4–37.9) |
307 |
34.4∥ (31.9–37.1) |
12 |
25.6 (20.6–31.9) |
< 0.0001 |
|
2012 |
324 |
29.4§,∥ (27.6–31.2) |
391 |
33.8§,¶ (31.8–35.9) |
332 |
34.2∥,** (31.6–37.0) |
13 |
19.6¶,** (14.5–26.3) |
0.0002 |
|
2013 |
350 |
30.5§,∥,¶ (28.7–32.4) |
443 |
35.1§,** (33.2–37.1) |
348 |
37.0∥,†† (34.5–39.6) |
15 |
19.1¶,**,†† (13.9–26.4) |
< 0.0001 |
|
Glucose |
2010 |
313 |
26.6§,∥ (25.0–28.4) |
314 |
36.2§ (33.9–38.7) |
270 |
33.9∥ (31.2–36.9) |
11 |
28.2 (21.8–36.3) |
< 0.0001 |
|
2011 |
320 |
25.4§,∥ (24.0–26.9) |
353 |
34.4§ (32.4–36.6) |
306 |
34.5∥ (32.1–37.2) |
12 |
26.9 (22.0–32.9) |
< 0.0001 |
|
2012 |
324 |
26.0§,∥ (24.5–27.6) |
397 |
34.1§,¶ (32.1–36.1) |
330 |
34.6∥,** (32.2–37.1) |
13 |
21.2¶,** (15.6–28.9) |
< 0.0001 |
|
2013 |
350 |
26.1§,∥ (24.4–28.0) |
452 |
35.5§ (33.5–37.6) |
346 |
33.2∥ (30.8–35.7) |
15 |
23.6 (17.1–32.5) |
< 0.0001 |
|
LDH |
2010 |
307 |
17.2§ (15.5–19.1) |
239 |
24.1§ (21.3–27.3) |
148 |
20.2 (17.2–23.8) |
11 |
21.7 (10.8–43.9) |
0.0007 |
|
2011 |
312 |
15.0§ (13.7–16.4) |
256 |
21.3§ (19.0–23.8) |
157 |
18.3 (15.9–21.1) |
12 |
16.8 (11.0–25.7) |
< 0.0001 |
|
2012 |
315 |
15.2§,∥ (14.1–16.4) |
284 |
20.3§ (18.6–22.1) |
159 |
20.0∥ (17.3–23.2) |
13 |
13.9 (8.0–24.3) |
< 0.0001 |
|
2013 |
327 |
19.3§ (17.8–20.8) |
308 |
23.3§ (21.2–25.6) |
165 |
22.2 (19.5–25.4) |
14 |
13.7 (9.7–19.3) |
0.0032 |
|
Phosphorus |
2010 |
287 |
35.8§ (33.6–38.3) |
142 |
46.8§ (42.0–52.1) |
53 |
45.0 (37.3–54.3) |
10 |
41.2 (28.2–60.4) |
0.0001 |
|
2011 |
293 |
32.1§,∥ (30.1–34.3) |
159 |
42.9§ (38.9–47.4) |
64 |
45.6∥ (37.8–54.9) |
11 |
27.3 (19.7–37.8) |
< 0.0001 |
|
2012 |
298 |
31.6§,∥ (29.5–33.9) |
182 |
39.0§ (35.3–43.2) |
68 |
42.6∥ (36.2–50.1) |
12 |
27.5 (18.8–40.3) |
0.0001 |
|
2013 |
303 |
31.0§,∥ (29.1–33.1) |
189 |
40.3§,¶ (36.5–44.4) |
72 |
39.1∥,** (32.7–46.6) |
14 |
23.9¶,** (17.1–33.5) |
< 0.0001 |
|
Potassium |
2010 |
306 |
52.9§,∥ (49.8–56.1) |
283 |
77.3§,¶ (72.2–82.9) |
49 |
76.3∥ (63.9–91.1) |
11 |
48.2¶ (36.9–63.0) |
< 0.0001 |
|
2011 |
313 |
49.9§,∥ (46.9–53.0) |
319 |
78.2§ (73.6–83.0) |
57 |
73.9∥ (63.4–86.0) |
12 |
54.8 (44.7–67.2) |
< 0.0001 |
|
2012 |
315 |
48.6§,∥ (46.0–51.4) |
349 |
68.2§,¶ (64.6–72.1) |
69 |
60.2∥ (51.5–70.4) |
13 |
43.4¶ (33.9–55.7) |
< 0.0001 |
|
2013 |
322 |
46.3§,∥ (43.4–49.3) |
395 |
71.2§ (67.4–75.3) |
74 |
63.9∥ (55.5–73.6) |
15 |
49.1 (35.1–68.7) |
< 0.0001 |
|
Sodium |
2010 |
306 |
63.9§,∥ (60.1–68.0) |
283 |
85.1§ (79.9–90.8) |
48 |
100.4∥ (84.7–119.1) |
11 |
67.8 (47.5–96.7) |
< 0.0001 |
|
2011 |
313 |
65.3§,∥ (61.6–69.2) |
319 |
88.6§ (83.6–93.8) |
57 |
92.6∥ (79.4–108.0) |
12 |
80.1 (57.4–111.8) |
< 0.0001 |
|
2012 |
316 |
62.8§,∥ (59.5–66.3) |
349 |
91.4§ (86.6–96.4) |
69 |
87.5∥ (76.8–99.6) |
13 |
69.4 (52.8–91.3) |
< 0.0001 |
|
2013 |
323 |
59.8§,∥ (56.6–63.2) |
395 |
86.1§,¶ (81.7–90.8) |
74 |
81.5∥,** (71.9–92.4) |
15 |
55.0¶,** (41.1–73.6) |
< 0.0001 |
|
Total bilirubin |
2010 |
312 |
26.6§,∥ (24.9–28.5) |
310 |
36.8§,¶ (33.8–40.0) |
248 |
40.1∥,** (36.4–44.3) |
11 |
20.2¶,** (15.4–26.6) |
< 0.0001 |
|
2011 |
319 |
28.7§,∥ (26.9–30.7) |
350 |
37.8§ (35.8–40.5) |
278 |
38.0∥ (34.8–41.4) |
12 |
29.2 (22.1–38.6) |
< 0.0001 |
|
2012 |
323 |
27.0§,∥ (25.2–29.0) |
394 |
33.9§ (31.7–36.2) |
299 |
34.4∥ (31.4–37.6) |
13 |
24.2 (19.2–30.5) |
< 0.0001 |
|
2013 |
348 |
28.3§,∥ (26.4–30.4) |
446 |
35.1§ (33.0–37.3) |
319 |
37.7∥ (35.0–40.7) |
15 |
26.5 (19.2–36.7) |
< 0.0001 |
|
Total calcium |
2010 |
295 |
57.8§,∥ (54.4–61.5) |
164 |
81.9§ (74.9–89.5) |
60 |
74.9∥ (62.7–89.4) |
10 |
65.2 (48.5–87.6) |
< 0.0001 |
|
2011 |
302 |
57.6§,∥ (54.4–60.9) |
185 |
82.9§,¶ (76.9–89.2) |
71 |
75.4∥ (64.9–87.5) |
11 |
54.6¶ (42.6–69.9) |
< 0.0001 |
|
2012 |
305 |
57.6§,∥ (54.3–60.9) |
205 |
79.4§ (73.4–85.9) |
74 |
67.6 (58.8–77.6) |
12 |
46.5∥ (31.5–68.5) |
< 0.0001 |
|
2013 |
312 |
52.1§,∥ (49.1–55.3) |
217 |
77.5§ (71.3–84.2) |
76 |
71.8∥ (62.5–82.5) |
14 |
54.8 (44.3–67.8) |
< 0.0001 |
|
Total cholesterol |
2010 |
315 |
29.2§,∥ (27.6–30.9) |
314 |
37.7§ (35.2–40.3) |
272 |
37.4∥ (34.6–40.5) |
11 |
26.5 (18.1–39.0) |
< 0.0001 |
|
2011 |
322 |
28.4§,∥ (26.9–30.0) |
351 |
36.6§ (34.6–38.7) |
308 |
33.8∥ (31.5–36.3) |
12 |
27.0 (19.4–37.6) |
< 0.0001 |
|
2012 |
324 |
27.5§,∥ (26.0–29.1) |
389 |
36.0§ (34.0–38.1) |
331 |
34.5∥ (32.1–37.1) |
13 |
29.8 (24.3–36.5) |
< 0.0001 |
|
2013 |
352 |
30.1§,∥ (28.3–31.9) |
450 |
37.7§ (35.7–39.9) |
349 |
36.1∥ (33.8–38.6) |
15 |
26.0 (20.5–32.9) |
< 0.0001 |
|
Total protein |
2010 |
314 |
59.1§,∥ (55.6–62.8) |
312 |
78.4§ (73.3–83.9) |
248 |
73.8∥ (67.0–81.2) |
11 |
61.5 (48.6–77.7) |
< 0.0001 |
|
2011 |
321 |
58.8§,∥ (55.9–61.8) |
350 |
74.3§ (70.1–78.7) |
275 |
75.1∥ (69.5–81.0) |
12 |
52.9 (40.5–69.0) |
< 0.0001 |
|
2012 |
325 |
55.2§,∥ (52.4–58.1) |
394 |
73.0§ (69.0–77.3) |
293 |
70.3∥ (65.3–75.8) |
13 |
53.6 (39.3–73.0) |
< 0.0001 |
|
2013 |
340 |
56.9§,∥ (53.7–60.3) |
433 |
77.4§ (73.1–82.0) |
311 |
71.5∥ (66.4–77.0) |
15 |
53.2 (40.4–70.1) |
< 0.0001 |
|
Triglyceride |
2010 |
312 |
37.1§,|| (34.2–40.2) |
304 |
45.0§ (41.3–49.0) |
269 |
45.0∥ (41.4–48.9) |
11 |
35.8 (21.5–59.8) |
0.0023 |
|
2011 |
318 |
39.8§,∥ (36.8–43.0) |
341 |
47.2§ (43.4–51.3) |
305 |
48.1∥ (44.4–52.2) |
12 |
35.3 (19.4–64.2) |
0.0029 |
|
2012 |
310 |
36.4§,∥ (33.8–39.3) |
301 |
45.0§ (41.3–49.1) |
259 |
44.6∥ (41.1–48.5) |
11 |
34.0 (21.0–55.0) |
0.0005 |
|
2013 |
349 |
35.3§,∥ (32.8–38.0) |
439 |
45.7§,¶ (42.6–49.0) |
347 |
44.4∥,** (41.4–47.5) |
15 |
26.1¶,** (21.5–31.8) |
< 0.0001 |
|
Uric acid |
2010 |
311 |
34.4§,∥ (32.4–36.6) |
281 |
45.5§ (42.2–49.1) |
207 |
43.5∥ (39.3–48.2) |
11 |
33.3 (25.7–43.3) |
< 0.0001 |
|
2011 |
318 |
31.8§,∥ (30.1–33.6) |
315 |
43.0§ (40.2–46.0) |
225 |
42.7∥ (38.7–47.1) |
11 |
35.5 (24.2–52.0) |
< 0.0001 |
|
2012 |
322 |
30.1§,∥ (28.4–31.8) |
352 |
43.7§,¶ (41.0–46.6) |
236 |
39.3∥ (35.7–43.2) |
13 |
26.3¶ (20.4–33.9) |
< 0.0001 |
|
2013 |
346 |
33.0§,∥ (31.0–35.2) |
386 |
45.7§,¶ (42.8–48.8) |
245 |
40.8∥,** (37.2–44.7) |
15 |
24.6¶,** (19.4–31.1) |
< 0.0001 |
Table 3
Comparison of variance index scores between laboratories in the general hospital group between 2010 and 2013
|
Test item |
Year |
Accredited laboratory |
Non-accredited laboratory |
P‡
|
|
N*
|
VIS† (95% CI) |
N*
|
VIS† (95% CI) |
|
Albumin |
2010 |
205 |
40.8 (38.5–43.4) |
108 |
47.5 (43.5–52.0) |
0.0045 |
|
2011 |
212 |
36.4 (34.1–38.9) |
108 |
39.6 (36.0–43.6) |
0.1534 |
|
2012 |
219 |
36.5 (34.3–38.9) |
105 |
38.3 (34.9–42.1) |
0.3865 |
|
2013 |
221 |
37.6 (35.4–39.9) |
124 |
43.9 (39.8–48.6) |
0.0080 |
|
ALP |
2010 |
203 |
39.3 (36.0–43.0) |
109 |
45.4 (38.5–53.6) |
0.1310 |
|
2011 |
210 |
40.3 (37.0–44.0) |
109 |
49.1 (42.5–56.6) |
0.0209 |
|
2012 |
217 |
39.9 (36.5–43.6) |
106 |
42.9 (36.5–50.4) |
0.4376 |
|
2013 |
219 |
43.4 (39.6–47.5) |
121 |
53.1 (45.5–61.9) |
0.0262 |
|
ALT |
2010 |
205 |
33.9 (31.7–36.3) |
116 |
35.0 (31.2–39.2) |
0.6480 |
|
2011 |
212 |
29.1 (27.2–31.3) |
116 |
37.4 (33.8–41.4) |
< 0.0001 |
|
2012 |
219 |
33.4 (31.3–35.6) |
113 |
39.6 (36.0–43.5) |
0.0028 |
|
2013 |
221 |
34.0 (31.6–36.5) |
135 |
39.6 (35.8–43.9) |
0.0130 |
|
AST |
2010 |
205 |
30.0 (27.9–32.2) |
116 |
33.4 (30.3–36.8) |
0.0794 |
|
2011 |
212 |
27.3 (25.5–29.3) |
116 |
29.8 (26.7–33.2) |
0.1722 |
|
2012 |
219 |
27.7 (25.7–29.8) |
113 |
30.8 (27.9–34.0) |
0.0914 |
|
2013 |
221 |
28.0 (26.0–30.1) |
134 |
32.6 (29.2–36.4) |
0.0199 |
|
BUN |
2010 |
205 |
46.9 (43.8–50.3) |
109 |
60.2 (54.3–66.8) |
< 0.0001 |
|
2011 |
212 |
41.2 (38.7–43.9) |
109 |
58.4 (52.6–64.8) |
< 0.0001 |
|
2012 |
219 |
42.2 (39.7–45.0) |
106 |
51.4 (46.9–56.3) |
0.0005 |
|
2013 |
221 |
42.3 (39.7–45.1) |
130 |
59.7 (53.3–66.8) |
< 0.0001 |
|
Chloride |
2010 |
203 |
76.0 (71.2–81.1) |
103 |
103.9 (94.2–114.5) |
< 0.0001 |
|
2011 |
210 |
74.7 (71.2–78.5) |
103 |
93.4 (86.3–101.2) |
< 0.0001 |
|
2012 |
217 |
77.5 (73.6–81.7) |
99 |
104.2 (95.5–113.7) |
< 0.0001 |
|
2013 |
219 |
83.1 (79.0–87.4) |
104 |
100.2 (91.7–109.5) |
0.0004 |
|
Creatinine |
2010 |
203 |
44.8 (41.9–47.9) |
110 |
57.1 (51.8–62.9) |
< 0.0001 |
|
2011 |
210 |
45.2 (42.4–48.1) |
110 |
51.9 (46.8–57.5) |
0.0257 |
|
2012 |
217 |
45.1 (42.5–47.9) |
107 |
56.5 (50.6–63.1) |
0.0005 |
|
2013 |
219 |
45.6 (43.0–48.3) |
131 |
61.5 (54.8–69.0) |
< 0.0001 |
|
γ-glutamyl transferase |
2010 |
203 |
27.7 (25.6–29.9) |
110 |
36.5 (32.8–40.6) |
< 0.0001 |
|
2011 |
210 |
27.8 (25.7–30.0) |
110 |
29.1 (26.0–32.6) |
0.5024 |
|
2012 |
217 |
28.5 (26.5–30.6) |
107 |
31.2 (27.9–34.8) |
0.1758 |
|
2013 |
219 |
27.9 (26.0–29.9) |
131 |
35.3 (31.6–39.4) |
0.0004 |
|
Glucose |
2010 |
203 |
23.2 (21.7–24.9) |
110 |
34.3 (30.7–38.3) |
< 0.0001 |
|
2011 |
210 |
23.2 (21.8–24.7) |
110 |
30.3 (27.4–33.6) |
< 0.0001 |
|
2012 |
217 |
23.8 (22.2–25.4) |
107 |
31.3 (28.0–35.1) |
< 0.0001 |
|
2013 |
219 |
22.1 (20.6–23.8) |
131 |
34.5 (30.6–38.9) |
< 0.0001 |
|
LDH |
2010 |
201 |
15.2 (13.5–17.1) |
106 |
21.7 (17.9–26.4) |
0.0021 |
|
2011 |
208 |
13.2 (12.0–14.6) |
104 |
19.2 (16.1–23.0) |
0.0004 |
|
2012 |
214 |
14.0 (12.9–15.2) |
101 |
18.1 (15.4–21.4) |
0.0064 |
|
2013 |
216 |
17.1 (15.8–18.5) |
111 |
24.3 (20.6–28.7) |
0.0002 |
|
Phosphorus |
2010 |
198 |
32.9 (30.6–35.4) |
89 |
43.4 (38.0–49.4) |
0.0001 |
|
2011 |
205 |
29.2 (27.2–31.4) |
88 |
40.1 (35.1–45.8) |
< 0.0001 |
|
2012 |
214 |
29.4 (27.4–31.7) |
84 |
37.9 (32.6–44.1) |
0.0033 |
|
2013 |
217 |
29.0 (27.0–31.2) |
86 |
36.7 (32.1–42.0) |
0.0011 |
|
Potassium |
2010 |
203 |
48.4 (45.1–51.9) |
103 |
63.0 (56.5–70.2) |
< 0.0001 |
|
2011 |
210 |
44.4 (41.4–47.6) |
103 |
63.1 (56.6–70.3) |
< 0.0001 |
|
2012 |
216 |
44.0 (41.5–46.7) |
99 |
60.4 (53.9–67.7) |
< 0.0001 |
|
2013 |
218 |
41.9 (39.0–45.1) |
104 |
56.8 (50.9–63.4) |
< 0.0001 |
|
Sodium |
2010 |
203 |
59.5 (55.3–64.0) |
103 |
73.7 (66.0–82.3) |
0.0011 |
|
2011 |
210 |
59.7 (56.0–63.6) |
103 |
78.5 (70.0–88.0) |
< 0.0001 |
|
2012 |
217 |
57.2 (54.0–60.6) |
99 |
76.9 (68.9–85.9) |
< 0.0001 |
|
2013 |
219 |
54.4 (51.1–58.0) |
104 |
72.9 (65.9–80.7) |
< 0.0001 |
|
Total bilirubin |
2010 |
203 |
25.6 (23.6–27.8) |
109 |
28.6 (25.2–32.4) |
0.1378 |
|
2011 |
210 |
27.6 (25.5–29.9) |
109 |
31.0 (27.7–34.7) |
0.0926 |
|
2012 |
217 |
26.8 (24.7–29.1) |
106 |
27.5 (24.3–31.2) |
0.7206 |
|
2013 |
219 |
26.0 (24.0–28.2) |
129 |
32.6 (28.7–37.2) |
0.0036 |
|
Total calcium |
2010 |
200 |
52.9 (49.2–57.0) |
95 |
69.7 (62.7–77.5) |
< 0.0001 |
|
2011 |
208 |
51.8 (48.5–55.3) |
94 |
72.8 (66.0–80.3) |
< 0.0001 |
|
2012 |
216 |
53.3 (49.8–57.1) |
89 |
69.2 (62.9–76.1) |
< 0.0001 |
|
2013 |
217 |
48.7 (45.7–52.1) |
95 |
60.5 (53.6–68.4) |
0.0024 |
|
Total cholesterol |
2010 |
205 |
27.8 (25.9–29.7) |
110 |
32.1 (28.9–35.6) |
0.0188 |
|
2011 |
212 |
26.0 (24.3–27.9) |
110 |
33.7 (30.8–36.8) |
< 0.0001 |
|
2012 |
219 |
25.7 (24.1–27.5) |
105 |
31.6 (28.4–35.3) |
0.0007 |
|
2013 |
221 |
26.4 (24.8–28.0) |
131 |
37.5 (33.3–42.1) |
< 0.0001 |
|
Total protein |
2010 |
205 |
57.1 (53.1–61.4) |
109 |
62.9 (56.3–70.4) |
0.1389 |
|
2011 |
212 |
53.4 (50.6–56.4) |
109 |
70.9 (64.4–78.1) |
< 0.0001 |
|
2012 |
219 |
50.9 (47.9–54.0) |
106 |
65.1 (59.2–71.7) |
< 0.0001 |
|
2013 |
221 |
50.5 (47.5–53.7) |
119 |
71.0 (63.5–79.3) |
< 0.0001 |
|
Triglyceride |
2010 |
203 |
32.2 (29.3–35.3) |
109 |
48.5 (42.0–55.9) |
< 0.0001 |
|
2011 |
210 |
35.3 (32.5–38.3) |
108 |
50.3 (43.1–58.7) |
< 0.0001 |
|
2012 |
212 |
32.7 (30.0–35.5) |
98 |
46.2 (39.8–53.6) |
< 0.0001 |
|
2013 |
219 |
29.4 (27.3–31.7) |
130 |
47.9 (41.7–54.9) |
< 0.0001 |
|
Uric acid |
2010 |
203 |
32.4 (30.2–34.7) |
108 |
38.6 (34.4–43.2) |
0.0100 |
|
2011 |
210 |
29.7 (27.7–31.7) |
108 |
36.5 (33.3–40.0) |
0.0005 |
|
2012 |
217 |
28.0 (26.2–29.9) |
105 |
34.9 (31.6–38.5) |
0.0003 |
|
2013 |
219 |
28.0 (26.3–29.9) |
127 |
43.7 (38.8–49.3) |
< 0.0001 |


 PDF
PDF ePub
ePub Citation
 Print
Print


 XML Download