

 PDF
PDF ePub
ePub Citation
 Print
Print


INTRODUCTION
Liver disease impacts the primary and secondary hemostatic pathways. Chronic liver disease (CLD) result in reduced synthesis of procoagulant factors and anticoagulant factors and is associated with thrombocytopenia and platelet dysfunction [123]. These abnormalities lead to prolongation of prothrombin time (PT) and activated partial thromboplastin time (aPTT), which led to the general belief that a prototypical hemorrhagic disorder induces liver disease [4]. However, neither are these parameters good predictors of bleeding risk in liver disease, nor do they provide sufficient information to optimize the management of bleeding events [56]. Recent studies have suggested that patients with liver disease are in a state of “rebalanced hemostasis”, in which defects in prohemostatic drivers are compensated by commensurate changes in antihemostatic drivers [78]. Conventional coagulation tests such as PT international normalized ratio (INR) and platelet count cannot evaluate this potential state of rebalance, because they only assess components of clot formation. Therefore, these tests might provide misleading information regarding the risk of bleeding, possibly resulting in the administration of unneeded or even harmful prohemostatic factors.
Despite a prolonged PT INR and low platelet counts, whole blood global viscoelastic tests (VETs) are within the normal range in many patients with both acute liver disease and CLD. This observation is commensurate with the concept of rebalanced hemostasis, and is in line with the fact that many of these patients undergo liver transplantation and invasive procedures without requiring blood products [9]. VETs for coagulation are increasingly used for point-of-care (POC) analysis of the complex coagulopathies that can occur during cardiac surgery, and following major trauma and orthopedic liver transplantation [101112]. Thromboelastography (TEG; Haemonetics Corporation, Braintree, MA, USA) and rotational thromboelastometry (ROTEM; TEM International GmbH, Munich, Germany) are two commercially available VETs. VETs evaluate the kinetics of coagulation from initial clot formation to final clot strength and provide a composite picture reflecting the interaction of plasma, blood cells, and platelets. VETs can more closely reflect the situation in vivo compared with PT and aPTT, which are performed on plasma samples and measure isolated end points. In recent studies, patients with cirrhosis often maintain normal global hemostasis as assessed by TEG [13], and parameters of ROTEM could be useful to assess the severity of liver disease and to distinguish cirrhotic individuals from healthy controls [14]. Therefore, VETs are increasingly considered as appropriate tools to investigate the coagulopathy of liver disease. Although TEG and ROTEM give broadly similar information, the results are not directly comparable owing to differences in the blood sampling cups, and in the nature of the activators, used, means that results are not exactly comparable, as well as the fact that the algorithms developed for one technique are not directly transferable to the other [15]. The factors determining whether TEG or ROTEM was used in the previous studies appear to have been mainly influenced significantly by local issues, such as availability of the device and/or historical use [1617].
TEG is classified as a POC test of moderate complexity, but it can be conveniently integrated into a clinical laboratory setting. The main TEG parameters include reaction (R) time, clot formation kinetic time (K), α-angle (α), maximum amplitude (MA), and coagulation index (CI) [16]. A detailed description of these parameters is shown in Table 1. Although the usefulness of TEG for prediction of bleeding in patients with liver disease was evaluated, there was insufficient evidence that the TEG could be a useful test for evaluating coagulopathy and predicting bleeding in patients with CLD [91819].
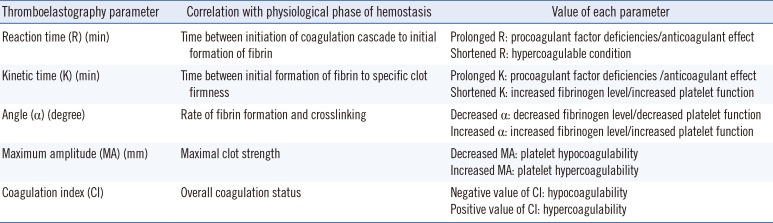
Table 1
Parameters of thromboelastography
![]()
The aims of this study were to (i) evaluate the TEG parameters for coagulopathy in patients with non-cirrhotic and cirrhotic liver disease in a clinical laboratory setting; (ii) compare the TEG parameters with the conventional coagulation parameters of PT INR and platelet count, and (iii) reveal any association between the TEG parameters and disease severity and/or transfusion requirement in patients with CLD.
Go to : 
METHODS
1. Subjects
This was a prospective and observational single-center study involving patients with viral hepatitis, primary biliary cirrhosis (PBC), autoimmune hepatitis, alcoholic hepatitis, cirrhosis with or without hepatocellular carcinoma, and controls. We enrolled 84 controls and 175 adult patients with CLD. A cohort of patients was divided into two groups: a non-cirrhotic (hepatitis) group (including patients with viral, PBC, autoimmune, alcoholic, and other hepatitis) and a cirrhotic group (including patients with liver cirrhosis with or without hepatocellular carcinoma). Twelve of the 17 patients with PBC were classified in the non-cirrhotic group, and five patients were classified in the cirrhotic group. All patients with CLD were admitted to the hepatology clinic between January and October 2015. The control group was randomly selected among the population with evaluation of bleeding risk planned for minor surgery. No subject in the control group had a history of hematologic and hepatic disease, or any known treatment that could influence hemostasis, including anticoagulants, non-steroidal anti-inflammatory drugs, and antiplatelet drugs.
Non-cirrhotic hepatitis and patients with cirrhosis with or without hepatocellular carcinoma were diagnosed and classified on the basis of clinical features, laboratory tests, upper digestive endoscopy, imaging diagnostics, and whenever possible, liver histology. The Child-Pugh (C-P) score and the Model for End-Stage Liver Disease (MELD) score were used in the non-cirrhotic and cirrhotic groups to calculate the CLD severity.
Modified C-P classification was used as the reference to account for the severity of end-stage liver disease based on serum bilirubin, albumin, PT, and the degree of ascites and encephalopathy. A total score of 5–6 is considered as C-P class A (well-compensated disease), 7–9 as class B (significant functional compromise), and 10–15 as class C (decompensated disease) [20]. The MELD score is a validated cirrhosis severity scoring system for predicting three-month survival, using serum bilirubin, creatinine, and PT INR. To calculate the MELD score, the MELD Model, United Network for organ sharing (UNOS) modification was used as follows [21]:
The patients and controls under 18 yr of age were excluded. Blood samples were taken at admission. The transfusion history was reviewed at day seven after admission. This study was reviewed and approved by the Institutional Review Board of Pusan National University Yangsan Hospital after full committee review (No. 05-2015-032). With written informed consent from the participants, after completion of all medical tests, the residual samples were used for research purposes.
2. Blood sampling and plasma preparation
Blood was collected in a 3.2% sodium citrated blood collection tube (Vacuette, Greiner Bio-One, Wemmel, Belgium), EDTA tube (Vacuette, Greiner Bio-One), and serum separating tube (Vacuette, Greiner Bio-One). Whole blood in the sodium citrate tube was retained for TEG, and the residual samples were centrifuged at 2,270g for 10 min. All tests were completed within two hours after blood sampling.
3. Conventional coagulation parameters and other laboratory tests
Hemoglobin, platelet count, and PT INR were simultaneously measured. For PT, the STA-Neoplastin CI Plus (Stago Diagnostica, Paris, France) was used on the STA-R Evolution instrument (Stago Diagnostica). Hemoglobin was measured by using the XE 2100 system (Sysmex Corporation, Kobe, Japan), and creatinine, albumin, and total bilirubin were measured by using AU5800 Chemistry Analyzer (Beckman Coulter Diagnostics, Brea, CA, USA).
4. Thromboelastography
In brief, blood samples were collected in a 3.2% sodium citrate tube, and gently inverted six times. In accordance with manufacturer's recommendation, the samples were kept at room temperature for 30 min and gently inverted five times, and 1 mL was transferred to a vial containing buffered stabilizers and kaolin. Kaolin was chosen owing to the unavailability of tissue factor alone, which would more closely mimic in vivo coagulation. The sample was mixed by inversion five times, and 340 µL was transferred to a 37℃ pre-warmed disposable cup containing 20 µL calcium chloride, and was measured within 40 min.
The parameters of clot formation, R, K, α, and MA, were measured with the activator kaolin on the TEG 5000 system (Haemonetics Corporation), and the CI was determined as follows:
Maintenance and quality controls were performed daily in strict accordance with manufacturer's recommendations. Haemonetics TEG Hemostasis System Level I and Level II Control (Haemonetics Corporation) were used as internal quality controls. The College of American Pathology proficiency test was performed for external quality control three times a year. TEG was performed by two well-trained medical technicians in the clinical laboratory.
In this study, hypocoagulability was defined as a prolonged R, prolonged K, decreased α, and decreased MA relative to the reference range after setting-up the reference intervals from the control group. A negative value below the reference range and a positive value above the reference range of CI indicated a hypocoagulable state and hypercoagulable state, respectively. Hypercoagulability was also defined if one or more of the following parameters were observed: shortened R, shortened K, increased α, and increased MA.
5. Statistical analysis
Continuous variables were expressed as medians and ranges. Statistical differences in parameters among the groups were evaluated using the Kruskal-Wallis test and the Mann-Whitney U test. Spearman's test was used for assessing the correlations of the variables. The correlation coefficient (r) measures the strength between two variables. When r is 0.6-1.0, it indicated strong correlation, when r is 0.4-0.59, it indicated moderate correlation, when r is 0.0-0.39, it indicated weak correlation [22]. The reference intervals for each measured TEG variable were calculated from the median and the boundary encompassing 95% of the control groups. All analyses were performed with SPSS version 23 software (IBM SPSS Statistics, Chicago, IL, USA). For all statistical comparisons, P value <0.05 was considered significant.
Go to :
RESULTS
1. Demographic, clinical, laboratory, and TEG characteristics of patients and controls
Demographic, clinical, laboratory, and TEG characteristics of the patients and controls are listed in Table 2. A total of 259 cases, including 52 patients in the non-cirrhotic group, 123 patients in the cirrhotic group, and 84 controls, were enrolled. There were differences in age and sex among the three groups.
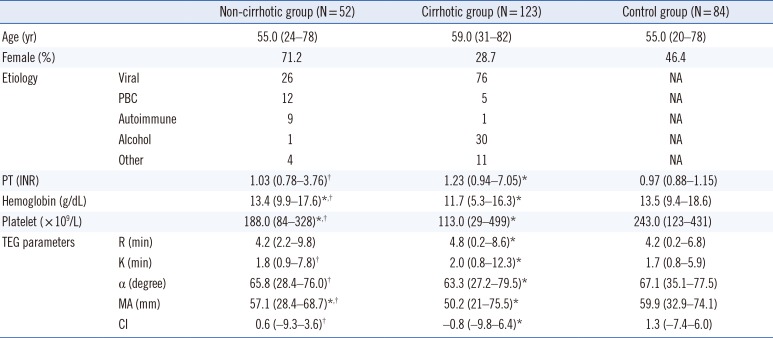
Table 2
Demographic, clinical, laboratory, and thromboelastographic characteristics of patients and controls
Values are expressed as tmedians and ranges.
*P<0.05 indicates a significant difference between each group and the control group; †P<0.05 indicates a significant difference between the non-cirrhotic and cirrhotic groups.
Abbreviations: NA, not applicable; PBC, primary biliary cirrhosis; PT, prothrombin time; INR, international normalized ratio; TEG, thromboelastography; R, reaction time; K, kinetic time; α, α-angle; MA, maximum amplitude; CI, coagulation Index.
![]()
All the TEG parameters, PT INR, hemoglobin, and platelet count in the cirrhotic group showed significant differences from those in the control group (Table 2). There were significant differences in all parameters, except R time, between the non-cirrhotic and cirrhotic groups. In the non-cirrhotic group, hemoglobin, platelet count, and MA were significantly different from those in the control group.
The reference values for TEG variables, including R, K, α, MA and CI, are shown in Table 3. There were significant differences in all reference values of TEG parameters between males and females.
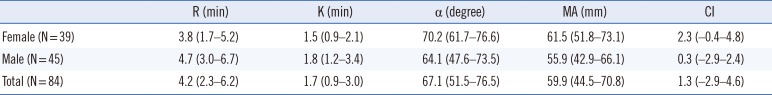
Table 3
Reference intervals of thromboelastographic parameters from kaolin-activated citrate blood in the control group
Results are expressed as medians and boundaries encompassing 95% of the population.
Abbreviations: see Table 2.
![]()
The cirrhotic group showed a hypocoagulopathy pattern (prolonged R, prolonged K, decreased α, and decreased MA) based on the TEG parameters, prolonged PT INR, and decreased platelet count compared with the non-cirrhotic group (Table 4).
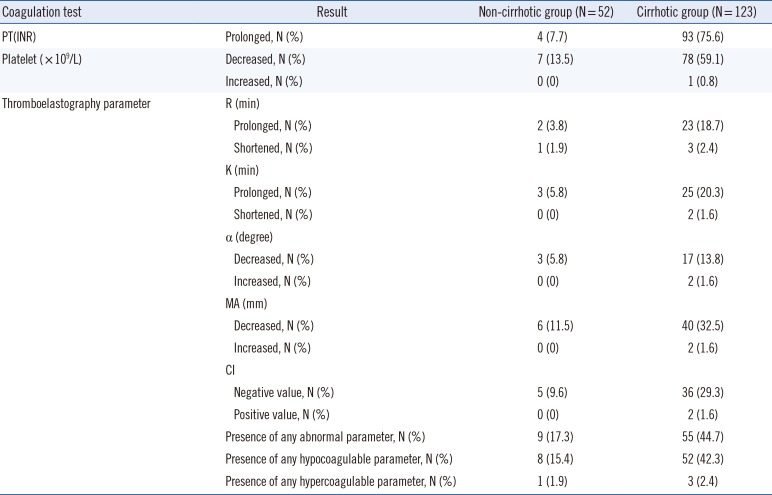
Table 4
Portion of abnormal coagulation test results including thromboelastography based on the reference range suggested in this study
Abbreviations: see Table 2.
![]()
Six patients (11.5%) of the non-cirrhotic group and 40 patients (32.5%) of the cirrhotic group had hypocoagulable MA; no patients in the non-cirrhotic group and two patients (1.6%) of the cirrhotic group showed hypercoagulability. Nine patients (17.3%) of the non-cirrhotic group and 55 patients (44.7%) of the cirrhotic group showed abnormal TEG results. Eight patients (15.4%) of the non-cirrhotic group and 52 patients (42.3%) of the cirrhotic group had hypocoagulable profiles, and one patient (1.9%) of the non-cirrhotic group and three patients (2.4%) of the cirrhotic group showed hypercoagulability. The majority of abnormal TEG results revealed hypocoagulable patterns.
Seventeen patients with PBC did not show a hypercoagulability pattern, and two patients (one of five patients in the cirrhotic group and one of 12 patients in the non-cirrhotic group) showed hypocoagulability with prolonged K, decreased α, decreased MA, and a negative CI value.
2. Correlations between TEG parameters and conventional coagulation parameters
All TEG parameters showed significant correlations with PT INR and platelet count (Table 5). Considering the platelet count, strong correlations were found with MA (r=0.712) and CI (r=0.613), and moderate correlations were found with α (r=0.548). However, the correlations of PT INR were weak with R (r=0.173) and K (r=0.242), and were inverse with α (r=−0.233), MA (r=−0.328), and CI (r=−0.310).
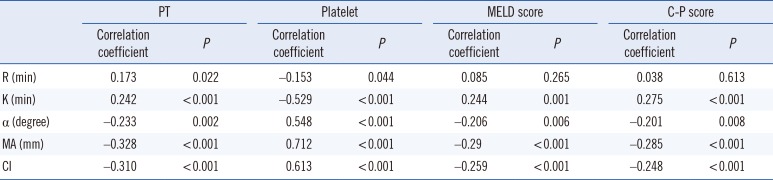
Table 5
Correlations among thromboelastography, conventional coagulation parameters, and severity scores of patients with liver disease
![]()
3. Correlations between TEG parameters and CLD severity
All TEG parameters, except R time, showed a weak or inverse correlation with the MELD and C-P scores (Table 5).
4. TEG parameters according to transfusion status
Twelve patients (6.9%) among the 175 patients with CLD received a transfusion within one week after the testing, and all of them were in the cirrhotic group. Only three of these patients had a bleeding episode such as hematochezia and esophageal varix within one week after the testing. The remaining nine patients received a prophylactic transfusion guided by INR and platelet count with or without low hemoglobin. Among the 12 transfused patients, 10 showed abnormal TEG parameters and received blood products with the platelet concentrates or fresh frozen plasma (FFP) with or without red blood cells (RBC). However, two patients, who received only RBC transfusions, showed low hemoglobin level, normal PT INR, and normal TEG parameters. Sixty-four (36.6%) of the total 175 patients had at least one or more abnormal TEG parameters, on the basis of the reference value from the control group in this study (Table 4). The remaining 111 patients, including two patients with RBC transfusions, showed normal TEG parameters and had no transfusion episode with platelet concentrates and/or FFP. Considering the transfusion history with platelet concentrates and/or FFP, the patients with normal TEG parameters did not receive blood products.
The transfused patients showed significantly prolonged PT INR, decreased hemoglobin, high C-P score, high MELD score, and low MA (Table 6).
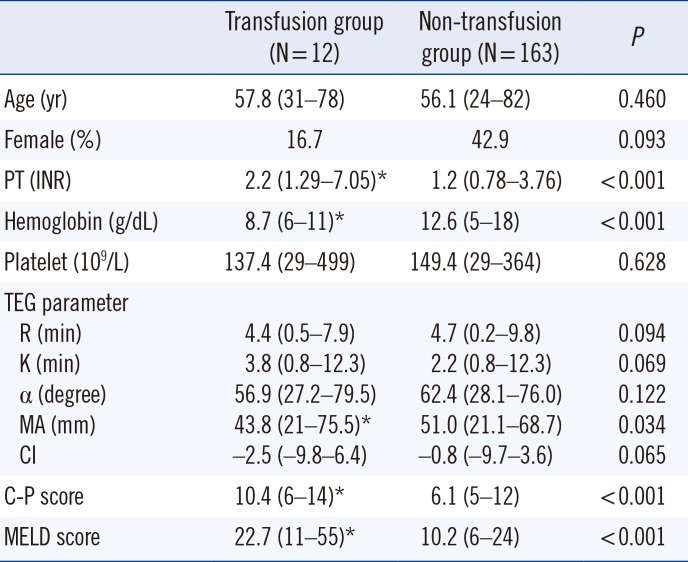
Table 6
Thromboelastographic parameters according to transfusion status
Abbreviations: see Table 5.
![]()
Go to :
DISCUSSION
Hemostatic changes associated with liver disease result in a net rebalance of the system with the reduction of procoagulant and fibrinolytic factors, rather than a true coagulopathy [562324]. TEG can more accurately reflect the dynamic effects of pro-coagulants, natural anticoagulants, platelets, and the fibrinolytic pathway, and as such may provide a more accurate estimate of underlying coagulopathy [25]. In this study, cirrhotic patients tended to have hypocoagulopathy. Cirrhosis is considered as a type of acquired coagulopathy because of the defective synthesis of most coagulation factors [26]. TEG could be used to investigate the coagulopathy of patients with CLD to detect signs of hypo- and hypercoagulability that may lead to hemorrhage during invasive procedures or thrombosis [14].
In previous studies, TEG was performed by using native whole blood without anticoagulation in the emergency department or the operating room. Currently, sodium citrated blood with kaolinactivation is widely used. Every patient with liver disease, regardless of outpatient or inpatient, can measure TEG parameters as routine hemostatic markers. Therefore, we provide reference values of TEG parameters from kaolin-activated sodium citrated tube in clinical laboratory. Considering the effects of sex, the female reference range showed a hypercoagulable profile such as a shortened R, shortened K, increased α, and increased MA compared with that of males. The reasons may be related to the generally higher procoagulant levels platelet counts in females [27]. Scarpeliniwe et al [28] demonstrated that healthy and nontraumatized women are more hypercoagulable than men, on the basis of their TEG profiles. Thus, determining different range values for males and females warrants further investigation.
A shortened R time was detected in the reference range of this study compared with the information from the manufacturer. Thalheimer et al [29] also reported a significantly shortened R time with citrated blood compared with that with native blood. Therefore, kaolin-activated TEG needs further validation before its routine clinical use in these settings. And VETs suffer from a unique set of preanalytic and analytic variables that impact test reliability and reproducibility [30]. It is essential that the personnel running the tests are adequately trained and that the equipment is subject to standard quality management procedures for VETs.
Ben-Ari et al [31] found that 28% of patients with PBC and 43% of patients with PSC were hypercoagulable compared with only 5% of noncholestatic cirrhosis patients and none in the healthy controls. In this study, two of 17 patients with PBC were in a hypocoagulable state, and none of the patients with PBC was in a hypercoagulable state. A further study for evaluating the TEG profile would be required in patients with PBC.
The correlations between PT INR and the TEG parameters R and K were week (r=0.173–0.242) in this study. Coakley et al [15] reported a week correlation between PT INR and R (r=0.24), and this may be explained by several factors such as different activators, specimens type, and the fact that R, unlike PT INR, reflects the balance of both pro- and anticoagulants. This may also explain why R does not appear to be sensitive to mild to moderate increases in PT INR [32]. Another potential reason is that tissue factor expression on monocytes leads to a shortened R, as seen in some patients with CLD [33]. By contrast, the correlation between platelet count and MA was strong (r=0.712) in this study. Clot strength, as assessed by MA, is highly influenced by both fibrinogen levels and platelet count; however, in CLD, in which fibrinogen levels are usually not increased, the platelet count may have a more significant impact on changes in MA [14].
To assess the severity of CLD, PT and PT INR are used in the scoring systems of C-P and MELD. Although Tripodi et al [14] reported that some parameters of ROTEM were significantly correlated with the C-P or MELD score, the TEG parameters and severity markers (C-P and MELD scores) showed week correlations in this study. This discrepancy might be due to the week correlation between PT INR and TEG parameters. Therefore, it is difficult to assess CLD severity using TEG parameters.
In previous studies, TEG was used to predict bleeding and to investigate hemostasis in cirrhotic patients with variceal bleeding [1819]. TEG in patients with active variceal bleeding was shown to be superior to INR [18]. However, the patient's previous history of bleeding or thrombosis was not associated with any of the TEG parameters [14]. Patel et al [34] recommended the correction of INR and platelet count deficits through the use of FFP and/or platelet transfusion before invasive procedures to prevent bleeding complications. A TEG-guided transfusion strategy led to a significantly less use of blood products without an increase in bleeding complications compared with INR- and platelet count-guided transfusion in patients with cirrhosis and significant coagulopathy before invasive procedures [9]. A normal TEG in patients with liver disease may be a reflection of rebalanced hemostasis, and may explain why many of these patients are able to undergo liver transplantation without transfusion [35]. Clinicians can consider that the patients with liver disease have a low risk of bleeding when they show a normal TEG result before an invasive procedure.
Our observations, even though limited to a single experience and small sample size, support the use of TEG analysis to evaluate the coagulopathy of cirrhotic patients. The main limitation lies in the population studied. The inclusion criteria should have been stricter and included patients planned for an invasive procedure. Only 12 patients received transfusion and only three patients experienced bleeding episodes in this study. This number of patients was relatively small. Furthermore, information on the association between bleeding risk and TEG parameters is limited. Therefore, a large randomized prospective study should be designed to organize and standardize all available data in this field.
In summary, the patients in the cirrhotic group showed a hypocoagulable state on the basis of TEG parameters (prolonged R, prolonged K, shortened α, and decreased MA, negative value of CI) compared with the control and non-cirrhotic groups. This suggests that patients with cirrhosis suffer from coagulopathy, and indicates the potential application of TEG analysis for such patients. The correlation between platelet count and MA was strong, whereas the correlation between PT and R or K was weak. Because of the weak correlations with severity scores (C-P and MELD), the TEG parameters do not seem to be good predictors of severity in CLD. These data also suggest that patients with a normal TEG profile may have a low risk of bleeding. Overall, these results suggest that TEG analysis in patients with CLD can be a helpful tool to investigate coagulopathy and to predict a low risk of transfusion requirement before an invasive procedure.
Go to :
 XML Download