

 PDF
PDF ePub
ePub Citation
 Print
Print


INTRODUCTION
Telomeres are repetitive DNA sequences located at the end of chromosomes of eukaryotic cells, and telomerase is an enzyme that elongates these telomeres [1]. As cells divide, telomere attrition occurs, which can result in critical shortening of the telomeres along with inhibition of telomerase, cell proliferation arrest, apoptosis, and senescence [23]. Shortened telomeres can cause fusion of chromosomes at the ends [3], which results in instability of the genome and contributes to carcinogenesis. Therefore, studies on telomeres and telomerase have been a major focus of cancer research, including studies on hematologic malignancies [4567].
MDS represents a series of clonal hematopoietic stem cell diseases that show cytopenia due to ineffective hematopoiesis and morphologic dysplasia of the hematopoietic cells, and is associated with an increased risk of progression to AML [8]. Abnormal proliferation of dysplastic hematopoietic cells and peripheral cytopenia in MDS reflects the paradoxical coexistence of active proliferation and apoptosis. Several markers and prognostic scoring systems have been developed to predict AML progression, including age, blast count, cytogenetic aberrations, degree of cytopenia, and transfusion dependence [910].
Telomere dynamics have been studied to clarify MDS pathophysiology [7111213141516], and a small number of studies have assessed telomere status, telomere length (TL), and telomerase activity (TA) as prognostic factors [71417]. Many of these previous studies used the telomeric repeat amplification protocol (TRAP) assay, Southern blot analysis, or quantitative PCR to evaluate TL [121318]. However, these methods require a large number of cells and the measurement of TLs in asynchronous populations of cells, thereby preventing the evaluation of individual cell cycle phases. Quantitative fluorescence in situ hybridization (QFISH) of telomeres can provide better insight into the TL at the chromosomal level, and enables the quantitative assessment of the TLs of individual cells in both the metaphase and interphase cell cycle stages [1920]. However, no extensive studies have been conducted on interphase and metaphase TLs separately in MDS cases. Therefore, we assessed the TLs of interphase and metaphase cells of MDS cases separately by telomere QFISH, and evaluated the relationship between TL and TA in these two independent populations to determine telomere dynamics in MDS.
METHODS
1. Patients
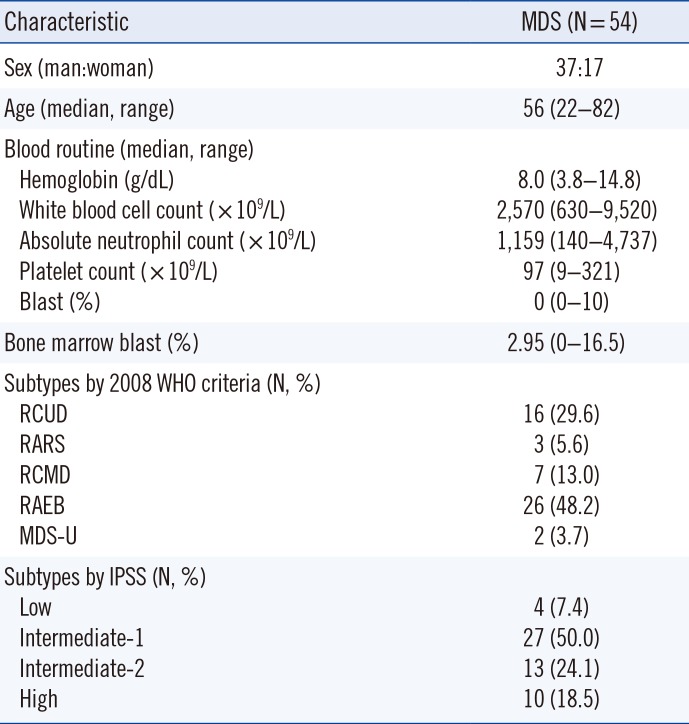
Study data were collected from 54 de novo MDS patients at Seoul National University Hospital, Seoul, Korea, between January 2000 and January 2009. Bone marrow (BM) aspirates were obtained as initial diagnostic samples from the 54 MDS patients and 31 control patients who had no evidence of malignancy in the BM. The MDS patients were reclassified by the 2008 WHO classification for MDS. Patients were also classified according to the International Prognostic Scoring System (IPSS) for MDS as “Low”, “Intermediate-1”, “Intermediate-2” and “High” [21]. This study was approved by the institutional review board of Seoul National University Hospital (IRB1009-089-332), and the requirement of informed consent was exempt by the institutional review board.
Thirty-seven men and 17 women were included, with a median age of 56 yr. The median hemoglobin level and platelet count were 8.0 g/dL and 97×109/L, respectively. The white blood cell count varied from 630×109/L to 9,520×109/L (median: 2,570×109/L), and the absolute neutrophil count varied from 140×109/L to 4,737×109/L (median: 1,159×109/L). A large proportion of the patients included in this study (48.2%) were categorized as having refractory anemia of excess blasts (RAEB) according to the 2008 WHO criteria. The clinical characteristics of the MDS patients are summarized in Table 1. The 31 control patients (20 men, 11 women, median age of 57 yr) showed hemoglobin, white blood cell count, and platelet count values within normal limits.
2. Cytogenetic analysis
Giemsa-banding (G-banding) for karyotyping was performed as previously reported with heparinized BM samples [22]. Twenty metaphase cells were karyotyped according to ISCN criteria [23] in cases with available samples. Interphase FISH tests (del(5q)/ −5, del(7q)/ −7, trisomy 8, del(20q), trisomy 1/1q+) were performed according to the manufacturer's instructions on mononuclear cells of BM aspirates at the time of BM examination. The probes used were LSI EGR1 (5q31)/D5S23, D5S721 (5p15.2), LSI D7S522 (7q31)/CEP7, CEP8, LSI D20S108 (20q12), and LSI Trisomy 1q (1q25) (Abbott, Downers Grove, IL, USA). At least 200 cells were reviewed for interphase FISH. TLs according to various cytogenetic abnormalities including numerical, structural abnormalities and abnormalities of chromosome 1, 5, 7, 8, or 20 and complex karyotype (≥3 abnormalities) were compared.
3. QFISH
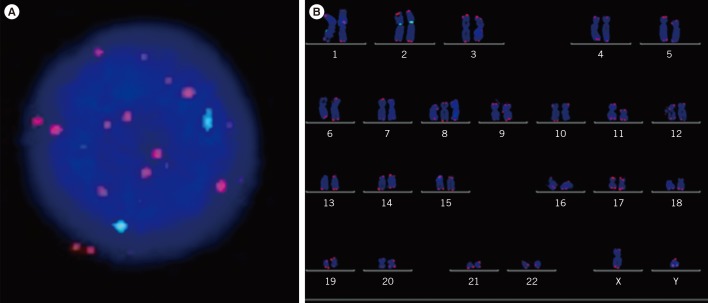
QFISH was performed by using the telomere peptide nucleic acid (PNA) FISH kit (Dako Cytomation Denmark A/S, Glostrup, Denmark) with the archived BM samples stored at −80℃. Telomeres were labeled with a Cy3-PNA probe, and the centromere of chromosome 2 was hybridized with a fluorescein isothiocyanate (FITC)-labeled PNA probe (Dako). Ten microliters of the telomere probe and 1 µL of the centromere probe were mixed, and QFISH were performed according to the manufacturer instructions. Metaphase and interphase QFISH images were captured with a Zeiss Axioplan 2 imaging microscope (Carl Zeiss MicroImaging GmbH, München, Germany) and analyzed by the ISIS-Telomere module (MetaSystems GmbH, Altlussheim, Germany) [24]. The software calculates a telomere to centromere (T/C) fluorescence intensity ratio, which is a measure of TL, for each individual chromosome arm within each metaphase and interphase nucleus [24]. The T/C ratio multiplied by 100 was used as the TL. At least 30 interphase nuclei were scanned for each sample, and at least two metaphase cells were karyotyped and captured for TL measurements. The average TL of MDS patients were used as the cutoff for “long” TL and “short” TL with long TL defined as greater or equal to the average TL of MDS patients.
4. Proliferative index
The proliferative index was calculated indirectly by analyzing the cytogenetic results of patients with abnormal karyotypes. The number of abnormal clones detected by conventional G-banding divided by the number of normal karyotypes was designated as the proliferative index. For example, if the karyotype result was 46,XX,del(7)(q22q32)[12]/46,XX[8], the proliferative index would be 12/8=1.5. The correlation of proliferative index with clinical subtypes, TL, and TA were evaluated with Spearman's correlation.
The proliferative index was available for 24 MDS patients with cytogenetic abnormalities by karyotyping. The average was 3.1±4.4, and the range was 0.05–19. The average proliferative index according to the IPSS grouping of low/intermediate-1, intermediate-2, and high was 1.8, 2.3, and 5.6, respectively.
5. TA
TA was measured with a quantitative telomerase detection kit (Allied Biotech Inc., Ijamsville, MD, USA), according to the manufacturer instructions. In brief, mononuclear cells were isolated and lysed, and the protein concentration of the cell extract was measured with a NanoDrop 1000 spectrophotometer (Thermo Fisher Scientific Inc., Wilmington, NC, USA). Using real-time PCR, the oligonucleotides contained in the premix were extended by telomerase in the cell extracts. Control templates, i.e., oligonucleotides containing sequences that are identical to the telomere primers, were used to generate a standard curve. The standard curve was used to calculate the amount of template with telomeric repeats that was created by telomerase in a given extract. The average TA of the MDS patients was used as the cutoff for high vs. low TA, with high TA defined as having TA with greater than or equal to TA of the MDS patients.
6. Statistical analysis
Patient baseline characteristics were expressed as median and range. Comparison of the average TLs according to the clinical subtypes was performed by ANOVA. Pairwise correlations with categorical clinical characteristics and TL, TA, and proliferative index were evaluated by using Spearman' correlation (rho). The differences of TL, TA for different cytogenetic abnormalities, clinical groups were assessed by two-tailed student t-test, Mann-Whitney, or one-way ANOVA.
The survival among different 2008 WHO categories of MDS [8] and the IPSS [21] were compared with Kaplan-Meier survival analysis (log-rank test). The usefulness of TL as a prognostic factor was evaluated according to the IPSS subgroup. TL and TA were corrected for age effects by using linear regression analysis. Kaplan-Meier survival analysis (log-rank test) was applied in survival analysis including disease free survival and overall survival according to interphase TL and TA. Progression free survival was calculated from the date of MDS diagnosis by BM examination to the date of AML progression confirmed by BM study. The overall survival was calculated from the date of diagnosis to the date of last follow up or death. The predictive value for overall survival in MDS was assessed by Cox proportional hazard analysis. The multivariable Cox analysis included the following factors as categorical covariates: IPSS, hematopoietic stem cell transplantation, transformation to AML, interphase TL. Statistical significance was defined as P<0.05. All statistical analyses were performed by using the SPSS 19.0K software program (SPSS Inc., Chicago, IL, USA).
RESULTS
1. TL and TA
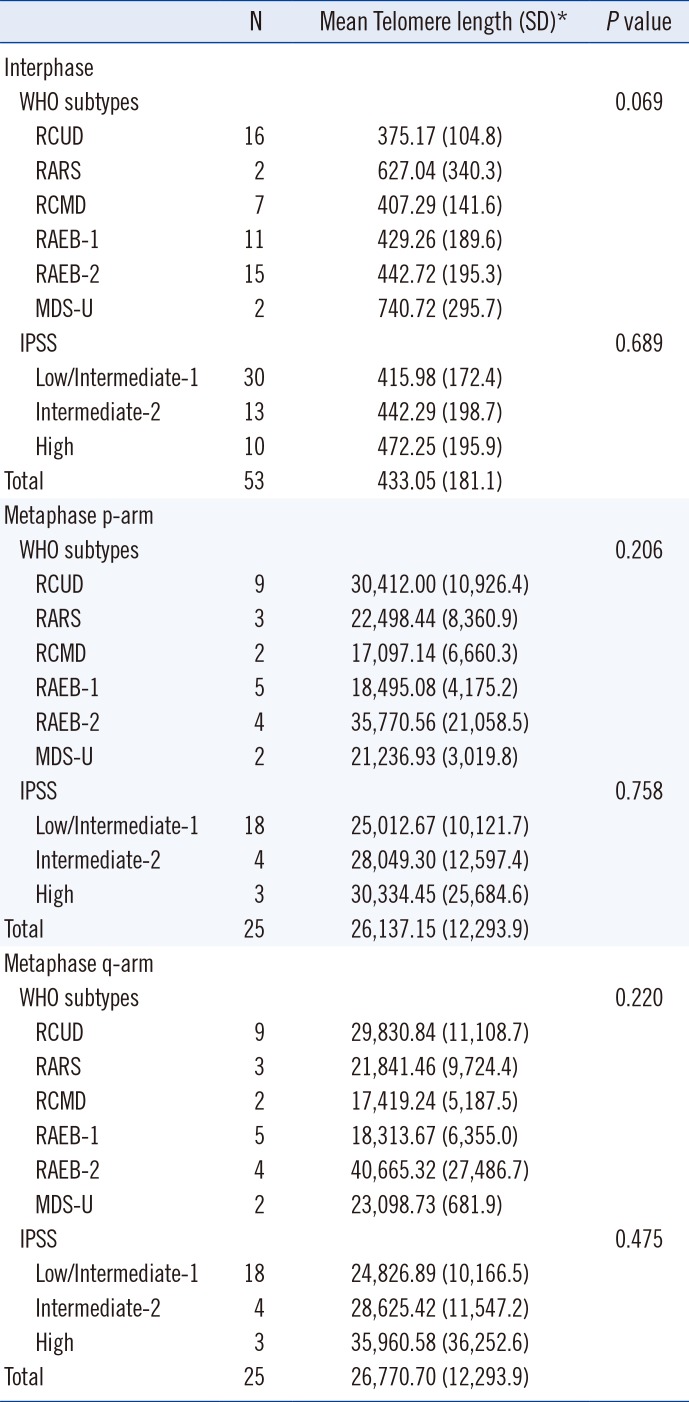
Because TL was shown to be positively correlated with the T/C fluorescence intensity ratio [24], the T/C ratio was used as an indicator of TL in this study. The TLs of interphase nuclei were measured in 53 MDS patients and 31 control patients (Fig. 1A). Interphase TL was measured from an average of 151 interphase nuclei (37–212) in each MDS patient. Average metaphase TLs were available for 25 of the 54 MDS patients, which were 26,137.15 for the p-arm and 26,770.70 for the q-arm (Fig. 1B). Average metaphase p-arm and q-arm TLs were not statistically different (P=0.439). The average metaphase p-arm and q-arm TLs according to WHO subtypes and IPSS subtypes are shown in Table 2. No significant differences in metaphase p-arm and q-arm TLs were found according to 2008 WHO or IPSS subtypes (P=0.206 and 0.758 for the p-arm, and P=0.220 and 0.475 for the q-arm, respectively).
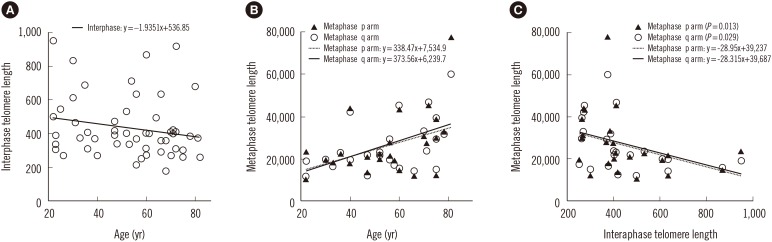
The relationships between age, interphase TL, and metaphase TL were analyzed in the MDS patients by using the linear regression model. The interphase TLs of the MDS patients were not correlated with age (P=0.159) (Fig. 2A), but the TLs of the p- and q-arms in metaphase cells were positively correlated with age (P=0.013 and P=0.022, respectively; Fig. 2B).
The average interphase TL was shorter in the MDS patients (433.05) than in the controls (1,599.56, P<0.001). Interphase TLs did not differ significantly among the WHO or IPSS groups (P=0.069 and 0.689, respectively) (Table 2).
The relationship between metaphase and interphase TL in MDS patients was evaluated. The interphase and both metaphase p- and q-arms had significant correlations. The Spearman correlation coefficient between the interphase and metaphase p-arm TL was −0.498 (P=0.013), and that between the interphase and metaphase q-arm TL was −0.445 (P=0.029) (Fig. 2C).
TA was measured in 22 MDS patients; the average TA in molecules/reaction was 5,650.7±6,276.3. The average TAs according to WHO subtypes were 2,481.8 for RCUD (n=5), 5,054.5 for RARS (n=1), 7,462.2 for RCMD (n=3), 4,514.1 for RAEB-1 (n=5), 9,813.8 for RAEB-2 (n=6), and 1,506.6 for MDS-U (n=2). Although only a small number of patients in each WHO subtype was included in this study, our results showed no significant differences in TA among the different subtypes (P=0.420). In addition, TA did not differ among IPSS groups (P=0.244). No significant correlation between TA and TL was found (P=0.479).
2. Proliferative index
There was no significant difference of proliferative index among the IPSS groups (P=0.145). According to the WHO subtypes, the proliferative index was 1.9 for RCUD, 2 for RCMD, 2.1 for RAEB-1, 5.3 for RAEB-2, and 0.8 for MDS-U (P=0.480). The correlations of proliferative index with the clinical subtypes, TL, and TA were evaluated. The Spearman correlation coefficient between IPSS groups and the proliferative index was 0.445 (P=0.029), and that between interphase TL and the proliferative index was −0.411 (P=0.046). However, no other variable showed statistically significant correlation with the proliferative index.
3. TL and TA according to different cytogenetic aberrations
We investigated whether there were differences in TA and average interphase TL between MDS patients with or without certain cytogenetic abnormalities. No difference in the average interphase TL was found between the groups with and without structural changes, numerical changes, or complex karyotypes, as determined by conventional G-banding (P=0.993, 0.905, and 0.347, respectively). In addition, patients with cytogenetic changes included in the IPSS (abnormalities of chromosomes 5, 7, 20, 8, or 1 by FISH) did not show significantly different interphase TLs compared with those without such abnormalities (P=0.554, 0.903, 0.319, 0.076, and 0.885, respectively). There were no significant differences in the interphase TL between patients with or without trisomy 8 (n=8) or del(20q) (n=4) (P=0.232 and 0.758, respectively). In addition, there were no significant differences in average metaphase TLs for patients without or with trisomy 8 (n=3) or del(20q) (n=3) (P=0.311, 0.606, respectively). Moreover, there was no significant difference in the TL of chromosome 8 between patients with (n=3; 24,813.1) or without (n=22; 38,487.0) trisomy 8 (P=0.277). In addition, there was no difference in the TL of chromosome 20 between patients with (n=3; 26,589.6) or without (n=22; 25,459.2) chromosome 20q deletion (P=0.558). TAs were not different between the groups with and without structural, numerical, or complex cytogenetic abnormalities (P=0.322, 0.596, and 0.954, respectively.)
4. Survival analysis
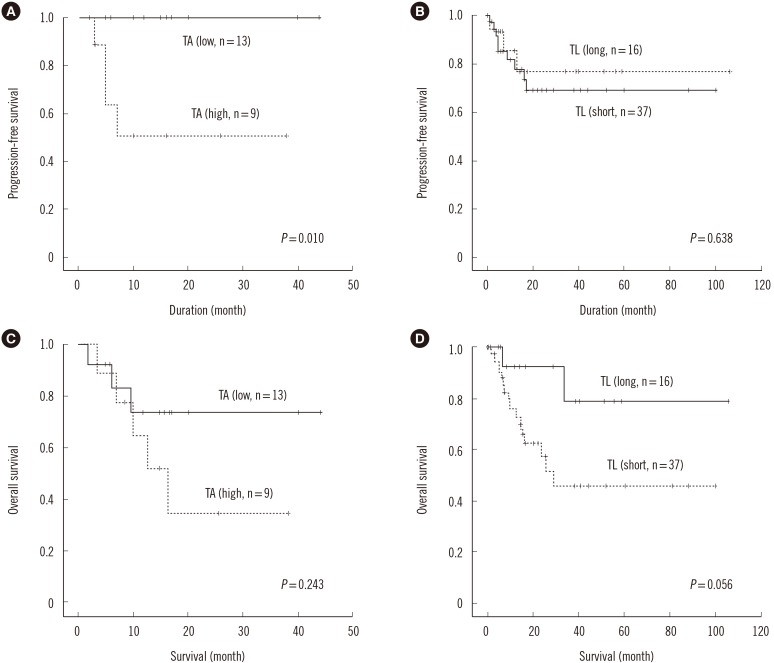
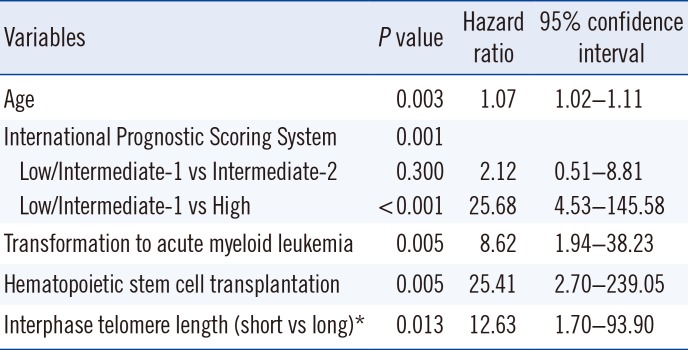
The data of 53 MDS patients were included in the survival analysis. Of these patients, during the follow-up period, 12 underwent transformation to acute leukemia, and seven received hematopoietic stem cell transplants. The MDS patients were divided into two groups for interphase TL and TA assessments: long/high (greater than or equal to average) and short/low (less than average). The mean survival time was 20.1 months and 34.2 months in the high TA (n=9) and low (n=13) TA groups, respectively. The mean survival times for MDS patients from the short (n=37) and long (n=16) TL groups were 53.6 months and 88.5 months, respectively. In the 22 patients with measured TA values, there was a significant difference in progression-free survival between the high and low TA groups (P=0.010, Fig. 3A). However, no difference in progression-free survival was detected between the long and short TL groups (P=0.638, Fig. 3B). For the overall survival, there was no significant difference between high and low TA groups according to the log rank method (P=0.243, Fig. 3C). The overall survival rate of the short average TL group (<433) was shorter than that of the long TL group, with no statistical significance as determined by Kaplan-Meier survival analysis (P=0.056, Fig. 3D). Multivariate Cox regression analysis showed that older age, higher IPSS subtypes, transformation to AML, no hematopoietic stem cell transplantation, and short interphase TL were independent adverse prognostic factors (P=0.003, 0.001, 0.005, 0.005, and 0.013, respectively) (Table 3).
DISCUSSION
The aim of this study was to investigate TL and TA and their prognostic significance in MDS patients. Simultaneous analysis of TLs in the interphase nuclei and in the chromosome arms of metaphase cells using QFISH showed that the interphase TL was shorter in MDS patients than in normal controls and was negatively correlated with metaphase TL. TA and interphase TL were not significantly different among WHO and IPSS subtypes, and did not correlate with each other. Regarding prognostic implications, patients with shorter interphase TLs (<average TL of MDS) showed a tendency toward shorter survival times, whereas a higher TA was significantly related to shorter progression-free survival.
TL and TA have been studied extensively in MDS patients to elucidate its pathophysiology and the factors contributing to its progression to acute leukemia [711121314182627]. In these studies, TL was evaluated by Southern blot analysis or quantitative PCR with DNA, and TA was determined by the conventional TRAP method.
In the present study, we measured interphase and metaphase TLs to observe changes in TL between quiescent (interphase) and proliferating (metaphase) cells, which may shed light on the telomere dynamics of MDS. In addition, TA was measured by real-time quantitative PCR.
To date, no study has measured interphase and metaphase TLs using QFISH or evaluated the relationship between metaphase and interphase TL. Interphase TL, if shorter than the average TL in MDS patients, was found to be a poor prognostic factor for survival, whereas metaphase TL was not. The average metaphase TL, especially the TL of the p-arm, showed negative correlation with the interphase TL. We presume that patients with shorter interphase TLs harbor metaphase cells with higher proliferative activity levels, which are represented by longer metaphase chromosome TLs. Once the actively proliferating and dividing cells reach a certain critical TL, they might enter a quiescent state; thus, we can detect these shorter TLs in interphase nuclei.
The limitation of the metaphase analysis in the present study is that the number of metaphase cells that could be evaluated from each patient was inadequate. Therefore, the heterogeneity of TLs in MDS patients and the differences in TLs between malignant and normal clones were not clearly observed. Nevertheless, a recent study showed that TL, as determined by QFISH, did not vary between abnormal and normal clones in MDS patients [11], suggesting that it was acceptable to study malignant and normal clones together. In a previous study of metaphase TL in MDS, a significantly longer chromosome 7 p- or q-arm TL was observed in isolated monosomy 7 [11]; however, since there was only one patient with monosomy 7 in the present study, this finding could not be confirmed. Other chromosomal abnormalities such as trisomy 8 or del(20q) had no effect on the metaphase TL. To assess telomere dynamics, an analysis of larger numbers of metaphase cells from each patient may help to strengthen the present findings.
From a practical perspective, interphase TL measurement has several advantages over metaphase TL measurement: 1) no karyotyping is required; 2) more cells can be evaluated, which would be more representative of the disease state; and 3) the analysis is less labor-intensive and less time-consuming.
There was a weaker correlation between TL and age in MDS patients than in the controls, which is consistent with other reports [111318]. The patients' interphase TLs were not correlated with age but were shorter than those of the controls, suggesting that the genomic instability of the disease is associated with dysregulation of TL maintenance [2328]. Although many previous studies have shown shortened telomeres in advanced subtypes of MDS [141827], no differences in TL or TA were found among the clinical subtypes of MDS [11]. In the present study, TA appeared to be slightly higher in the RAEB-2 group in a clinically advanced stage, but this difference did not reach statistical significance (P=0.065). However, patients with high TA showed a significantly shorter interval for transformation to acute leukemia (P=0.010), suggesting high TA as a poor prognostic marker in MDS, which is similar to AML, in which a high TA has been suggested as a poor prognostic marker [2930]. Moreover, short interphase TL was found to be an independent adverse prognostic factor, with no significant correlation with well-known clinical staging systems. MDS patients showed shorter TLs compared with controls, but among the MDS patients, those with short interphase TLs showed reduced survival times.
In conclusion, the short TL of interphase cells and the high TA can potentially be used as an independent adverse prognostic factor for MDS patients. Automated measurement of TL using a digital image analyzer is useful and convenient, suggesting a possible application for MDS prognosis prediction.
 XML Download