

 PDF
PDF ePub
ePub Citation
 Print
Print


INTRODUCTION
The majority of patients with acute coronary syndrome (ACS) present to the emergency department (ED) because of chest pain [1], and both prompt diagnosis and risk stratification are crucial to start an appropriate treatment [2]. Therefore, application of current guidelines [134] with the use of high-sensitivity cardiac troponin I (hs-cTnI) measurement helps to expedite the ACS distribution of myocardial infarction and rule out differential distribution [567]. hs-cTnI assays represent an important advance with added sensitivity for cardiac myocyte necrosis [89].
Along with its diagnostic role for risk stratification in acute cardiac conditions, hs-cTnI can provide prognostic information on stable disease states. In addition, accurate risk stratification for the possible development of in-hospital death or other severe life-threatening complications is desirable. High-sensitivity Troponins assays can detect minute levels of myocyte necrosis [10]. Moreover, there are several proposed mechanisms of troponin release that are not related to necrosis, including apoptosis, cellular release of proteolytic products, increased cell wall permeability with stress or stretch, and the production of membranous blebs that contain troponin [11]. Although the conventional sensitivity assays are specific for myocyte necrosis, hs-cTnI assays also show high specificity. Furthermore, there is a considerable amount of evidence to indicate that increasing values of hs-cTnI (and perhaps changes in values over time) correlate with the risk of adverse cardiac events [1213]. There is an international consensus on the role of elevated troponins as predictors of adverse outcomes in patients with ACS during short- and long-term follow-ups [14]. One study showed that troponin measured with a high-sensitivity assay was a more robust predictor of cardiovascular death at 1-yr follow-up in patients presenting to the ED with chest pain compared with the conventional troponin assay [15].
Furthermore, the soluble isoform of suppression of tumorigenicity 2 (sST2) has been proposed as a prognostic marker of mortality in patients with ACS [1617181920212223]. Circulating sST2 levels appear to be linked to the presence of adverse cardiac remodeling due to tissue fibrosis overproduction in response to ACS [1718]. Indeed, sST2 elicits a cardio-protective response to cardiac disease or injury such as an acute cardiac ischemic event [1920]. The loss of a correct transduction of interleukin (IL)-33/ST2L signaling leads to uncontrolled cardiac remodeling accompanied by hypertrophy of the myocytes and fibrosis with worsening of left ventricular function [24]. As a result, the heart is subjected to greater stress in the presence of high levels of sST2; thus, high levels of sST2 are associated with an increased risk of mortality in patients with myocardial infarction [18212223]. The predictive role of sST2 for risk of death in ACS differs between patients diagnosed with non-ST elevation myocardial infarction (NSTEMI) and ST elevation myocardial infarction (STEMI) and between assessments of short-term (30-day) and long-term (>1 yr) follow ups [16171825]. However, there are no data available on the value of sST2 compared with hs-cTnI measurements on ED admission for the prediction of early cardiovascular-related death. Therefore, the aims of this study were first to evaluate the prognostic roles of circulating levels of sST2 and hs-cTnI for the 30-day mortality in patients presenting to the ED with chest pain, and then to compare the prognostic role of sST2 and hs-cTnI in the STEMI and NSTEMI patient subgroups. In addition, the proposed sST2 cut-off point of >35 ng/mL as a prognostic risk factor in heart failure [26] was evaluated. Overall, this study should help to best identify ACS patients with a high risk of short-term cardiovascular-related death.
METHODS
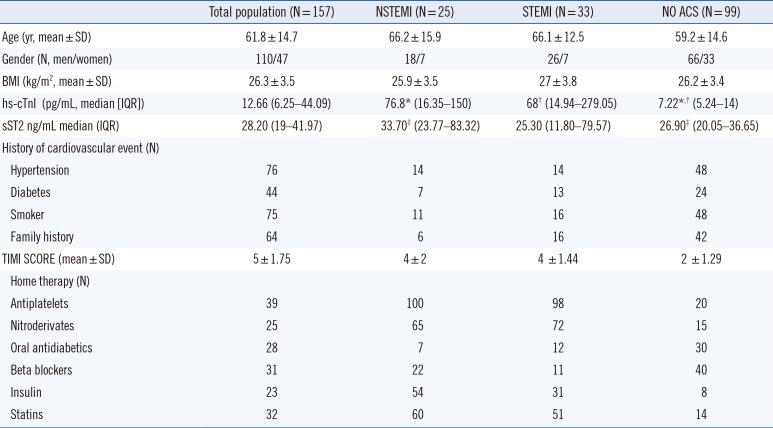
This was a prospective observational study performed in the ED of Sant'Andrea Hospital in Rome, Italy, from January 2012 to January 2013. The study was approved by Ethical Committee of Sant'Andrea Hospital. A total of 157 (110 men/47 women) patients presenting to the ED for chest pain were enrolled. Ten patients were lost to follow-up (they did not answer the phone call; three were NSTEMI patients and seven were NO ACS patients). Overall, the incidence of ACS was 37% (58 patients). In the ACS group, 57% (33 patients) had STEMI and 43% (25 patients) had NSTEMI. During the 30-day follow-up, of the 147 patients, 30 (20%) died (23 ACS, 7 NO ACS), and 117 (80%) were still alive. In the STEMI and NSTEMI groups, 12 and 11 patients had cardiovascular-related deaths at 30 days, respectively.
Patients' characteristics are described in Table 1. The inclusion criteria were: chest pain at rest, chest pain with effort, and atypical chest pain with a cardiovascular risk. The exclusion criteria were: chest pain due to trauma, chest pain associated with osteomuscular movements, and burning chest pain without cardiovascular risk. Each patient meeting the inclusion criteria was assigned a yellow code at admission. The mean time of presentation to the ED from the start of symptoms was 2 hr. The mean time elapsed after the assignment of the yellow code to the triage work station was 5 min. The following parameters were examined and recorded for each patient at admission in the ED: anamnestic data, physical examination, evaluation of vital parameters, venous blood sample for routine laboratory exams (including hs-cTnI at admission and at 2 hr after admission), and for detection of copeptin, sST2, neutrophil gelatinase-associated lipocalin (NGAL), and brain natriuretic peptide (BNP), chest X-rays. Electrocardiogram (EKG) was performed within 10 min after ED arrival. The management of patients with chest pain was performed according to the European Society of cardiology (ESC) guidelines for the management of ACS and chest pain, and any significant treatment modality between favorable and unfavorable groups was performed according to these guidelines [13427]. A 30-day follow-up phone call was made with the aim of recording any adverse cardiovascular-related events (death) that occurred after discharge. On the basis of the final diagnosis, patients were subdivided into two groups: ACS and NO ACS groups. ACS patients were further subdivided into patients diagnosed with STEMI and those diagnosed with NSTEMI. The in-hospital management of ACS was performed according to current guidelines [134].
1. sST2 assay
A peripheral venous blood sample was taken from each patient, which was collected in heparinized tubes and spun for 15 min at 3,500g with cooling during centrifugation. Samples were separated into 500-µL aliquots and immediately frozen at -40℃ until the assay was performed. The sST2 assay (Presage ST2 Assay, Critical Diagnostics, San Diego, CA, USA) is a quantitative sandwich monoclonal ELISA [28]. Diluted plasma (diluted 50-fold with the sample diluent) was loaded into appropriate wells in an anti-ST2 antibody-coated plate and incubated for the prescribed time. Following a series of steps in which the reagents were washed from the plate, and additional reagents were added and subsequently washed out, the analyte was finally detected by the addition of a colorimetric reagent, and the resulting signal was measured spectroscopically at 450 nm. According to the manufacturer instructions, the 99th percentile of the cut-off is 18.8 (14.5-25.3) ng/mL. The coefficient of variation (CV) of the assay is about 5% [28].
2. hs-cTnI assay
Peripheral venous blood samples were withdrawn from each patient, and the 10-mL blood samples in heparinized tubes were sent to our central hospital laboratory for measurement of hs-cTnI, which is a routine screening diagnostic test performed in real time at our ED for suspected cases of ACS. The ARCHITECT STAT High Sensitive Troponin I assay (Abbott Laboratories, Abbott Park, IL, USA) is a chemiluminescent microparticle immunoassay for the in vitro quantitative determination of cardiac troponin I, and can be used with the Abbott ARCHITECT i2000SR and i1000SR analyzers [29]. Results are available within 16 min. The ARCHITECT STAT High Sensitive Troponin I assay kit can detect troponin I in 96% of the reference population, and has a recommended 99th percentile cut-off of 26.2 pg/mL. The manufacturer's instructions also state a 99th percentile cut-off of 34.2 pg/mL for men and 15.6 pg/mL for women [30].
3. Statistical analysis
Continuous variables are expressed as mean±SD or median (interquartile range [IQR]) according to whether the data followed a normal or non-normal distribution, respectively. Categorical variables are expressed as percentages (%). Statistical differences between groups were compared by using the chi-square test for categorical variables and the Student t-test or U Mann-Whitney test for continuous variables. Univariate and multivariate analysis were used to identify candidate variables for entry to a multivariable logistic regression model in order to select the variables most predictive of patient outcomes. We included the following variables of the patients' baseline characteristics: body mass index (BMI), diabetes, family history of cardiovascular diseases, age, onset time before ED presentation, tobacco smoking, hypertension, thrombolysis in myocardial infarction (TIMI) score, log BNP, log copeptin, log NGAL, acute treatment, sST2, and hs-cTnI. Levels of sST2 and hs-cTnI were normalized by log transformation. Thus, the odds ratios (ORs) refer to a 10-fold increase in the levels of these markers. Receiver operating characteristic(ROC) curves were plotted, and the area under the curve (AUC) was estimated to demonstrate the optimal cut-off points of sST2 and hs-cTnI levels for prognosis evaluation on the basis of events and to establish appropriate sensitivity and specificity. P values of<0.05 from two-sided tests were considered significant. All statistical analyses were performed by using Medcalc version 12.1.4 software (Medcalc Software, Mariakerke, Belgium).
RESULTS
1. Distribution of the biomarkers
The median hs-cTnI [IQR] levels in the NO ACS and in the ACS groups are described in Fig. 1A. The median [IQR] hs-cTnI leveld in NSTEMI patients and in the STEMI patients are described in Fig. 1B. The median sST2 [IQR] values in the NO ACS and in the ACS patients are described in Fig. 1C. In the NSTEMI and STEMI groups, the median (IQR) sST2 levels are described in Fig. 1D. There was no significant difference in sST2 levels between the STEMI group and the NO ACS group (P=0.72). By contrast, there was a significant difference in sST2 levels between the NSTEMI group and NO ACS group (P<0.04) (Fig. 1D).
2. Prognostic results of the biomarkers
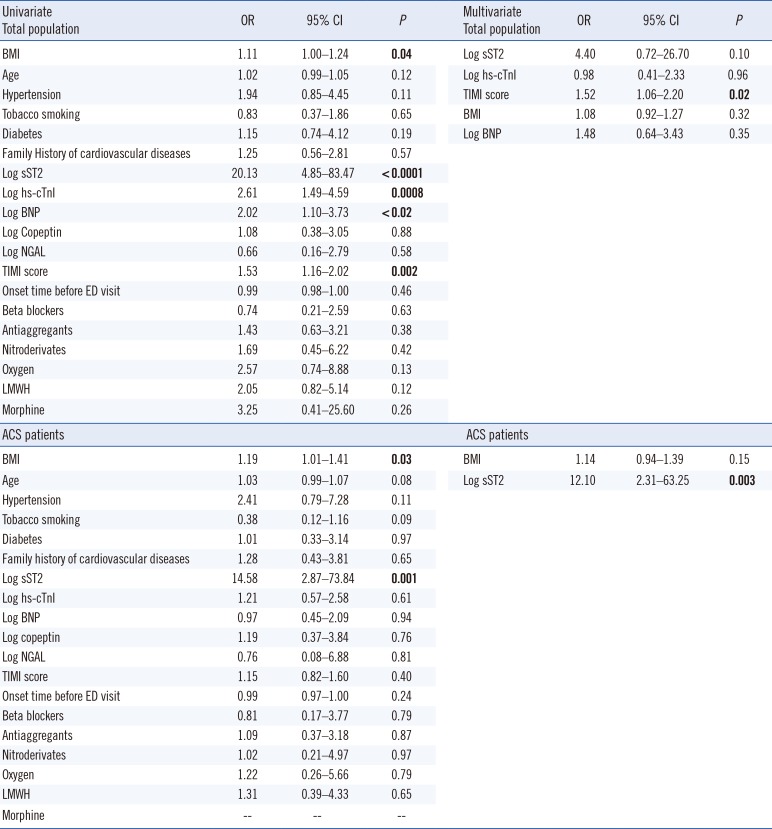
Considering the entire study population, of all clinical and demographic characteristics, sST2 (OR 20.13, 95% confidence interval [CI] 4.85-83.47, P<0.0001) and hs-cTnI (OR 2.61, 95% CI 1.49-5.59, P=0.0008) independently predicted death at 30-day follow-up along with BMI (OR 1.11) and TIMI score (OR 1.53) in univariate analyses, and sST2 (OR 8.03, 95% CI 1.37-47.02, P=0.02) and TIMI score (OR 1.34, 95% CI 0.99-1.82, P=0.05) were the most predictive variables in the multivariate model (Table 2). Univariate and multivariate regression analyses in ACS patients showed the high independent predictive power of only sST2 (univariate: OR 14.58; multivariate: OR 12.10) for the risk of cardiovascular events (Table 2).
3. ROC curve analysis for hs-cTnI and sST2
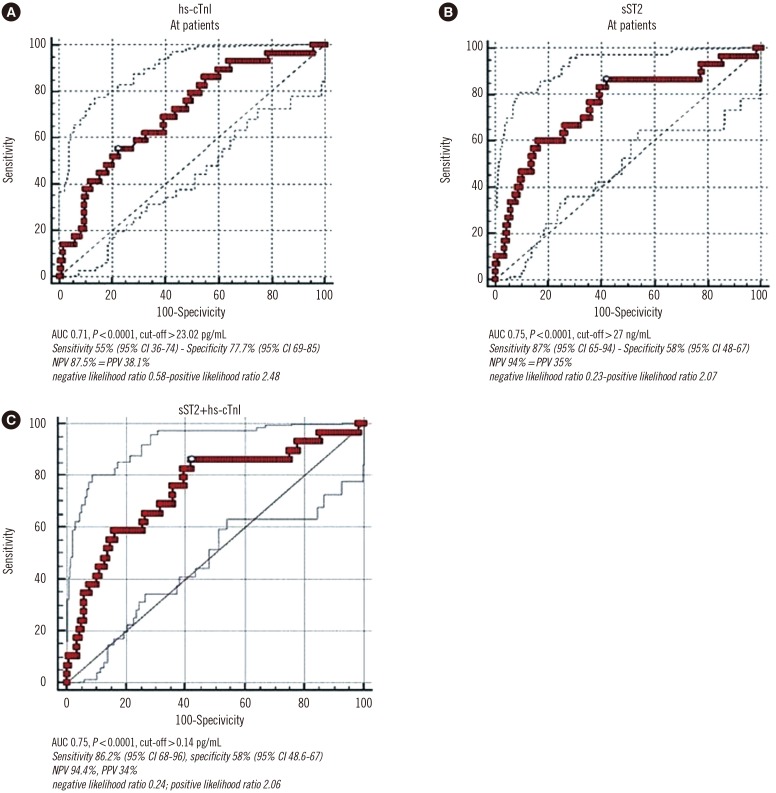
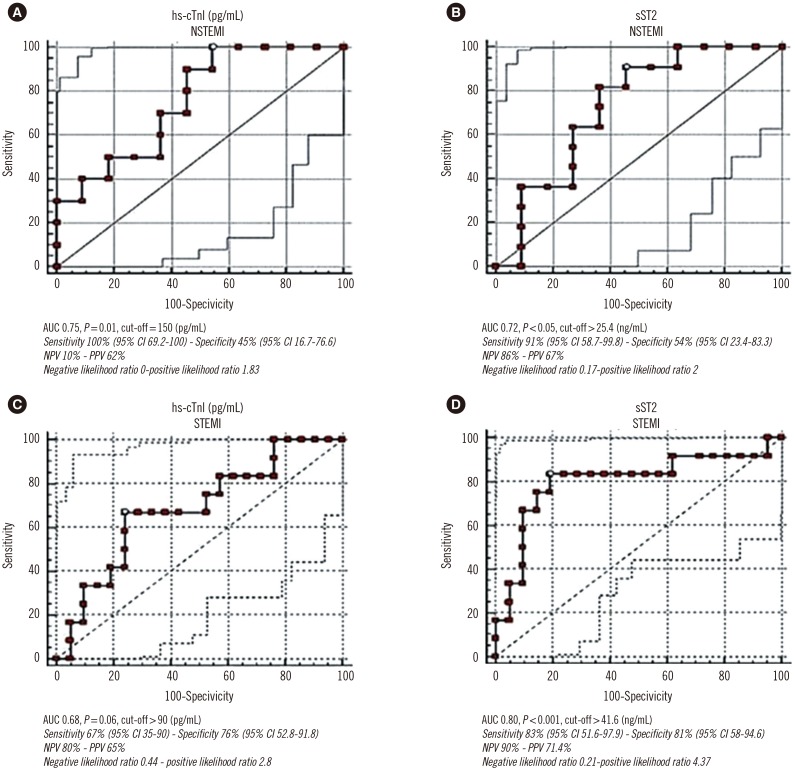
In the total population, the ROC curve for predicting the 30-day mortality with hs-cTnI and sST2 is described in Fig. 2A and B. In the total population, the predicted probability from the binary logistic model combining the two markers yielded an AUC of 0.75 (95% CI 0.67-0.81, P<0.0001), which matched that of sST2 alone (Fig. 2C). Considering only the NSTEMI patients, the hs-cTnI AUC for predicting the 30-day mortality was 0.75 (95% CI 0.52-0.91, P=0.01) and the sST2 AUC was 0.72 (95% CI 0.49-0.89, P<0.05) (Fig. 3A, B). In the STEMI patients, the ROC curve AUC of hs-cTnI was 0.68 (95% CI 0.49-0.83, P=0.06) and that of sST2 was 0.80 (95% CI 0.62-0.92, P<0.001) (Fig. 3C, D).
4. hs-cTnI and sST2 in ACS patients
In ACS patients, the median (IQR) hs-cTnI level was 59.5 (17.5-189) pg/mL in the no-events group and was 91.65 (16.35-150) pg/mL in the events group (P>0.05). The median (IQR) sST2 value was 19.92 (11.29-45.54) ng/mL in the no-events group and was 77.8 (38.18-104.62) ng/mL in the events group (P<0.0005). Within the ACS patients, those in the STEMI group showed a median (IQR) hs-cTnI level of 21 (10.32-81) pg/mL in the no-events group and 101.55 (35.80-1104) pg/mL in the events group (P<0.02). In the same group, the median (IQR) sST2 value was 18.7 (10.86-37.04) ng/mL in the no-events group and 80.86 (54.65-136.03) ng/mL in the events group (P<0.002). In NSTEMI patients, the median (IQR) hs-cTnI level was 144 (35.98-240) pg/mL in the no-events group and was 76.8 (17.31-105.7) pg/mL in the events group (P=0.13). In the same group, the median (IQR) sST2 value was 25.4 (12.58-72.35) ng/mL in the no-events group and was 69.8 (48.02-101.87) ng/mL in the events group (P<0.05).
5. Prognostic cut-off sST2 value in ACS patients
We considered the internationally recommended cut-off value of sST2 of 35 ng/mL, which is recognized as a prognostic factor in heart failure patients [26], and evaluated the events (i.e., deaths) on the basis of this cut-off. Among the STEMI patients in follow-up (n=33), 16 patients had an sST2 value>35 ng/mL, and nine of these patients died during the 30-day follow up. By contrast, 17 STEMI patients had an sST2 value<35 ng/mL, and only three of these patients died during follow up. In the univariate analysis, an sST2 value>35 ng/mL in STEMI patients showed highly significant predictive power for the risk of events, with an OR of 12.5 (95% CI 2.08-74.81, P=0.005). Among the NSTEMI patients in follow-up (n=22), nine patients had an sST2 value >35 ng/mL and seven of these patients died during the 30-day follow-up. Among the 13 NSTEMI patients with an sST2 value<35 ng/mL, four patients died. In the univariate analysis, an sST2 value>35 ng/mL showed low and non-significant predictive power for cardiovascular-related deaths in NSTEMI, with an OR of 3.06 (95% CI 0.53-17.49, P=0.20).
DISCUSSION
In accordance with data from the literature, our study confirmed that in patients presenting to the ED with chest pain, sST2 has no significant distribution value for ACS [172331]. This is consistent with the fact that elevations of sST2 are not specific for acute myocyte cell death, but rather reflect a non-specific inflammatory response, as demonstrated in patients with asthma or autoimmune diseases [32]. Data from literature showed that BNP elevation in patients with ACS independently predicted the development of heart failure and all-cause mortality [33]. In our study, BNP was not predictive for ACS patients, although in the univariate analysis, BNP was predictive for cardiovascular events caused by the comorbidities presented in the study population.
Our data suggested that sST2 could be considered a powerful independent predictor for death within 30 days after admission, both in the total population presenting to the ED with chest pain and in ACS patients. The present results showed that in ED patients with chest pain, sST2 and hs-cTnI were independent parameters for predicting cardiovascular-related deaths at 30-day follow-up compared with the other parameters included in the univariate and multivariate analyses, such as BMI, diabetes, TIMI score, and family history of cardiovascular diseases (Table 2). To our knowledge, this predictive value of sST2 in patients with chest pain in the ED has not been described to date. This role could be linked to its better ability to reflect global cardiac stress compared with hs-cTnI.
In ACS patients, the two biomarkers seem to be equally effective in predicting cardiovascular-related deaths within 30 days after ED admission. Both the univariate and multivariate analyses in this group of patients showed that the log sST2 value was the most powerful predictive biomarker, compared with the TIMI score and log hs-cTnI value. Previous studies demonstrated that in both STEMI and NSTEMI patients, the pre-discharge sST2 level could serve as an independent predictive marker for the long-term risk of cardiovascular events [153435]. Moreover, our study demonstrated that the sST2 level at ED admission could be a good prognostic marker for 30-day mortality in both STEMI and NSTEMI patients (Fig. 3B-D). Recent studies showed contrasting results on the prognostic role of sST2 in ACS patients [16183134]. One study showed that sST2 level increased in patients with ACS than in patients with stable coronary artery disease and without ACS, and that sST2 levels were associated with mortality in patients with STEMI but not in patients with NSTEMI or stable angina [36]. Cytokines from damaged tissues may activate neighboring cells to produce sST2. sST2 has also been shown to regulate the expression of proinflammatory cytokines from macrophages, which may help prevent uncontrolled inflammatory reactions in myocardial infarction and are a prerequisite for healing and scar formation [22]. sST2 may contribute to this process and could be responsible for myocardial fibrosis and cardiac remodeling, which could affect prognosis after an episode of ACS [37].
To improve risk stratification of a patient with ACS in the ED, it is important to establish a standardized cut-off value of sST2. Some studies showed that heart failure patients with sST2 levels above a clinical threshold of >35 ng/mL have a much higher risk of mortality [26]. A recent study showed that NSTEMI patients are at a higher risk of adverse outcomes at 30 days when sST2 levels are above the cut-off value of 35 ng/mL [17]. Our study confirmed this finding; in fact, the sST2 cut-off value of 35 ng/mL could distinguish the high number of patients that died within 30 days from those who were alive (no events) in both STEMI (OR 12.5) and NSTEMI (OR 3.06) patients. In the ED, establishment of a reliable cut-off value to identify a patient that is likely to suffer from a major cardiovascular event (i.e., death) in the short term after an episode of ACS is of fundamental relevance to initiate the correct form of prevention and avoid adverse outcomes. Therefore, the aim of a physician should be not only stabilization of the patient but also achievement of an optimal sST2 value for reducing the risk of death. As stated by Richards et al [25], the greatest prognostic power is achieved when sST2 levels are measured early in the post-infarction phase; therefore, blood samples should be acquired as soon as possible in the ED. In conclusion, in patients presenting to the ED with chest pain, the sST2 levels seem to have higher prognostic value for 30-day cardiac mortality compared with hs-cTnI. In patients with ACS, sST2 assessment at ED arrival also seems to have greater prognostic value for 30-day cardiac death compared with hs-cTnI. Therefore, compared with hs-cTnI, sST2 seems to be a useful tool to immediately detect patients at high risk of death within 30 days after hospital discharge in both STEMI and NSTEMI groups. The prognostic role of sST2 seems to increase when the cut-off value of >35 ng/mL is considered. Patients presenting to the ED with chest pain should be evaluated for sST2 levels immediately in order to identify the subgroup of subjects for whom a more intensive treatment strategy should be considered to avoid the occurrence of short-term cardiovascular death.

 XML Download