

 PDF
PDF ePub
ePub Citation
 Print
Print


INTRODUCTION
METHODS
1. KNHANES HDL-C assay
2. HDL-C comparison studies
3. Selection of appropriate calibration equation for each year using accuracy-based external quality assurance data
4. Statistical analysis
RESULTS
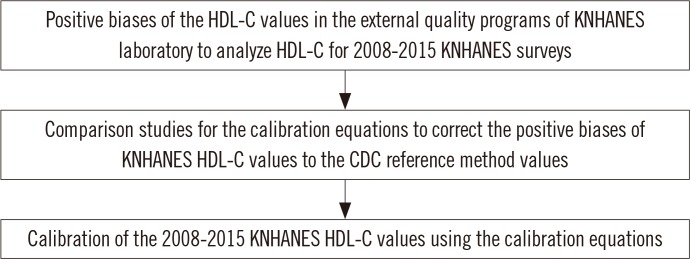 | Fig. 1Flow diagram for the study. Since positive biases ranging from 2.85% to 9.40% were observed in the external quality programs of KNHANES laboratory to analyze HDL-C for 2008-2015 KNHANES surveys, correction of the KNHANES HDL-C values from these years was necessary. Three calibration equations were derived by the comparison studies, which compared the HDL-C values at the KNHANES laboratory with those at the CRMLN laboratory in 2009, 2012, and 2015. The application of the calibration equations to the KNHANES HDL-C values in each year was determined on the basis of the external quality assurance results in the KNHANES laboratory.Abbreviations: HDL-C, high-density lipoprotein cholesterol; CDC, Centers for Disease Control and Prevention; KNHANES, Korea National Health and Nutrition Examination Surveys; CRMLN, Cholesterol Reference Method Laboratory Network.
|
1. KNHANES HDL-C comparison studies
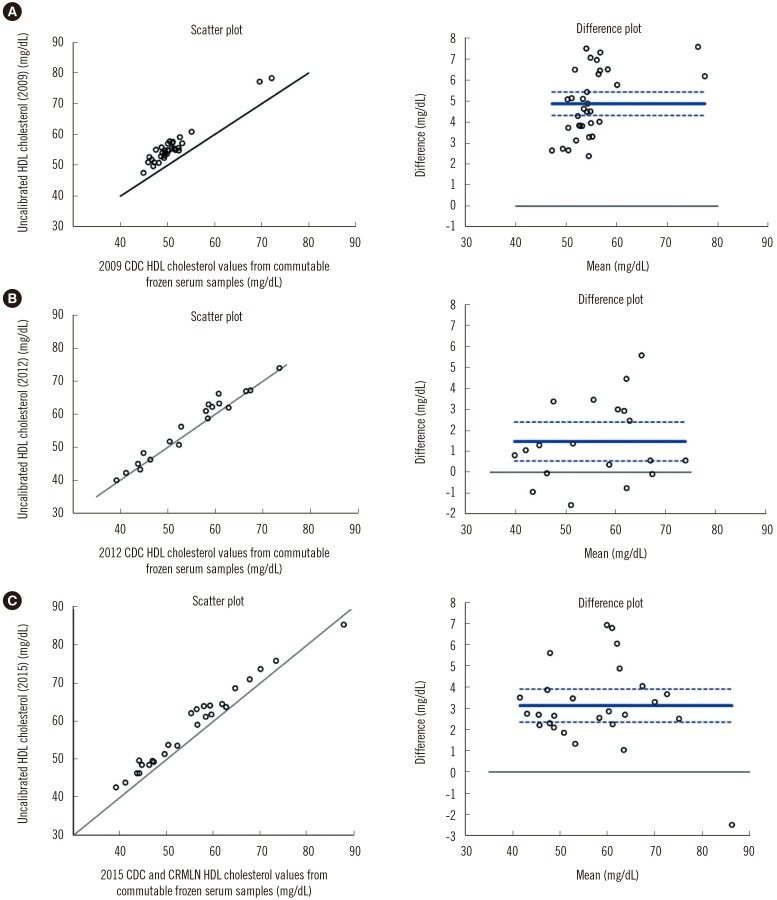 | Fig. 2High-density lipoprotein cholesterol (HDL-C) comparison study in 2009, 2012, and 2015. (A) Scatter plot and Bland-Altman plot of uncalibrated HDL-C (2009) and Centers for Disease Control and Prevention (CDC) reference laboratory HDL-C values from commutable frozen serum samples (mg/dL). (B) Scatter plot and Bland-Altman plot of uncalibrated HDL-C (2012) and CDC reference HDL-C. (C) Scatter plot and Bland-Altman plot of uncalibrated HDL-C (2015) and CDC and Cholesterol Reference Method Laboratory Network (CRMLN) reference HDL-C values. The solid line in the scatter plot is the line of identity (45 degree). The solid line in the Bland-Altman plot is the mean difference with 95% confidence interval (dotted lines); the solid line is drawn at zero.
|
Table 1
Summary statistics of the comparison studies for the calibration equations
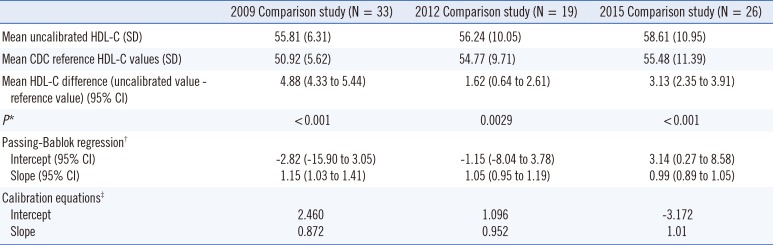
*Paired t-test of the hypothesis that the means are equal between uncalibrated HDL-C and CDC reference method values (mg/dL); †Passing-Bablok regression was done by uncalibrated HDL-C values as dependent variables (Y) and CDC reference method values as independent variables (X); ‡Calibration equations were derived by exchanging of the variables of Passing-Bablok regression (CDC reference method values as independent variables and uncalibrated HDL-C as dependent variables) for the correction of uncalibrated HDL-C values of KNHANES laboratory to the CDC reference method values.
Abbreviations: HDL-C, high-density lipoprotein cholesterol; CDC, Center for Disease Control and Prevention; CRMLN, Cholesterol Reference Method Laboratory Network; CI, confidence interval.
![]()
2. Selection of the appropriate calibration equation based on accuracy-based EQA data
Table 2
Determination of the need for correction of HDL-C value and its applicable period*
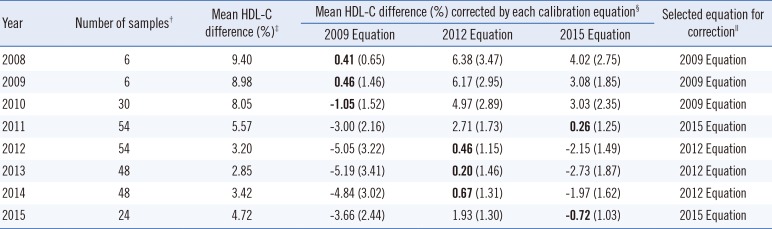
*The analysis was based on the results of external quality assurance programs including the Lipid Standardization Program (LSP) of the Center for Disease Control and Prevention (third quarter 2010-second quarter 2015), and the Accuracy-Based Lipid Survey (ABL) of the College of American Pathologists (2008-2012) in a laboratory, in which uncalibrated HDL cholesterol measurements were performed for the Korea National Health and Nutrition Examination Survey (KNHANES) during 2008-2015; †The number of samples was counted by the number of results of external quality assurance programs (LSP and ABL) to calculate the mean HDL-C difference (%); ‡Calculation formula: (uncalibrated value - reference value)/reference value×100; §Calculation formula is same as mean HDL-C difference (%). Each calibration equation of 2009, 2012, and 2015 was derived from the comparison studies of the HDL-C values between the NHANES laboratory and the CRMLN laboratory. Standard error of the mean HDL-C difference corrected was presented in the parenthesis. Standard Error=√1n∑(ˆyl-yi)2 ; ∥The calibration equation with the least standard error was selected for the correction each year.
Abbreviation: HDL-C, high-density lipoprotein cholesterol.
![]()
Table 3
Final calibration equations
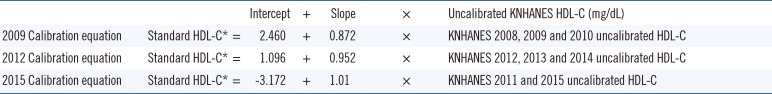
*Calibration equations were based on the serum HDL cholesterol (mg/dL) through calibration studies. The values of intercept and slope for each equation were calculated by converting the uncalibrated HDL-C (Y) and the CDC reference value (X) (mg/dL) from the original regression equations of the Passing-Bablok fit.
Abbreviations: KNHANES, Korea National Health and Nutrition Examination Survey; HDL-C, high-density lipoprotein cholesterol.
![]()
3. Distribution of the HDL-C values in KNHANES from 2008 to 2015
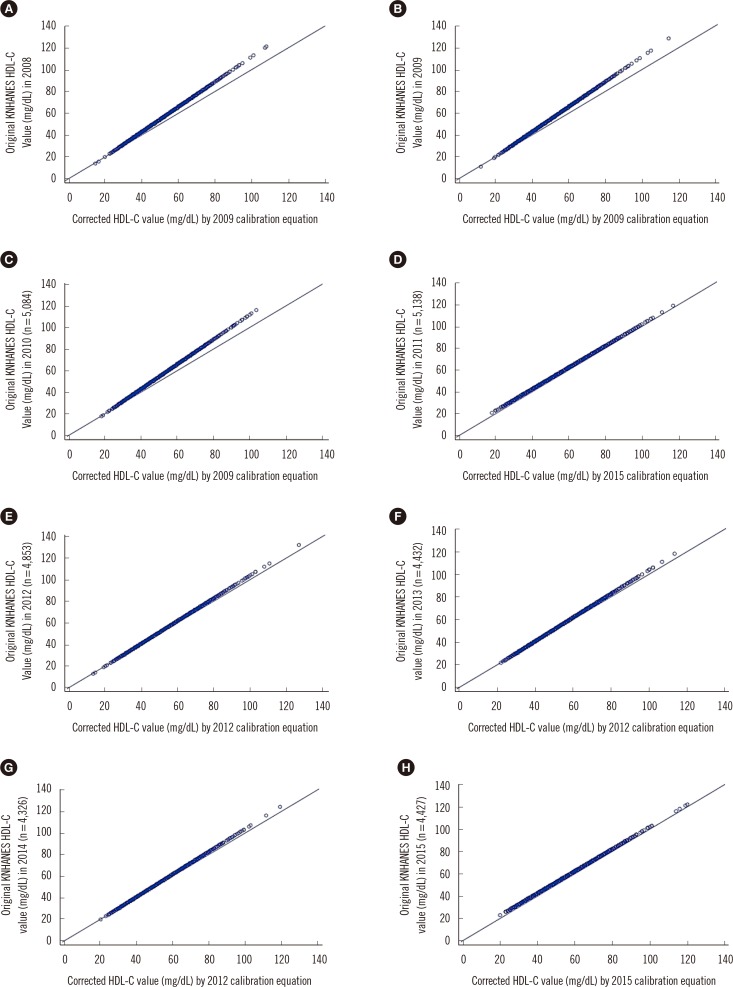 | Fig. 3Distribution of Korea National Health and Nutrition Examination Survey (KNHANES) 2008-2015 data for each year before and after data correction by calibration, expressed as a scatter plot. Calibration equations were used based on Passing-Bablok regression analysis. The mean value (mg/dL) of the original KNHANES HDL-C data with the corrected values by calibration equation in each year is shown (n is the number of results for the KNHANES participants above 30 yr of age). (A) The mean value of 50.6 (mg/dL) in KNHANES 2008 HDL-C data (n=5,530) was corrected to 47.6 (mg/dL) by the 2009 calibration equation. (B) The mean value of 51.3 (mg/dL) in KNHANES 2009 HDL-C data (n=6,001) was corrected to 47.2 (mg/dL) by the 2009 equation. (C) The mean value of 52.3 (mg/dL) in KNHANES 2010 HDL-C data (n=5,084) was corrected to 48.0 (mg/dL) by the 2009 equation. (D) The mean value of 52.5 (mg/dL) in KNHANES 2011 HDL-C data (n=5,138) was corrected to 49.8 (mg/dL) by the 2015 equation. (E) The mean value of 51.0 (mg/dL) in KNHANES 2012 HDL-C data (n=4,853) was corrected to 49.6 (mg/dL) by the 2012 equation. (F) The mean value of 51.5 (mg/dL) in KNHANES 2013 HDL-C data (n= 4,432) was corrected to 50.2 (mg/dL) by the 2012 equation. (G) The mean value of 52.0 (mg/dL) in KNHANES 2014 HDL-C data (n=4,326) was corrected to 50.6 (mg/dL) by the 2012 equation. (H) The mean value of 53.1 (mg/dL) in KNHANES 2015 HDL-C data (n=4,427) was corrected to 50.4 (mg/dL) by the 2015 equation.
|
 XML Download