This article has been
cited by other articles in ScienceCentral.
Dear Editor,
Acute promyelocytic leukemia (APL) is diagnosed by detection of
PML-RARA using reverse transcriptase (RT)-PCR, but reporting of results takes at least two days, and this situation is an obstacle for prompt management of patients. Treatment and disease course in APL are different from those in other AMLs because APL patients require all-
trans-retinoic acid (ATRA) for remission and for reducing the risk of disseminated intravascular coagulation (DIC), which is a dangerous complication of APL. Hence, treatment of APL with ATRA can be more important than starting chemotherapy in other AMLs, and rapid exclusion of APL from other AMLs is important, allowing for rapid implementation of appropriate treatment. Nonetheless, discrimination of APL from other AMLs by morphological evaluation can cause misdiagnosis in some cases with APL-like morphology. The recently launched Sysmex XN-3000 analyzer (Sysmex, Kobe, Japan) can show various cell population data (CPD), and some of these characteristics, e.g., NE-SFL [fluorescent light intensity of the neutrophil area on the WDF (white blood cell differential) scattergram] and NE-WY (fluorescent light distribution width of the neutrophil area on the WDF scattergram) provide useful information for detection of sepsis [
1]. We evaluated the performance of CPD items in peripheral blood (PB) for differential diagnosis of APL and other AMLs.
Ten APL patients and 21 patients with other AMLs diagnosed from July 2014 to December 2015 at Pusan National University Hospital, Korea were prospectively enrolled. Thirty-one PB samples obtained at diagnosis were analyzed on an XN-3000 analyzer. Demographic characteristics, complete blood cell counts (CBC) results, and 46 CPD items were compared between APL patients and other AML patients. For CPD items with significant differences, ROC curve analysis was performed to evaluate the performance in differential diagnosis of APL and other AMLs and to determine the best cutoff values for APL. Using these cutoff values, the sensitivity, specificity, negative predictive value (NPV), positive predictive value (PPV), and accuracy for each item were calculated. This study was approved by the institutional review board of Pusan National University Hospital.
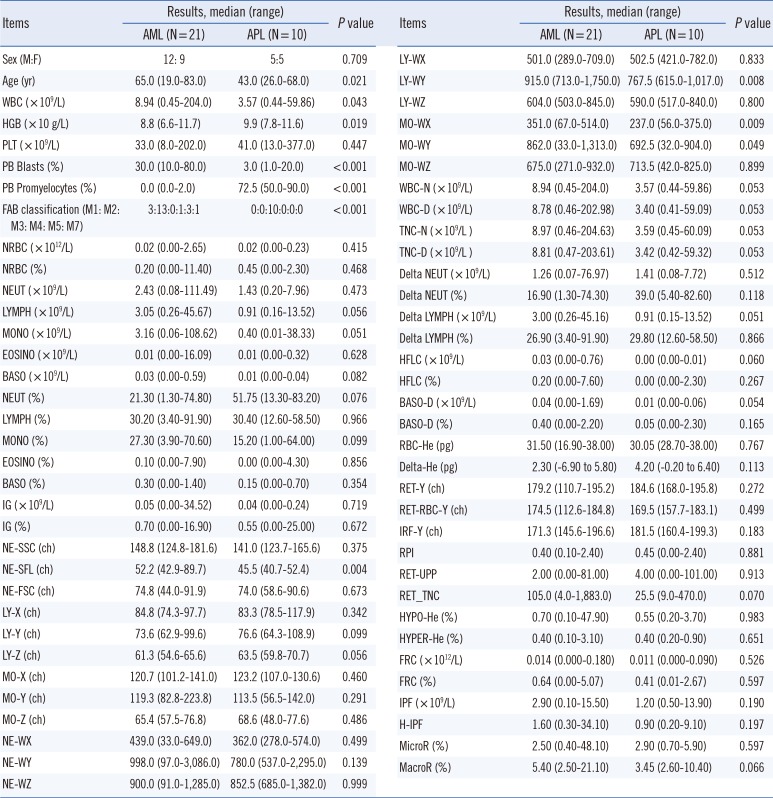
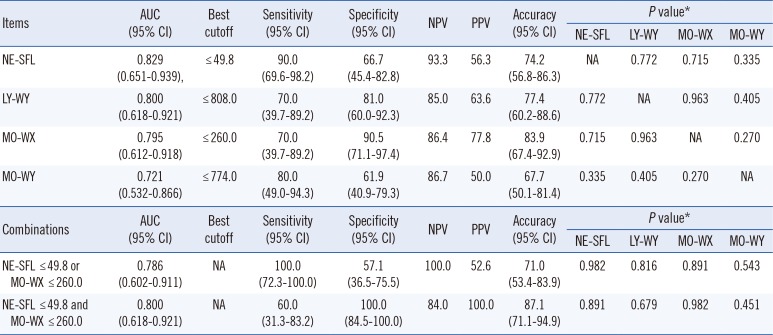
Results of APL patients showed significantly lower values on four CPD items [NE-SFL, LY-WY (fluorescent light distribution width of the lymphocyte area on the WDF scattergram), MO-WX (lateral scattered light distribution width of the monocyte area on the WDF scattergram), and MO-WY (fluorescent light distribution width of the monocyte area on the WDF scattergram)] compared with those of other AML patients (
Table 1). NE-SFL showed the greatest AUC (0.829) and higher sensitivity (90.0%) and NPV (93.3%) than other characteristics did in the discrimination of APL from other AMLs with the cutoff ≤49.8. In contrast, MO-WX showed higher specificity (90.5%), PPV (77.8%), and accuracy (83.9%) with the cutoff ≤260.0. Additional analysis revealed that the combination "NE-SFL ≤49.8 or MO-WX ≤260.0" shows the highest sensitivity (100.0%) and NPV (100.0%), whereas the combination "NE-SFL ≤ 49.8 and MO-WX ≤260.0" yields the highest specificity (100.0%) and PPV (100.0%) (
Table 2).
Low NE-SFL values may reflect increased infiltration of more mature granulocytes (such as promyelocytes) than myeloblasts because low fluorescence intensity indicates a low RNA/DNA ratio in more mature cells [
12]. APL involves abundant promyelocytes, and this situation may partly explain our results. Significantly lower MO-WX in APL patients may be the result of lower monocyte counts in APL (versus AML), as found in our study, possibly yielding small distribution width.
Clinically, rapid exclusion of APL from other AMLs may be more important than accurate confirmation of APL by more time-consuming diagnostic procedures. The present study showed that CPD items, NE-SFL and MO-WX, would be useful for the discrimination of APL from other AMLs, especially for rapid exclusion of APL with high sensitivity and NPV. The discriminating power of the PB promyelocyte count may be better, but the time benefit of the two CPD items may be greater. Thus, we hypothesize the use of NE-SFL and MO-WX as criteria for rapid exclusion of APL, not as diagnostic parameters, because we cannot diagnose APL without PML-RARA, even if NE-SFL and MO-WX are lower than cutoffs. The sample size here is small and therefore, our results should be regarded as a preliminary data, and more comprehensive research such as a multicenter study should be performed to confirm our preliminary results.
Table 1
Comparison of the routine and cell population data (CPD) items obtained on a XN-3000 automatic blood cell analyzer between patients with AML and those with acute promyelocytic leukemia (APL)
|
Items |
Results, median (range) |
P value |
|
Items |
Results, median (range) |
P value |
|
AML (N=21) |
APL (N=10) |
|
AML (N=21) |
APL (N=10) |
|
Sex (M:F) |
12:9 |
5:5 |
0.709 |
|
LY-WX |
501.0 (289.0–709.0) |
502.5 (421.0–782.0) |
0.833 |
|
Age (yr) |
65.0 (19.0–83.0) |
43.0 (26.0–68.0) |
0.021 |
|
LY-WY |
915.0 (713.0–1,750.0) |
767.5 (615.0–1,017.0) |
0.008 |
|
WBC (×109/L) |
8.94 (0.45–204.0) |
3.57 (0.44–59.86) |
0.043 |
|
LY-WZ |
604.0 (503.0–845.0) |
590.0 (517.0–840.0) |
0.800 |
|
HGB (×10 g/L) |
8.8 (6.6–11.7) |
9.9 (7.8–11.6) |
0.019 |
|
MO-WX |
351.0 (67.0-514.0) |
237.0 (56.0-375.0) |
0.009 |
|
PLT (×109/L) |
33.0 (8.0–202.0) |
41.0 (13.0–377.0) |
0.447 |
|
MO-WY |
862.0 (33.0–1,313.0) |
692.5 (32.0–904.0) |
0.049 |
|
PB Blasts (%) |
30.0 (10.0–80.0) |
3.0 (1.0–20.0) |
<0.001 |
|
MO-WZ |
675.0 (271.0–932.0) |
713.5 (42.0–825.0) |
0.899 |
|
PB Promyelocytes (%) |
0.0 (0.0–2.0) |
72.5 (50.0–90.0) |
<0.001 |
|
WBC-N ( × 109/L) |
8.94 (0.45–204.0) |
3.57 (0.44–59.86) |
0.053 |
|
FAB classification (M1: M2: M3: M4: M5: M7) |
3:13:0:1:3:1 |
0:0:10:0:0:0 |
<0.001 |
|
WBC-D (× 109/L) |
8.78 (0.46–202.98) |
3.40 (0.41–59.09) |
0.053 |
|
NRBC (×1012/L) |
0.02 (0.00–2.65) |
0.02 (0.00–0.23) |
<0.001 |
|
TNC-N ( × 109/L) |
8.97 (0.46–204.63) |
3.59 (0.45–60.09) |
0.053 |
|
NRBC (%) |
0.20 (0.00–11.40) |
0.45 (0.00–2.30) |
0.468 |
|
TNC-D ( × 109/L ) |
8.81 (0.47–203.61) |
3.42 (0.42–59.32) |
0.053 |
|
NEUT (×109/L) |
2.43 (0.08–111.49) |
1.43 (0.20–7.96) |
0.473 |
|
Delta NEUT (× 109/L) |
1.26 (0.07–76.97) |
1.41 (0.08–7.72) |
0.512 |
|
LYMPH (×109/L) |
3.05 (0.26–45.67) |
0.91 (0.16–13.52) |
0.056 |
|
Delta NEUT (%) |
16.90 (1.30–74.30) |
39.0 (5.40–82.60) |
0.118 |
|
MONO (×109/L) |
3.16 (0.06–108.62) |
0.40 (0.01–38.33) |
0.051 |
|
Delta LYMPH ( × 109/L) |
3.00 (0.26–45.16) |
0.91 (0.15–13.52) |
0.051 |
|
EOSINO (×109/L) |
0.01 (0.00–16.09) |
0.01 (0.00–0.32) |
0.628 |
|
Delta LYMPH (%) |
26.90 (3.40–91.90) |
29.80 (12.60–58.50) |
0.866 |
|
BASO (×109/L) |
0.03 (0.00–0.59) |
0.01 (0.00–0.04) |
0.082 |
|
HFLC (× 109/L) |
0.03 (0.00–0.76) |
0.00 (0.00–0.01) |
0.060 |
|
NEUT (%) |
21.30 (1.30–74.80) |
51.75 (13.30–83.20) |
0.076 |
|
HFLC (%) |
0.20 (0.00–7.60) |
0.00 (0.00–2.30) |
0.267 |
|
LYMPH (%) |
30.20 (3.40–91.90) |
30.40 (12.60–58.50) |
0.966 |
|
BASO-D (× 109/L) |
0.04 (0.00–1.69) |
0.01 (0.00–0.06) |
0.054 |
|
MONO (%) |
27.30 (3.90–70.60) |
15.20 (1.00–64.00) |
0.099 |
|
BASO-D (%) |
0.40 (0.00–2.20) |
0.05 (0.00–2.30) |
0.165 |
|
EOSINO (%) |
0.10 (0.00–7.90) |
0.00 (0.00–4.30) |
0.856 |
|
RBC-He (pg) |
31.50 (16.90–38.00) |
30.05 (28.70–38.00) |
0.767 |
|
BASO (%) |
0.30 (0.00–1.40) |
0.15 (0.00–0.70) |
0.354 |
|
Delta-He (pg) |
2.30 (−6.90 to 5.80) |
4.20 (−0.20 to 6.40) |
0.113 |
|
IG (×109/L) |
0.05 (0.00–34.52) |
0.04 (0.00–0.24) |
0.719 |
|
RET-Y (ch) |
179.2 (110.7–195.2) |
184.6 (168.0–195.8) |
0.272 |
|
IG (%) |
0.70 (0.00–16.90) |
0.55 (0.00–25.00) |
0.672 |
|
RET-RBC-Y (ch) |
174.5 (112.6–184.8) |
169.5 (157.7–183.1) |
0.499 |
|
NE-SSC (ch) |
148.8 (124.8–181.6) |
141.0 (123.7–165.6) |
0.375 |
|
IRF-Y (ch) |
171.3 (145.6–196.6) |
181.5 (160.4–199.3) |
0.183 |
|
NE-SFL (ch) |
52.2 (42.9–89.7) |
45.5 (40.7–52.4) |
0.004 |
|
RPI |
0.40 (0.10–2.40) |
0.45 (0.00–2.40) |
0.881 |
|
NE-FSC (ch) |
74.8 (44.0–91.9) |
74.0 (58.6–90.6) |
0.673 |
|
RET-UPP |
2.00 (0.00–81.00) |
4.00 (0.00–101.00) |
0.913 |
|
LY-X (ch) |
84.8 (74.3–97.7) |
83.3 (78.5–117.9) |
0.342 |
|
RET_TNC |
105.0 (4.0–1,883.0) |
25.5 (9.0–470.0) |
0.070 |
|
LY-Y (ch) |
73.6 (62.9–99.6) |
76.6 (64.3–108.9) |
0.099 |
|
HYPO-He (%) |
0.70 (0.10–47.90) |
0.55 (0.20–3.70) |
0.983 |
|
LY-Z (ch) |
61.3 (54.6–65.6) |
63.5 (59.8–70.7) |
0.056 |
|
HYPER-He (%) |
0.40 (0.10–3.10) |
0.40 (0.20–0.90) |
0.651 |
|
MO-X (ch) |
120.7 (101.2–141.0) |
123.2 (107.0–130.6) |
0.460 |
|
FRC (× 1012/L) |
0.014 (0.000–0.180) |
0.011 (0.000–0.090) |
0.526 |
|
MO-Y (ch) |
119.3 (82.8–223.8) |
113.5 (56.5–142.0) |
0.291 |
|
FRC (%) |
0.64 (0.00–5.07) |
0.41 (0.01–2.67) |
0.597 |
|
MO-Z (ch) |
65.4 (57.5–76.8) |
68.6 (48.0–77.6) |
0.486 |
|
IPF (× 109/L) |
2.90 (0.10–15.50) |
1.20 (0.50–13.90) |
0.190 |
|
NE-WX |
439.0 (33.0–649.0) |
362.0 (278.0–574.0) |
0.499 |
|
H-IPF |
1.60 (0.30–34.10) |
0.90 (0.20–9.10) |
0.197 |
|
NE-WY |
998.0 (97.0–3,086.0) |
780.0 (537.0–2,295.0) |
0.139 |
|
MicroR (%) |
2.50 (0.40–48.10) |
2.90 (0.70–5.90) |
0.597 |
|
NE-WZ |
900.0 (91.0–1,285.0) |
852.5 (685.0–1,382.0) |
0.999 |
|
MacroR (%) |
5.40 (2.50–21.10) |
3.45 (2.60–10.40) |
0.066 |
Table 2
ROC analysis results on the four cell population data (CPD) items with significant differences for discrimination of patients with acute promyelocytic leukemia from those with other AMLs
|
Items |
AUC (95% CI) |
Best cutoff |
Sensitivity (95% CI) |
Specificity (95% CI) |
NPV |
PPV |
Accuracy (95% CI) |
P value*
|
|
NE-SFL |
LY-WY |
MO-WX |
MO-WY |
|
NE-SFL |
0.829 (0.651–0.939), |
≤49.8 |
90.0 (69.6–98.2) |
66.7 (45.4–82.8) |
93.3 |
56.3 |
74.2 (56.8–86.3) |
NA |
0.772 |
0.715 |
0.335 |
|
LY-WY |
0.800 (0.618–0.921) |
≤808.0 |
70.0 (39.7–89.2) |
81.0 (60.0–92.3) |
85.0 |
63.6 |
77.4 (60.2–88.6) |
0.772 |
NA |
0.963 |
0.405 |
|
MO-WX |
0.795 (0.612–0.918) |
≤260.0 |
70.0 (39.7–89.2) |
90.5 (71.1–97.4) |
86.4 |
77.8 |
83.9 (67.4–92.9) |
0.715 |
0.963 |
NA |
0.270 |
|
MO-WY |
0.721 (0.532–0.866) |
≤774.0 |
80.0 (49.0–94.3) |
61.9 (40.9–79.3) |
86.7 |
50.0 |
67.7 (50.1–81.4) |
0.335 |
0.405 |
0.270 |
NA |
|
Combinations |
AUC (95% CI) |
Best cutoff |
Sensitivity (95% CI) |
Specificity (95% CI) |
NPV |
PPV |
Accuracy (95% CI) |
P value*
|
|
NE-SFL |
LY-WY |
MO-WX |
MO-WY |
|
NE-SFL ≤49.8 or MO-WX ≤260.0 |
0.786 (0.602–0.911) |
NA |
100.0 (72.3–100.0) |
57.1 (36.5–75.5) |
100.0 |
52.6 |
71.0 (53.4–83.9) |
0.982 |
0.816 |
0.891 |
0.543 |
|
NE-SFL ≤49.8 and MO-WX ≤260.0 |
0.800 (0.618–0.921) |
NA |
60.0 (31.3–83.2) |
100.0 (84.5–100.0) |
84.0 |
100.0 |
87.1 (71.1–94.9) |
0.891 |
0.679 |
0.982 |
0.451 |


 PDF
PDF ePub
ePub Citation
 Print
Print


 XML Download