

 PDF
PDF ePub
ePub Citation
 Print
Print


Hemoglobin interference is the most common cause of preanalytical errors in clinical laboratories [1234567]. It is mainly caused by in vitro processes such as incorrect acquisition and handling procedures that cause hemolysis [8]. To prevent Hb interference-related errors, each sample should be examined visually immediately after centrifugation. However, this is not realistic considering the high number of samples that need to be processed at any given time in a clinical laboratory. To overcome the inherent limitations of visual examination, the hemolysis index (H index) was developed to provide automated determination of potential interference in a sample using specific absorbance values [236]. The use of the H index for identification of error-prone samples is expected to improve the quality and efficiency of sample processing in clinical laboratories. In addition, it was reported that the frequency of the normal H index values of clinical samples from the outpatient department (OPD) is higher than that from the general ward (GW) or emergency room (ER) [9]. This finding suggests that the H index can be informative for assessing the correctness of the procedures for the acquisition and handling of blood samples in each type of a medical care unit. Thus, we aimed to develop a quality improvement indicator for detection of inappropriate procedures causing hemolysis in clinical samples using H index values of blood samples in a hospital.
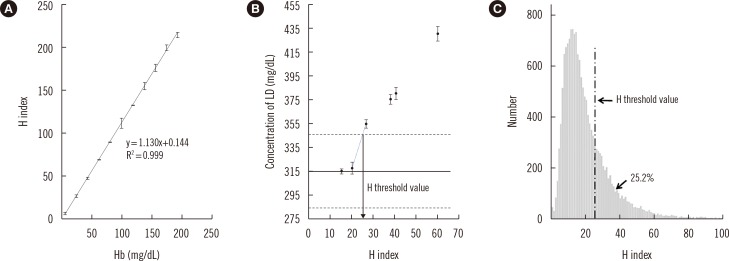
H index results from the Hitachi MODULAR Analytics system (Roche Diagnostics, Basel, Switzerland) were verified according to the Clinical Laboratory and Standards Institute guidelines C56-A [10] and revealed a linear relation with Hb concentration measured by spectrophotometry (UV-3600, SHIMADZU, Tokyo, Japan) (Fig. 1A). The lactate dehydrogenase (LD) assay, which is known to be strongly affected by hemolysis in a clinical sample [11], was chosen for the evaluation of interference related to hemolysis. For preparation of the test sample, whole blood from one healthy donor was divided into six aliquots, which were shaken for 0, 6, 12, 18, 24, and 30 sec, respectively, to obtain samples with varying degrees of hemolysis. The LD concentration was measured by using the Cobas Reagent (Roche Diagnostics) on the Hitachi MODULAR Analytics system, and the H index value was simultaneously obtained. The LD concentration in the samples increased proportionally with the increase in the extent of hemolysis (Fig. 1B). In the LD measurement, the threshold H index value was defined as the level corresponding to the point at which hemolysis induces a 10% bias, which is the allowable limit of bias suggested by the manufacturer [11]. The H index value was estimated to be 25 (Fig. 1B), which was used in this study as the threshold H index resulting in significant interference. Investigation of all requested clinical chemistry samples in one month (May 2015) revealed that 25.2% of the samples had an H index higher than the threshold value of 25 (Fig. 1C). This finding indicated that a substantial proportion of the samples are associated with a risk of significant analytical error.
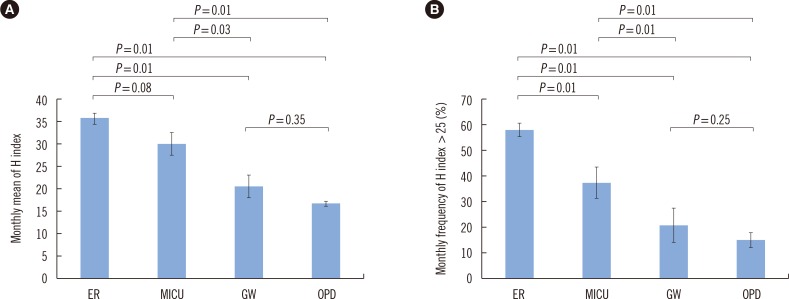
To develop a quality improvement indicator reflecting improper acquisition and handling of samples, we compared the monthly mean H index and the monthly frequency of clinical samples with an H index over 25 by the type of ward and time period. For the comparison of H index values among the types of ward, we analyzed 7,813 samples requested from the Division of Gastroenterology at Hallym University Sacred Heart Hospital from January to June 2015. The samples were grouped by the type of ward of origin: ER, medical intensive care unit (MICU), GW, and OPD. The data on each group are expressed as the mean of monthly results±SD. The differences among the four groups were analyzed by the Kruskal-Wallis test, and the difference within each pair of groups was analyzed by the Mann-Whitney test using the SPSS Statistics software, version 21 (IBM, Chicago, IL, USA), and Microsoft Excel (Microsoft Corporation, Redmond, WA, USA). Significance was determined with a P value threshold of 0.05 for a two-tailed test. The monthly mean H index differed significantly among the types of ward (P=0.01). The monthly mean H indices of the samples from the ER (36.1±2.23) and the MICU (30.2±5.64) were significantly higher than those of the samples from the GW (20.6±5.58, P=0.01 and P=0.03, respectively) or OPD (16.9±1.00, P=0.01 for both; Fig. 2A). There was no significant difference in the monthly mean H index between the ER and MICU and between the GW and OPD. The monthly frequency of samples with an H index >25 also differed significantly (P=0.01) among the types of ward in the following order: ER, 58.6±2.27%; MICU, 37.7±6.09%; GW, 21.2±6.42%; and OPD, 15.6±2.33%. In the pairwise comparison between groups, data within each pair differed significantly (P=0.01) except for the comparison between samples from the GW and OPD (Fig. 2B).
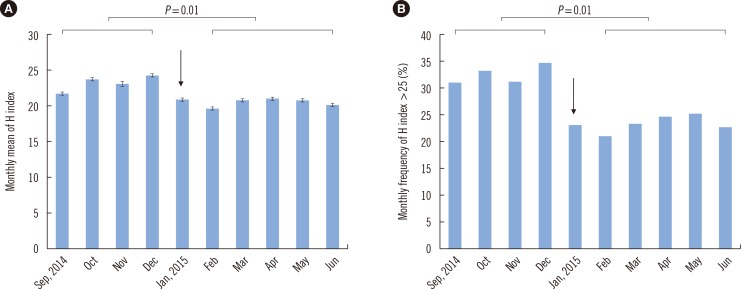
In the middle of the study period, a centrifuge in a clinical chemistry laboratory was replaced because of defective temperature control. We compared the H index values of 31,672 samples requested for routine chemistry tests before centrifuge replacement (4 months, from September to December 2014) to those of 53,604 samples tested after the replacement (5 months, from February to June 2015). Differences in the monthly mean H index and monthly frequency of samples with an H index >25 were analyzed by the Mann-Whitney U test. The monthly mean H index significantly decreased after centrifuge replacement (23.30±1.08 vs 20.6±0.58, P=0.01, Fig. 3A). The monthly frequency of the samples with an H index >25 also significantly decreased after the event (32.6±1.78% vs 23.4±1.69%, P=0.01, Fig. 3B). Both indicators clearly revealed differences in the risk of occurrence of inappropriately processed (hemolyzed) samples among the types of ward or the pathways of the sample processing, although the latter indicator seems to be more informative for the assessment of the risk.
Thus, we propose the use of the monthly mean H index and the monthly frequency of samples with an H index greater than the threshold value as quality improvement indicators. These novel indicators are easily deduced from the H index values of clinical samples, which are automatically obtained by means of chemical analyzers without additional reagents or costs. This method can be flexibly applied to each process pathway of samples in a clinical laboratory to identify the time and place of an inappropriate procedure. Broad adoption of these quality improvement indicators may help to develop effective quality improvement procedures in medical care units [12].
 XML Download