

 PDF
PDF ePub
ePub Citation
 Print
Print


INTRODUCTION
High-grade astrocytomas are the most common, and the most fatal, primary brain tumors, which occur in adults around the age of 50 yr [12]. Currently, the mean survival is 14.6 months for patients treated with temozolomide combined with radiotherapy, with a 2-yr survival rate of 26.5%, which has been slightly increasing over recent decades [3]. A number of investigations on prognostic factors are ongoing [24]. Intratumoral cytogenetic expression and radiological characteristics are also well-known factors that influence patient outcomes [567891011121314].
During investigation of prognostic factors related to karyotype in high-grade astrocytoma patients in our hospital, the peritumoral edema volume (PTEV) of the patients seemed to increase when the karyotype become more complex. Therefore, we further analyzed the relationship between cytogenetic complexity and PTEV.
In 2005, Lopez-Gines et al [14] reported that polysomy of chromosome 7 is related to EGFR amplification. Receptors such as vascular endothelial growth factor (VEGF), EGFR, and platelet-derived growth factor receptor (PDGFR) are factors associated with vascular permeability and angiogenesis, which play a significant role in the formation of peritumoral edema (PTE) [1516]. This EGFR mutation, which is related to chromosome 7 polysomy, could increase vascular permeability, finally leading to the expansion of PTE. A large proportion of patients in our study showed abnormalities in chromosome 7 along with EGFR amplification, suggesting a possible linkage between genetic complexity and PTE.
PTE, usually detected by initial radiological evaluation, has been reported as a significant prognostic factor. Schoeneggar et al [17] suggested to classify patients into two groups, minor (< 1 cm) and major edema (≥1 cm), according to the largest diameter of edema upon magnetic resonance imaging (MRI). They reported that patients with major edema showed significantly shorter survival compared with patients with minor edema.
Revealing associations between cytogenetic complexity, EGFR amplification, and PTEV could possibly help physicians determine the prognosis of the patients more precisely, considering abnormalities in chromosome 7 and EGFR amplification in high-grade astrocytoma.
METHODS
1. Patient information
The study was conducted retrospectively, based on the medical records and chromosomal analysis of 27 patients who visited Dong-A university medical center, Busan, Korea from 2007 to 2015 and newly diagnosed as having high-grade astrocytoma. For all patients, the initial diagnosis was made by MRI, followed by pathological confirmation of the intracranial mass achieved from surgical resection.
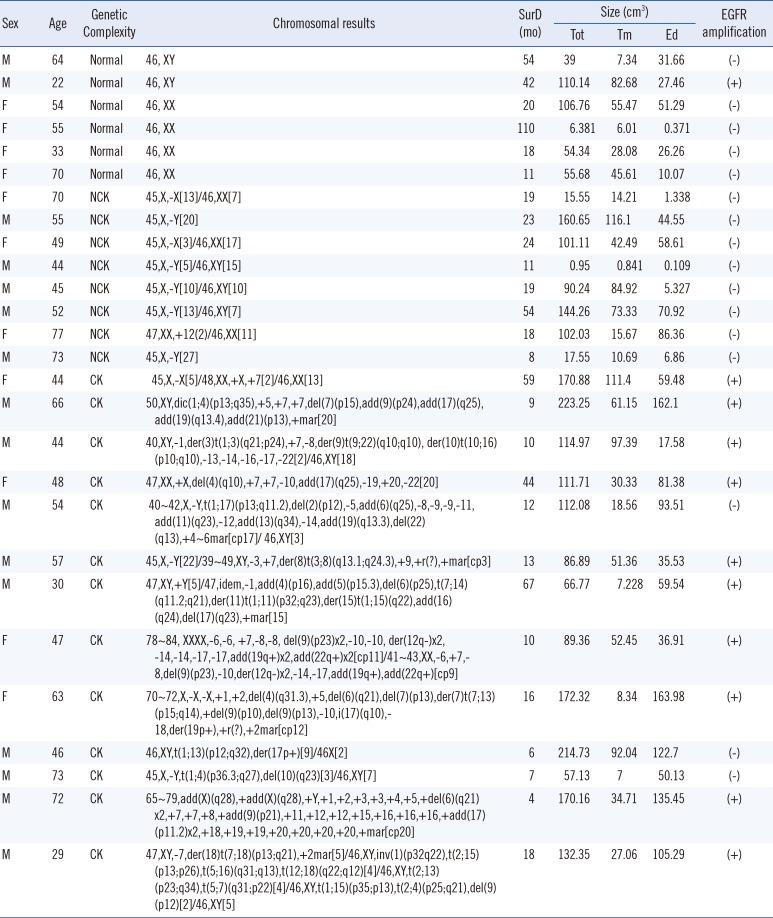
The categories of patient information for analysis contained age, gender, Karnofsky Performance Score (KPS), survival duration, pathological and genetic information of the tumor, PTEV, and abnormality of chromosomes (Table 1). All candidates underwent surgical resection, in which the maximal resection of the mass was attempted, followed by temozolomide combined with radiotherapy; the Stupp regimen [3].
2. Exclusion criteria
For more uniform data, high-grade astrocytomas occurring at the brain stem, periventricular area, or other deep parts of the brain were excluded, because location itself could directly affect the treatment outcome. Patients exhibiting glioblastoma with leptomeningeal seeding or patients over 80 yr were also excluded.
3. Karnofsky Performance Score and survival duration
KPS of the patients was evaluated preoperatively, postoperatively, and at three months after discharge. The survival duration was measured in months from the first diagnosis of the disease to the expiration of the patient.
4. Genetic analysis
Karyotype analysis was performed on short-term cultures (3-8 days) established from cells of surgically removed tumors. Tissue was selected by a skilled pathologist under sterile conditions, providing specimens without necrosis and more than 90% tumor tissue. Specimens were cultured and processed. Slides were stained with trypsin and Leishman's buffered solution for GLT-banding. The karyotypes were classified according to the International System for Human Cytogenetic Nomenclature (ISCN 2013).
An abnormal karyotype was defined as the results other than 46, XY or 46, XX. Cytogenetic complexity was classified according to the number of independent aberrations in one metaphase. If there were three or more independent aberrations, that specimen was categorized in the complex karyotype (CK) group. Samples with less than three aberrations were categorized in the non-complex karyotype (NCK) group.
5. EGFR amplification
FISH was performed on the Tissue Microarray (TMA) samples. Paraffin blocks were cut into 4-µm-thick sections. Sections were deparaffinized by xylene, incubated with 0.3% pepsin in 10 mM HCl at 37℃ for 10 min, boiled with citrate buffer (pH 6.0) in a microwave, incubated in 1M NaSCN for 35 min at 80℃, immersed in pepsin solution, and then fixed in 10% neutral buffered formalin. LSI EGFR/Chromosome enumeration probe (CEP)7 dual-color probe sets (Abbott Molecular, Des Plaines, IL, USA) were used for determining EGFR gene status. We applied the probe mixture to the slides and incubated the slides in a humidified atmosphere with HYBrite (Abbott Molecular) at 73℃ for 5 min for simultaneous denaturation of the probe and target DNA. Then, we changed the temperature to 37℃ for 19 hr to hybridize the probe and target DNAs. The slides were soaked in 0.4×SSC/0.3% NP-40 for 2 min at room temperature, followed by 2×SSC/0.1% NP-40 for 5 min at 73℃. Non-overlapping intact nuclei (100) were counted. EGFR FISH was performed by using previously published methods [18]. Amplification was applied only for EGFR hybridization and required that the overall mean EGFR/CEP7 ratio must be 1.2 or more and that 10% or more of nuclei had more than three EGFR signals.
6. Radiologic analysis
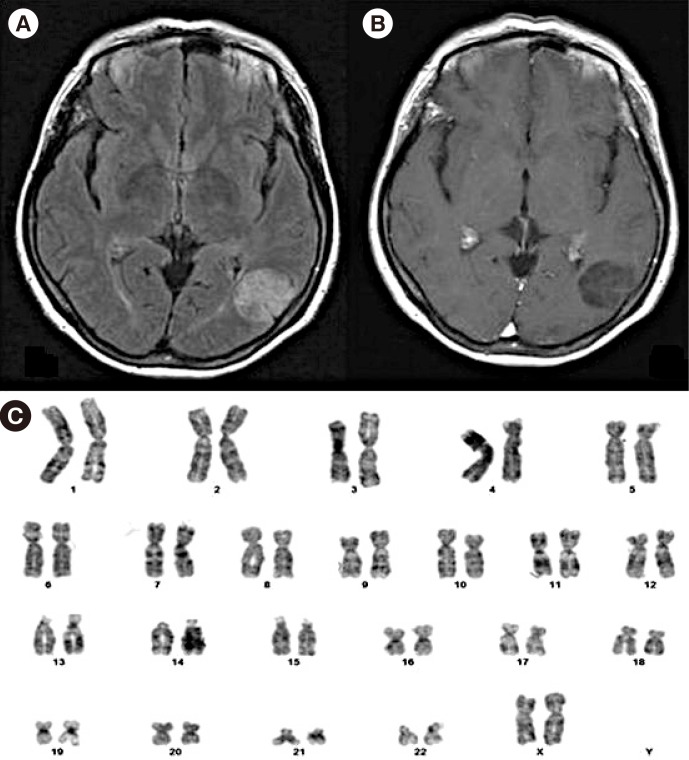
In addition, the size of PTE at the initial MRI of each patient was measured. The observer was blinded to molecular analysis results, and the subtraction of T2-FLAIR volume to the enclosed T1-enhancing volume was calculated. The high signal of T2-FLAIR images represents the total volume of tumor mass and PTE, and the enhanced margin in T1-enhancing images is considered the tumor mass itself. Each volume was manually measured by adding the region of interest (ROI) areas of each MRI slide. For further analysis of edema volume compared with tumor mass volume, the edema ratio was calculated by dividing tumor volume from edema volume.
7. Statistics
For statistical analyses, SPSS software (version 18.0; SPSS Inc., Chicago, IL, USA) was used. For evaluating relationship between cytogenetic abnormalities and various clinical factors (except for survival), a t-test was applied. Chi-square cross analysis was performed to determine the relationship between chromosome 7 abnormalities and EGFR amplification. For analysis with three variables, such as normal, NCK, and CK group comparisons, ANOVA was performed. The Kaplan-Meier method was applied to estimate survival as a function of time, and survival differences were analyzed by the log-rank test. For all statistical analyses, P values less than 0.05 were considered significant.
RESULTS
1. Chromosomal analysis
Among the 27 high-grade astrocytoma patients, 22 glioblastoma multiforme (GBM) and 5 anaplastic astrocytomas were identified. There were 16 and 11 male and female patients. The size of edema in the normal (n=6) and abnormal (n=21) chromosome groups were 24.52±17.73 cm3 and 66.48±50.23 cm3 (P =0.004), respectively, while the survival duration was 42.5±36.84 months in the normal group and 21.48±18.37 months in the abnormal group (P =0.129). The size of tumor mass, pre-op KPS, or post-op KPS showed no relationship to patients' karyotype.
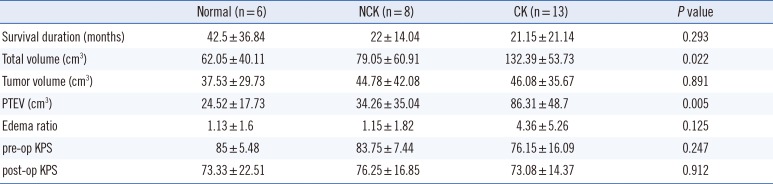
The subjects were further classified into three groups of normal, NCK, and CK in terms of the cytogenetic complexity. The number of patients in each group was six, eight, and 13, respectively. The mean edema size was 24.52±17.73 cm3 in the normal chromosome group, 34.26±35.04 cm3 in the NCK group, and 86.31±48.7 cm3 in the CK group (P =0.005) (Table 2).
2. EGFR amplification
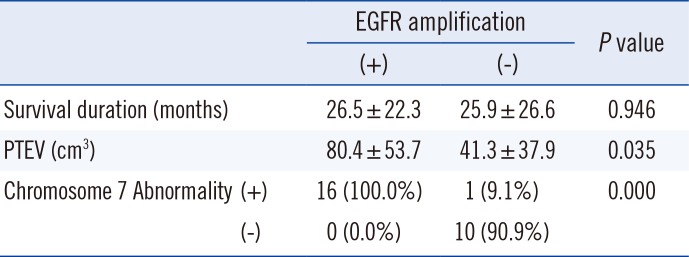
Eleven out of 27 patients showed EGFR amplification. Ten out of these 11 EGFR amplification-positive patients showed abnormalities in chromosome 7 (90.9%). Abnormalities in chromosome 7 were mostly polysomies, one case of derivative chromosome by 7p12 translocation and one case of monosomy. The mean PTEVs of patients with or without EGFR amplification were 80.4±53.7 cm3 and 41.3±37.9 cm3 (P=0.035), respectively. However, there was no significant difference in mean survival (Table 3).
3. Peritumoral edema
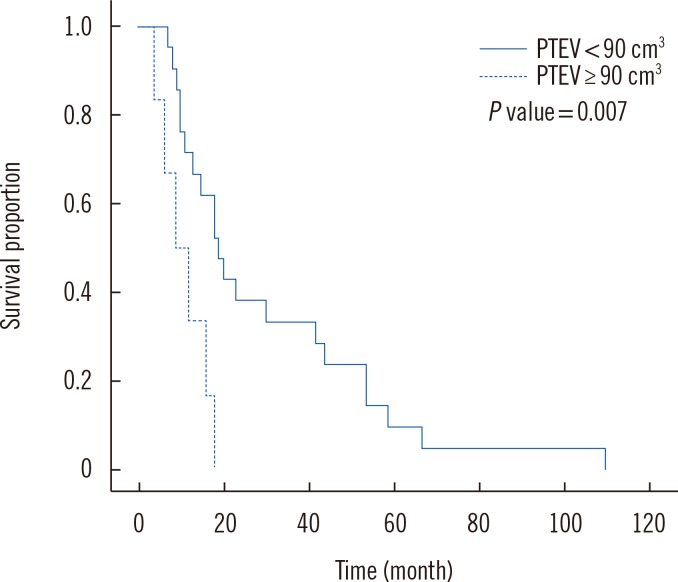
Although the association of survival duration and PTE has been established, the exact criterion for measurement has not been determined. Therefore, various statistical analysis approaches have been attempted to generate a meaningful standard for examining PTE. One such attempt was to search for the significant standard edema volume, which is done by calculating the difference in mean survival after dividing patients into two groups by altering standards every 10 cm3 from 50 cm3 to 100 cm3. The significance of the relationship between PTEV and survival was maximized when the standard edema volume was 90 cm3.
The average survival of patients with PTEV less than 90 cm3 was 30.52±26.11 months. On the other hand, the survival of patients with PTEV of 90 cm3 or greater was 10.83±5.53 months (P =0.007) (Fig. 1).
Since the mean PTEV of the EGFR-amplified and CK groups were 80.4±53.7 cm3 and 86.31±48.7 cm3, respectively, the survival of patients with the standard edema volume of 80 cm3 were also investigated. The mean survival duration of patients with PTEV less than 80 cm3 was 31.15±26.63 months. On the other hand, patients with PTEV at 80 cm3 or greater was 11.86±5.73 months (P =0.052).
However, the edema ratio did not show any relevance to survival or chromosomal results.
DISCUSSION
High-grade astrocytomas, including anaplastic astrocytoma and glioblastoma, are the most common primary brain tumors [12]. They are known as some of the most devastating malignancies because of their poor survival rates, mostly occurring in adults around the age of 50 yr. The age of patients in our study ranged from 22 to 77 yr (mean 53.19±13.72 yr) [1]. The mean survival of our patients was 26.15 months with a two-year survival rate of 25.9%. It is possible that the long mean survival rate observed is because of the exclusion criteria of this study.
Since patients' lives are threatened from the moment of their diagnosis, numerous trials have been conducted and are still ongoing to determine more precise prognosis or progression of the glioblastoma.
The purpose of this study was to clarify the association of intratumoral cytogenetic abnormalities and radiological characteristics, which could possibly be significant prognostic factors [411192021]. Specifically, the relationship between karyotype complexity and PTEV was the focus of our study.
The mean PTEV of normal chromosome patients was 24.52 cm3, while the mean PTEV of the abnormal group was 66.48 cm3 (P =0.004). Among the abnormal karyotype patients, the CK group showed significantly larger PTEV than the NCK group, with mean PTEVs of 34.26±35.04 cm3 and 86.31±48.7 cm3 (P =0.005), respectively. This implies that karyotype complexity is associated with PTEV.
This PTE is a widely known prognostic factor of high-grade astrocytoma. Schoeneggar et al [17] suggested classifying patients into either minor (<1 cm) or major edema (≥1 cm) according to the largest edema diameter as determined using MRI. However, we focused on investigating the possibility of dividing patients into minor and major edema groups according to the three-dimensional volume. The mean edema size of total candidates was 57.16 cm3. Through statistical analysis, we determined that when the standard volume was set as 90 cm3, the relationship between PTEV and survival was significant. The mean survival duration of patients with PTEV less than 90 cm3 was 30.52 months, and survival of patients with PTEV 90 cm3 or greater was 10.83 months (P =0.007). This suggests PTE is a meaningful prognostic factor, which brings edema control as a critical issue during the treatment of malignant astrocytoma (Fig. 2).
There have been attempts to link image features with gene expression modules, which allows prediction of the clinical and molecular characteristics of tumors noninvasively [22]. Well-known instances of molecular prognostic factors are 1p/19q chromosomal codeletion, O6-methylguanin-DNA-methyltransferase (MGMT) promoter methylation, isocitrate dehydrogenase (IDH) mutations, and EGFR amplification [7121523]. The samples in this study were also subjected to different sorts of molecular analyses, such as staining of glial fibrillary acidic protein (GFAP), p53, EGFR, PDGFR, and other components [111324]. Among them, our study concentrated on EGFR amplification, one of the molecular factors dealing with vascular permeability, and its relationship with PTEV in high-grade astrocytoma patients [6]. All patients with abnormalities in chromosome 7 showed EGFR amplification. Considering the fact that the chromosomal locus of EGFR is 7p12, there was a significant relationship. On the other hand, among patients with EGFR mutation, 90.9% showed monosomy, polysomy, or translocation in chromosome 7. The mean PTEV of patients with or without EGFR amplification was 80.4 cm3 and 41.3 cm3 (P =0.035), respectively, implying that abnormalities in chromosome 7 or EFGR amplification could affect PTEV, and this mostly takes place in CK patients (Fig. 3).
The study has its significance in the first attempt in Korea to reveal the relationship between chromosomal abnormalities and radiologic findings in malignant astrocytoma patients by culturing tumor cells. However, the relationship between chromosomal abnormality and survival duration in our study was relatively low according to Kaplan-Meier survival curve (P =0.293), which may be due to other significant prognostic factors such as age, KPS, and VEGF levels. Therefore, more precise results may be achieved with a further investigation on a larger number of candidates.
For a comprehensive interpretation of this study, the cytogenetic complexity of high-grade astrocytoma could lead to amplification of the EGFR gene, which could provoke the enlargement of PTEV due to abnormal angiogenesis. In addition, even with a limited number of patients, it was shown that increased PTEV was related with shorter survival duration. Therefore, a multi-center, prospective plan regarding the prognostic effects of genetic factors and their relationship with radiologic findings should be conducted.

 XML Download