

 PDF
PDF ePub
ePub Citation
 Print
Print


INTRODUCTION
Multiple myeloma (MM) is a malignancy of terminally differentiated B cells and is characterized by clonal proliferation of antibody-secreting plasma cells [12345]. MM is classified into two genetic categories—hyperdiploid MM (H-MM) and nonhyperdiploid MM (NH-MM) [125678]. H-MM is characterized by a hyperdiploid number of chromosomes, with multiple trisomies involving eight odd-numbered chromosomes (3, 5, 7, 9, 11, 15, 19, and 21). NH-MM frequently exhibits translocations involving the immunoglobulin heavy chain locus (IGH) and five chromosomal regions that contain oncogenes, like 4p16 (involving MMSET and usually FGFR3, accounting for 15-20% of MM cases), 6p21 (involving CCND3, 3% of MM cases), 11q13 (involving CCND1; 15% of MM cases), 16q23 (involving c-MAF; 5% of MM cases), and 20q11 (involving MAFB; 2% of MM cases). H-MM and NH-MM each account for approximately a half of MM cases, and there are very few overlapping cases [2910].
Previous studies have shown that MM prognosis depends on the underlying cytogenetic subtype. For instance, MM patients with t(4;14), t(14;16), or t(14;20) have a worse overall survival rate than those with hyperdiploidy, t(11;14), or t(6;14) [238]. Monosomy 13 or a 13q deletion (-13/13q-) is also observed in about 50% of MM cases; it is an indicator of elevated cell proliferation rate and poor prognosis [38910]. Deletion of 17p13 is detected in only 10% of newly diagnosed MM cases, but the prevalence is increased in individuals with later stage MM. The 17p13 region contains TP53, and deletion of this region in MM often correlates with a more aggressive and extramedullary disease, central nervous system involvement, and hypercalcemia, leading to reduced survival irrespective of the treatment modality used [5811]. These cytogenetic markers have already been incorporated into risk stratification strategies and are used in standard clinical practice [4512].
Because MM often exhibits a heterogeneous and complex karyotype, many chromosomal abnormalities of uncertain clinical significance are observed [613]. Aberrations in chromosome 1, mostly involving the loss of 1p or the gain of 1q, are observed in 30-40% of MM cases [126713141516]. These chromosomal regions are enriched for genes associated with cell proliferation [7131617]. Recent studies have demonstrated that these aberrations are associated with poor prognosis, but the causal relationship between chromosome 1 abnormalities and MM prognosis has not been elucidated [248]. Abnormalities in 8q, 11q, and 14q have been reported in 15-20% of MM cases, but no consensus has been reached regarding their prognostic significance [141819].
Although numerous studies have focused on the clinical characteristics of MM with primary translocations, no systematic evaluation of the clinical characteristics of MM associated with other cytogenetic abnormalities, which constitute 40-50% of the chromosomal aberrations observed in MM, has been conducted. To gain insight into the clinical significance of various cytogenetic abnormalities in MM, we comprehensively analyzed karyotypic abnormalities seen in MM and studied the relationship between cytogenetic abnormalities and prognostic factors.
METHODS
1. Patients
The data used in this study were obtained from 333 newly diagnosed MM patients who attended Hallym University Sacred Heart Hospital or Seoul National University Hospital between January 2005 and October 2013 and did not have a history of treatment. The study was approved by the institutional review boards of both centers (IRB No. 1312-072-541 and IRB No. 2014-I020, respectively). The data collected included clinical and laboratory characteristics and karyotypes that were retrieved from electronic medical records.
2. Conventional G-banding
Heparinized bone marrow aspirate was processed for chromosome studies by using standard techniques [1020]. Cells were cultured in RPMI 1640 supplemented with 20% fetal calf serum, L-glutamine (200mM), and penicillin/streptomycin (10,000 IU or 10,000 µg/mL). Most specimens were subjected to a 24 hr unsynchronized culture and an methotrexate or interleukin 4 (IL-4) synchronized culture (IL-4 culture was applied when MM was suspected at the time of referral). Both types of cultures were treated with 100 µL of 10 µg/mL colcemid for 10 min, followed by hypotonic KCl treatment (0.075 mol/L) at 37℃ for 15 min (durations of colcemid and KCl treatment varied over time to obtain optimal conditions), and several washes with a fixative agent (methanol:acetic acid, 3:1). Slides were prepared by air-drying. G-banding was performed with trypsin-Giemsa staining.
3. Karyotype analysis
At least 20 metaphases per patient were analyzed; however, fewer numbers of metaphases (≥ 15) were also accepted when insufficient metaphases were available. An abnormal clone was identified as two or more metaphases with either the same structural chromosomal abnormality, gain of the same chromosome, or at least three metaphases showing loss of the same chromosome. All karyotypes were described by using the most recent version of the International System for Human Cytogenetic Nomenclature at the time that the specimen was karyotyped [202122].
The following information was obtained from each karyotype: chromosome number, imbalances including whole chromosome gains and losses, and specific translocations and breakpoints including odd chromosomes. Breakpoints were described at 400-band resolution. Translocations with breakpoints at p10, p11, q10, or q11 were all regarded as whole arm (centromere to centromere) translocations.
We excluded the known recurrent chromosomal abnormalities seen in MM from our analysis, including t(11;14)(q13;q32), t(14;16)(q32;q23), t(4;14)(p16.3;q32), t(6;14)(p21;q32), t(14;20)(q32;q11), -13/13q-, and-17p13, as well as the recurrent chromosomal abnormalities seen in B-cell lymphoid neoplasms, including t(8;14)(q24;q32) and t(2;8)(p12;q24) [56]. However, other 8q24 abnormalities and 14q32 abnormalities were included in the analysis of chromosomal aberrations.
4. Prognostic factors
Indicators of poor prognosis considered in the present study were mainly based on the Durie-Salmon criteria and the International Scoring System for Myeloma [2324]: Hb level <10 g/dL, calcium level >12 mg/dL, IgG level >7 g/dL or IgA level >5 g/dL, 42-microglobulin level >5.5 mg/L, albumin level <3.5 g/dL, creatinine (Cr) level >2 mg/dL, IgA type, λ type, elevated free light chain level >100 mg/dL, and abnormal κ/λ ratio of >4.0 or <0.5 [9122526].
5. Statistical analysis
Each structural abnormality was classified as either present or absent. Correlation analysis was performed to evaluate whether a structural abnormality in each particular chromosome was frequently associated with a structural abnormality in other chromosomes. P values <0.05 with correlation coefficients >0.8 were considered statistically significant. For continuous variables, differences between groups were analyzed by using an independent t-test, whereas univariate logistic regression analysis was applied to compare categorical variables. Then, analysis of covariance (ANCOVA) and logistic regression were applied to continuous variables as well as continuous variables and categorical variables, respectively, for multivariate analysis.
Patient death was investigated in March 2016, and all follow-up data were censored at this point. Overall survival (OS) was calculated from the time of initial diagnosis to the time of death by any cause. OS was censored for the patients who were alive at the last follow-up. OS curve distributions were estimated by the Kaplan–Meier method, with 95% confidence intervals (CI). Univariate comparisons of OS among subgroups were based on the log-rank test. Multivariate analysis, adjusted for known prognostic factors and known structural abnormalities of statistical significance, was performed by using the Cox hazard regression model. All P values stated were based on this model.
All statistical analyses were performed by using the software package SAS v.9.4 (SAS Institute Inc., Cary, NC, USA). P values <0.05 were considered statistically significant.
RESULTS
1. Patients
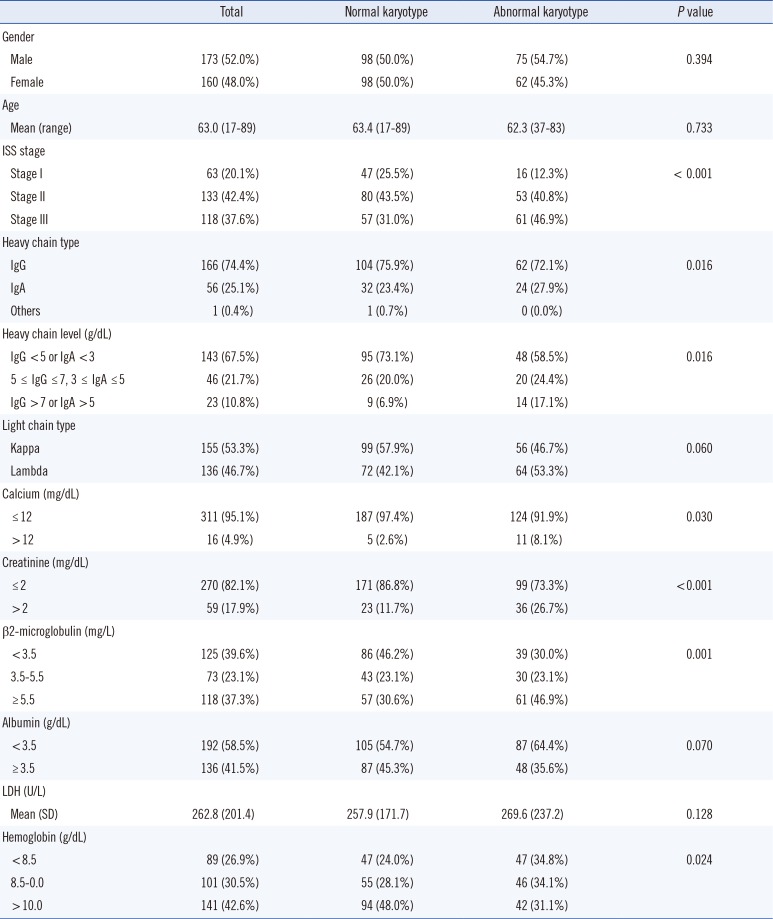
Among the 333 MM patients, 137 exhibited cytogenetic abnormalities (41.1%). The baseline demographic and laboratory data are summarized in Table 1. Myeloma patients with abnormal cytogenetics (numerical and/or structural as a whole) exhibited a higher international scoring system (ISS) stage, frequent IgA type, higher IgG or IgA levels, higher calcium levels, higher Cr levels, higher β2-microglobluin levels, and lower Hb levels compared with patients without cytogenetic abnormalities. Gender, mean age, serum albumin levels, and lactate dehydrogenase (LDH) levels did not significantly differ between the two groups.
2. Detailed MM cytogenetic profiling
Cytogenetic abnormalities that were frequently reported in MM, including hyperdiploidy of odd-numbered chromosomes, t(11;14)(q13;q32), t(14;16)(q32;q23), and-13/13q-, were observed in 67 (20.1%), 25 (7.5%), 1 (0.3%), and 61 (18.3%) patients, respectively. Among the 67 patients with hyperdiploidy of odd-numbered chromosomes, 60 had additional cytogenetic abnormalities and only seven exhibited no other cytogenetic abnormalities. None of the patients with hyperdiploidy of odd numbered chromosomes also had t(11;14)(q13;q32) or t(14;16)(q32;q23); however, four of the hyperdiploidy cases harbored addition material of unknown origin on 14q32. The following alterations were not observed in this population: t(4;14)(p16.3;q32), t(6;14)(p21;q32), t(14;20)(q32;q11), or-17p13. Recurrent cytogenetic abnormalities that are typically observed in B-lymphoid neoplasms, including t(2;8)(p12;q24) and t(8;14)(q24;q32), were observed in one (0.3%) and three (0.9%) patients, respectively. We excluded these cytogenetic abnormalities and other numerical abnormalities, and focused on structural abnormalities in subsequent analyses.
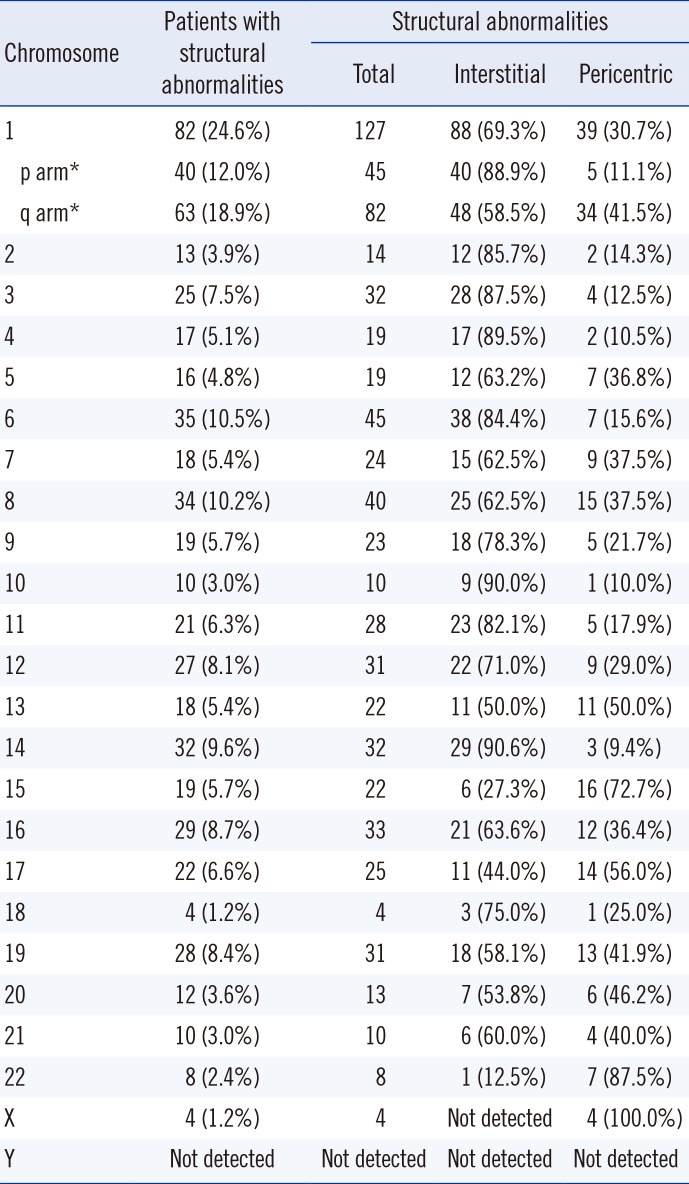
The prevalence of structural cytogenetic abnormalities in each chromosome are summarized in Table 2. When a patient had simultaneous multiple abnormalities involving a particular chromosome, all the breakpoints were counted for calculating the prevalence of structural abnormalities on a certain chromosome. A total of 616 breaks in 124 patients were involved in structural abnormalities. Chromosomes 1, 3, 4, 6, 7, 8, 9, 11, 12, 13, 14, 15, 16, 17, and 19 exhibited abnormalities in greater than 5.0% of the patients. Among them, chromosome 1 abnormality was the most frequently observed (127 abnormalities in 82 patients, 24.6%); 45 p arm abnormalities were noted in 40 patients (12.0%), and 82 q arm abnormalities were noted in 63 patients (18.9%). A total of 90 marker chromosomes of unidentified origin were observed in 41 patients (12.3%). The likelihood of simultaneous aberrations in two certain chromosomes was not statistically significant in patients with ≥2 chromosomal abnormalities.
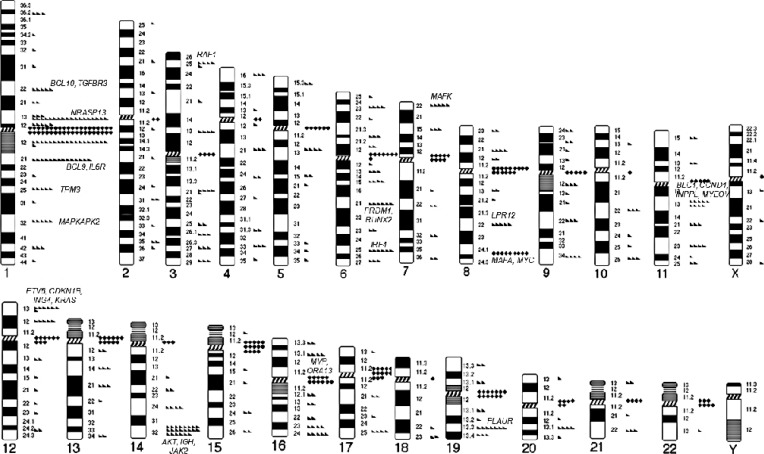
The breakpoints of structural aberrations in each chromosome are depicted in Fig. 1. Frequent centromeric/pericentromeric breakpoints were observed in chromosomes 1, 7, 8, 12, 13, 15, 16, 17, 19, 21, and 22. The other predominant breakpoints included 1p13, 1p22, 1q21, 1q25, 1q32, 3p25, 6q21, 6q25, 7p22, 8q22, 8q24, 11q13, 12p13, 14q32, 16q11, and 19q13.
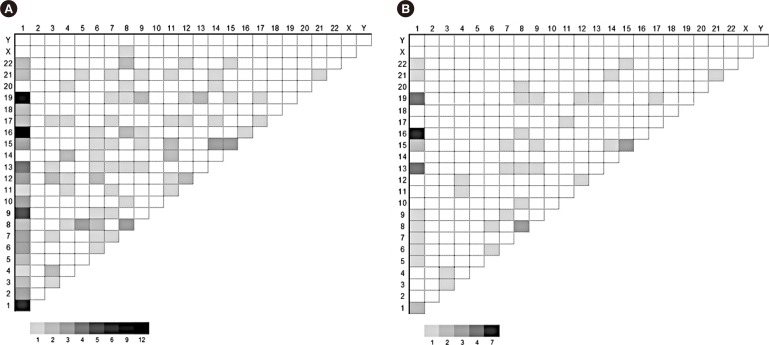
A total of 156 translocations (balanced and/or unbalanced) were observed in 104 patients (31.2%). Various combinations were observed, and chromosome 1 was the most frequently affected (Fig. 2A). Translocation partners of chromosome 1 most commonly involved chromosome 1 itself as well as chromosomes 9, 13, 16, and 19. Among the 156 translocations, 58 arm-to-arm translocations resulting from centromeric/pericentromeric breakage were observed (Fig. 2B). Chromosome 1 was the most frequently affected; two cases with t(1;1), four with t(1;13), two with t(1;15), seven with t(1;16), four with t(1;19), three with t(8;8), and three with t(15;15) involved arm-to-arm translocations.
3. Prognostic impact of cytogenetic abnormalities with unknown clinical significance
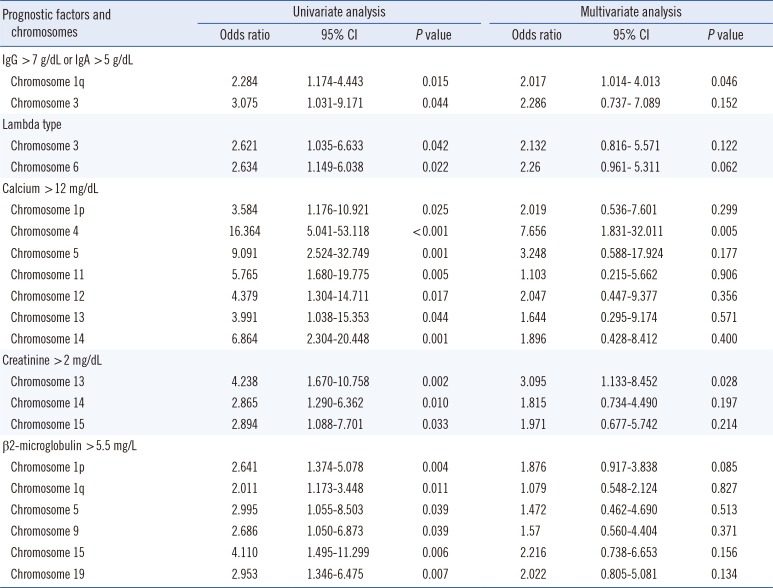
Some patients demonstrated multiple abnormalities in a particular chromosome. However, these were all considered as a 'single patient with chromosomal aberrations in a particular chromosome' in the analysis for prognostic factors. Univariate analysis showed that structural abnormalities in the following chromosomes were associated with known prognostic factors: chromosome 1q or 3 abnormalities were associated with elevated IgG or IgA levels; chromosome 3 or 6 abnormalities were associated with λ type; chromosome 1p, 4, 5, 11, 12, 13, or 14 abnormalities were associated with elevated calcium levels; chromosome 13, 14, or 15 abnormalities were associated with elevated Cr levels; and chromosome 1p, 1q, 5, 9, 15, or 19 abnormalities were associated with elevated β2-microglobluin levels. Multivariate analysis indicated that structural abnormalities in the following chromosomes were associated with known prognostic factors: chromosome 1q abnormalities were associated with elevated IgG or IgA levels; chromosome 4 abnormalities were associated with elevated calcium levels; and chromosome 13 abnormalities were associated with elevated Cr levels (Table 3). Structural abnormalities in other chromosomes did not correlate with any prognostic factors.
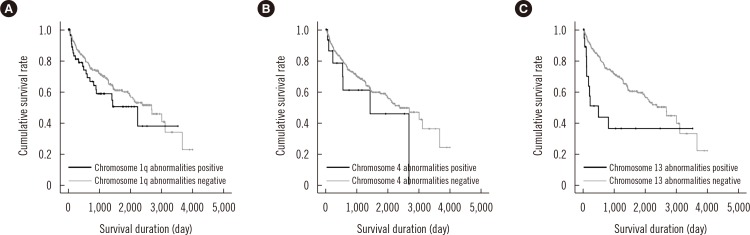
Survival analysis was performed for the chromosomal abnormalities that showed significant association with known prognostic factors in multivariate analysis (Fig. 3). The initial treatment regimens were too varied to be incorporated into the survival analysis; among the 333 patients included in this study, 117 died and 216 were censored. The median survival duration of the 333 patients was 950 days. Among the 63 patients with chromosome 1q abnormalities, 22 (34.9%) died, and among the 270 patients without chromosome 1q abnormalities, 95 (35.2%) died. The median survival duration of the patients with and without chromosome 1q abnormalities was 459 and 1,021 days, respectively. However, the impact of chromosome 1q abnormalities on OS was not significant in the univariate analysis (P=0.158). Among the 17 patients with chromosome 4 abnormalities, 7 (41.2%) died, and among the 316 patients without chromosome 4 abnormalities, 110 (34.8%) died. The median survival duration of the patients with and without chromosome 4 abnormalities was 542 and 966 days, respectively. The impact of chromosome 4 abnormalities on OS was not significant in the univariate analysis (P=0.244). Among the 18 patients with chromosome 13 abnormalities, 10 (76.9%) died, and among the 315 patients without chromosome 13 abnormalities, 107 (40.0%) died. The median survival duration of the patients with and without chromosome 13 abnormalities was 112 and 976 days, respectively. The impact of chromosome 13 abnormalities on OS was statistically significant in the univariate analysis (P=0.006); however, the significance disappeared when elevated Cr level (>2 mg/dL) was considered in the multivariate analysis (P>0.05).
DISCUSSION
Previous studies regarding the prognostic significance of recurrent cytogenetic abnormalities performed a targeted analysis when correlating the presence or absence of certain abnormalities with MM prognosis. MM cases often have complex karyotypes; thus, when determining the prognostic significance of any single cytogenetic abnormality, other coexisting cytogenetic abnormalities that possibly have prognostic impacts should also be considered. In the present study, we comprehensively analyzed MM karyotypes and performed multivariate analysis of the clinical significance of cytogenetic abnormalities in addition to chromosomal aberrations, in the context of concomitant cytogenetic abnormalities.
The presence of a cytogenetic abnormality, regardless of numerical or structural characteristics, was associatd with the factors that indicate a poor prognosis in this study. This phenomenon could be explained by the relationship between the degree of MM cell proliferation and disease severity/progression. Owing to the low proliferative activity of MM cells, it is very difficult to obtain MM metaphase cells, and only approximately 50% of newly diagnosed MM exhibit abnormalities in conventional karyotyping, whereas FISH, which can be applied to cells in interphase, reveals abnormalities in 90% of MM cases [527]. The presence of abnormalities in conventional karyotyping reflects the high burden or the increased proliferation of MM cells, which might be related to advanced disease stages.
Detailed analysis of our data revealed that chromosome abnormalities of unknown significance were also very common and their prevalence was comparable to the abnormalities of known prognostic significance. We also suggest that these abnormalities commonly involve several previously infrequently reported breakpoints that harbor genes with possible roles in MM pathogenesis. We used a presumptive cut-off of 5.0% for prevalence, which is sufficiently high because some typical IGH translocations, including t(14;16)(q32;q23), t(6;14)(q32;p21), or t(14;20)(q32;q11), are observed in less than 5% of MM. The predominant interstitial breakpoints, including 1p13, 1p22, 1q21, 1q25, 1q32, 3p25, 6q21, 6q25, 7p22, 8q22, 8q24, 11q13, 12p13, 14q32, 16q11, and 19q13, contain well-known oncogenes, tumor suppressor genes, and myeloma-related genes that are possibly involved in these breakpoints as follows: 1p13 (NRASP13), 1p22 (BCL10, TGFBR3), 1q21(BCL9, IL6R), 1q25 (TPM3), 1q32 (MAPKAPK2), 3p25 (RAF1), 6q21 (PRDM1, RUNX2), 6q25 (IRF4), 7p22 (MAFK), 8q22 (LPR12), 8q24 (MAFA, MYC), 11q13 (BLC1, CCND1, INPPL, MYEOV), 12p13 (ETV6, CDKN1B, ING4, KRAS), 14q32 (AKT, IGH, JAK2), 16q11 (MVP, ORA13), and 19q13 (PLAUR) (as indicated in Fig. 1). The abnormalities involving theses breakpoints are assumed to be associated with MM pathogenesis. The breakpoints of 1q32, 3p25, 6q25, 7p22, 8q22, 12p13, 16q11, and 19q13 have not been previously described [1671314151628], and our study demonstrated that these breakpoints are also commonly involved in MM. Analysis focused on each of these breakpoints may provide further insight into the molecular pathogenesis of MM.
Another notable finding was that centromeric and pericentromeric breakpoints were very frequently observed, especially in chromosomes 1, 7, 8, 12, 13, 15, 16, 17, 19, 21, and 22. This phenomenon also results in frequent arm-to-arm translocations, including t(1;1), t(1;13), t(1;15), t(1;16), t(1;19), t(8;8), and t(15;15). This observation has not been previously reported because this type of approach for identifying cytogenetic abnormalities has not yet been performed in MM. These results have also never been reported in other hematological malignancies either, thus, this phenomenon might be MM-specific. In a study of diffuse large B-cell lymphoma, centromeric or pericentromeric breakpoints were rare [29]. Cytogenetic evidence for how these unstable whole-arm rearrangements may have occurred is limited. Sawyer et al [30] attributed this phenomenon to the highly decondensed pericentromeric heterochromatin of 1q, reporting whole-arm or "jumping translocation" of chromosome 1q in MM. We observed whole-arm abnormalities in other chromosomes, both with long and short centromeric heterochromatin (chromosomes 15 and 16 vs chromosomes 7, 8, 12, 13, 17, 19, 21, and 22, respectively). Centromeric DNA and pericentromeric heterochromatin are composed of alpha-repetitive DNA and untranscribed satellite sequences [30]. We assume that the decondensation of centromeric heterochromatin that results from DNA hypomethylation leads to the fragility of these regions, presumably as a part of an unknown process associated with tumor progression. Further biochemical studies are required to elucidate the biology of the frequent centromeric and pericentromeric breaks and fusions in those regions in MM.
Among chromosomes with frequent abnormalities, only the abnormalities in chromosomes 1q, 4, and 13 were associated with factors that indicate a poor prognosis, independently of abnormalities in other chromosomes. In accordance with previous studies where abnormalities in chromosomes 1q and 13 were suggested to be correlated with adverse outcome, our study confirmed for the first time that these abnormalities are associated with certain prognostic factors irrespective of other concurrent chromosomal abnormalities [12345891027]. It was also important to note that patients with chromosome 13 abnormalities survived for less time than those without chromosome 13 abnormalities, although this difference did not remain statistically significant in the multivariate analysis in which Cr > 2 mg/dL was the only significant prognostic factor. We assume that chromosome 13 abnormalities have a prognostic impact on OS in association with elevated Cr levels in patients with chromosome 13 abnormalities.
A limitation of our study is that our analysis is based only on conventional karyotyping data. High-resolution techniques, such as FISH targeted toward particular chromosomes and breakpoints, could facilitate the detection of submicroscopic abnormalities or abnormalities in minor clones, which may yield different results. Nevertheless, our analysis was beneficial because conventional cytogenetics remains one of the most important prognostic tools used to predict intrinsic plasma cell characteristics and clinical outcomes in MM patients [2734]. Recently, Oh et al [27] reported that chromosome 13 deletion and hypodiploidy as observed by conventional cytogenetics are robust prognostic factors in Korean MM patients. It has been suggested that chromosome 13 abnormalities are not predictive of poor prognosis when identified by FISH alone [2]. Further studies employing both conventional cytogenetics and FISH will be helpful for confirming the clinical significance of the abnormalities reported in this study.
In summary, we demonstrated for the first time that the frequent abnormalities observed in chromosomes 1q and 13 are associated with poor MM prognosis, irrespective of the presence of concurrent chromosomal abnormalities. Our study also showed that MM patients have fragile centromeric chromosomes, which may be related to MM pathogenesis.
 XML Download