

 PDF
PDF ePub
ePub Citation
 Print
Print


INTRODUCTION
Metabolic syndrome (MetS) is a group of the most common cardiovascular disease (CVD) risk factors: raised fasting plasma glucose, abdominal obesity, dyslipidemia and hypertension, as well as genetics, aging, and a proinflammatory state, which have been shown to increase cardiovascular (CV) morbidity and mortality [12].The association between MetS and adverse CV outcomes is independent of diabetes mellitus (DM) and arterial hypertension [3]. In addition, MetS has been associated with changes in cardiac structure and function, including left ventricular (LV) hypertrophy and subclinical LV systolic and/or diastolic dysfunction [4]. Alterations in LV structure and function of patients with MetS could be an important link to CV morbidity and mortality [3]. The prevalence of LV hypertrophy (LVH) and LV dysfunction significantly increased with the presence of an increasing number of risk factors [5]. One of the factors that certainly contributes to MetS is a proinflammatory state. A biomarker that is currently of interest in relation to this is soluble ST2 (sST2), a member of the interleukin (IL)1 receptor host defense and inflammation family [67].
In patients with increased sST2 concentrations, protective functions of IL-33 may be inhibited, leading to maladaptive cardiac remodeling with fibrosis, hypertrophy, and loss of function [8]. Recently, sST2 has been reported to be increased in patients with heart failure, myocardial infarction, hypertension, severe obesity, and diabetes [91011121314]. sST2 emerged as a prognostic biomarker for both nonfatal cardiac events and mortality in high-risk patients [15]. With regards to LV remodeling in MetS, there is no available data on sST2 concentrations and their possible influence on LV structure and function.
The aim of the present study was to determine the link between proinflammatory factors, namely sST2, and LV remodeling in patients with MetS, as a potentially useful tool in early assessment of MetS patients.
METHODS
A multicentric, cross-sectional study was conducted at university hospital centers in Italy, Serbia, and Spain, from April 2013 to October 2014.
The study included 180 consecutive subjects who were referred from outpatient clinics where they were screened for MetS. The study was conducted in compliance with the Declaration of Helsinki, and the Ethics Committees of all the institutions where research was conducted approved the research protocol. Informed consent was obtained from all subjects.
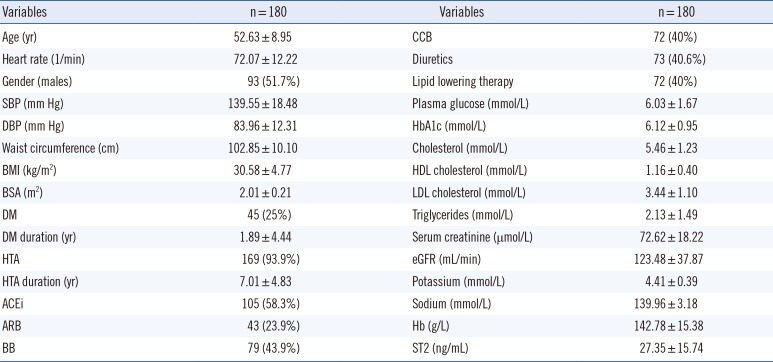
Demographic and clinical parameters of the study population are presented in Table 1.
The study group included almost equal proportions of men and women, aged less than 65 yr, exhibiting central obesity and the other MetS criteria. About 94% of the subjects had hypertension, with an average therapy duration of seven years. Diabetes was present in 25% of subjects, with an average duration of less than two years.
All participants underwent physical, laboratory, and echocardiographic examinations.
Arterial blood pressure (BP) was obtained by taking the average value from at least two BP measurements in the sitting position within a 1-2 min interval [16]. Anthropometric measurements (height, weight, waist circumference) were taken for all subjects. Body surface area (BSA) and body mass index (BMI) were calculated. Regarding MetS and laboratory analyses, we determined the levels of fasting glucose, total cholesterol, high density lipoprotein (HDL) cholesterol, and triglycerides. Additional laboratory tests included analyzing hemoglobin, sodium, and potassium levels, as well as measures of renal function (creatinine and glomerular filtration rate). All study participants underwent biomarker testing for N-terminal pro-hormone B-type natriuretic peptide (NT-proBNP) and sST2. Samples were collected from each patient and stored at -25℃. They were transported via airplane on dry ice without any delay during transportation, and processed at a local laboratory in Rome upon arrival. Levels of sST2 were stable during the transportation process.
MetS was diagnosed according to the new International Diabetes Federation (IDF) definition as the presence of central obesity and at least two of the following factors: triglycerides ≥1.7 mmol/L (or specific treatment for this lipid abnormality), HDL cholesterol <1.03 mmol/L in males and <1.29 mmol/L in females (or specific treatment for this lipid abnormality), systolic BP ≥130 or diastolic BP ≥85 mm Hg (or treatment of previously diagnosed hypertension), and fasting plasma glucose ≥5.6 mmol/L. Central obesity was assumed if BMI was >30 kg/m2, or waist circumference was ≥102 cm in males and ≥88 cm in females [1718].
Study inclusion criteria consisted of MetS, age <65 yr, normal LV ejection fraction (EF) (≥50%), and normal concentration of NT-proBNP. Exclusion criteria were: symptoms or signs of heart failure, cardiac arrhythmia with hemodynamic instability, documented coronary artery disease, previous cerebrovascular events, congenital or valvular heart disease, liver cirrhosis, kidney failure, anemia, malignant disease, and alcoholism.
The duration of hypertension was defined by the length of antihypertensive drug usage. The duration of diabetes was defined by the length of the specific therapy regimen.
1. Laboratory assays
All patients underwent sST2 testing at admission. Blood samples from all centers were shipped to the central laboratory in Rome. Testing was performed by using Presage ST2 (Critical Diagnostics, San Diego, CA, USA), a quantitative monoclonal ELISA assay in a 96-well plate (ELISA PLATE READER DAS S.R.L; model A3 and C, Rome, Italy). In each well, we added 100 µL of blood serum. Normal sST2 values for patients in good health are divided by sex as follows: 23.6±2.3 ng/mL for men and 16.2±1.2 ng/mL for women.
2. Echocardiographic study
Echocardiographic images were obtained by using a 2.5-MHz transducer with harmonic capability, in all centers, using a Vivid 7 (General Electric, Boston, MA, USA) echo machine. A complete two-dimensional echocardiographic (2DE) study was performed in the left lateral decubitus position, according to recommendations from the American Society of Echocardiography (ASE) [19]. Reported values of all echocardiographic parameters represent the average value of three consecutive cardiac cycles.
Relative wall thickness (RWT) was calculated as (2×LV posterior wall thickness)/LV internal end-diastolic diameter. LV end-systolic and end-diastolic volumes and EF were calculated by using the biplane method. Left atrial (LA) volume was calculated by using the LA areas and lengths measured from both the apical four- and two-chamber views. LV and LA volumes were indexed by BSA. For calculating LV mass, we used a formula proposed by Devereux and colleagues (ASE): LV mass=0.8 (1.04 ([LVIDD+PWTD+IVSTD]3-[LVIDD]3))+0, 6 g, where IVSTD is the diastolic interventricular septum thickness, PWTD is the diastolic posterior wall thickness, and LVIDD is the LV internal diastolic diameter [19]. LV mass was indexed by BSA (LV mass index [LVMI]). LV hypertrophy was defined by LVMI ≥116 and ≥96 g/m2 in men and women, respectively. Remodeling patterns of LV were categorized regarding RWT and LVMI as: normal LV geometry, normal LVMI and RWT ≤0.42; concentric remodeling, normal LVMI with increased RWT >0.42; concentric hypertrophy, increased LVMI and increased RWT >0.42; eccentric remodeling, increased LVMI and RWT ≤0.42 [19]. Transmitral pulsed Doppler inflow included measurements of early diastolic mitral flow velocity (E), deceleration time (DT), late diastolic mitral flow velocity (A), and E/A ratio [20]. Tissue Doppler imaging was used in the apical 4-chamber view with a sample volume placed at the septal and lateral segment of the mitral annulus during early and late diastole (e' and a'). The average of the peak early diastolic relaxation velocity (e') was calculated, as well as the E/e' average ratio [20]. Doppler timed LV interval (in milliseconds), the isovolumic relaxation time (IVRT), was measured with continuous Doppler by aiming the Doppler beam at an intermediate position between inflow and outflow to record both velocities. IVRT was measured as the interval between the end of ejection and the onset of mitral inflow [20]. Left ventricular internal diameter-diastole LVIDD was assessed by Doppler parameters (E/A ratio, DT, e' lateral, e' septal), following the recommendations of the European and the American Society of Echocardiography [2122].
3. Statistical analyses
Continuous variables are presented as mean±SD. Normality of data sets was assessed by the Kolmogorov-Smirnov test. When data did not follow normality assumptions and non-normality was due to a valid reason (real observed data points of sST2), data were transformed to obtain normality by applying a logarithmic transformation (LogsST2). An independent samples t-test was used to compare means from two groups. Differences in proportions were compared by using a chi-square test. Pearson's correlation coefficients were used for determining the correlation between 2D LV parameters, sST2, and the other parameters. P values <0.05 (two-sided) were considered statistically significant. The variables that showed P values ≤ 0.10 were included into the stepwise linear regression analysis. A logistic regression was performed to determine the effects of different parameters on the likelihood that participants had LVH and LVDD. A general linear model and the analysis of equal variance with Bonferroni post hoc analysis were used to detect differences between four groups of LV remodeling patterns. The accuracy of the sST2 test for distinguishing between patients with and without LVH was assessed from ROC curve analysis.
RESULTS
sST2 concentrations were increased above normal values in the study group as a whole. In addition to the mean value of sST2 listed in Table 1, the median concentration of sST2 for the group was 23 ng/mL.
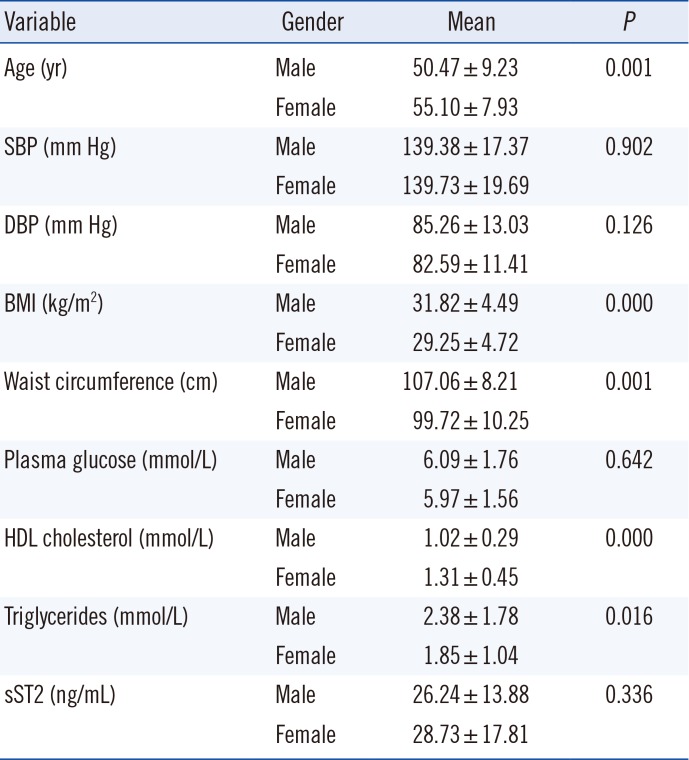
Regarding MetS parameters as inclusion criteria, all participants, males and females, had similar systolic BP (SBP), diastolic BP (DBP), and plasma glucose levels. Males were younger, with higher BMI and waist circumference than females, and had higher levels of serum triglycerides on average. Females had higher levels of HDL (Table 2).
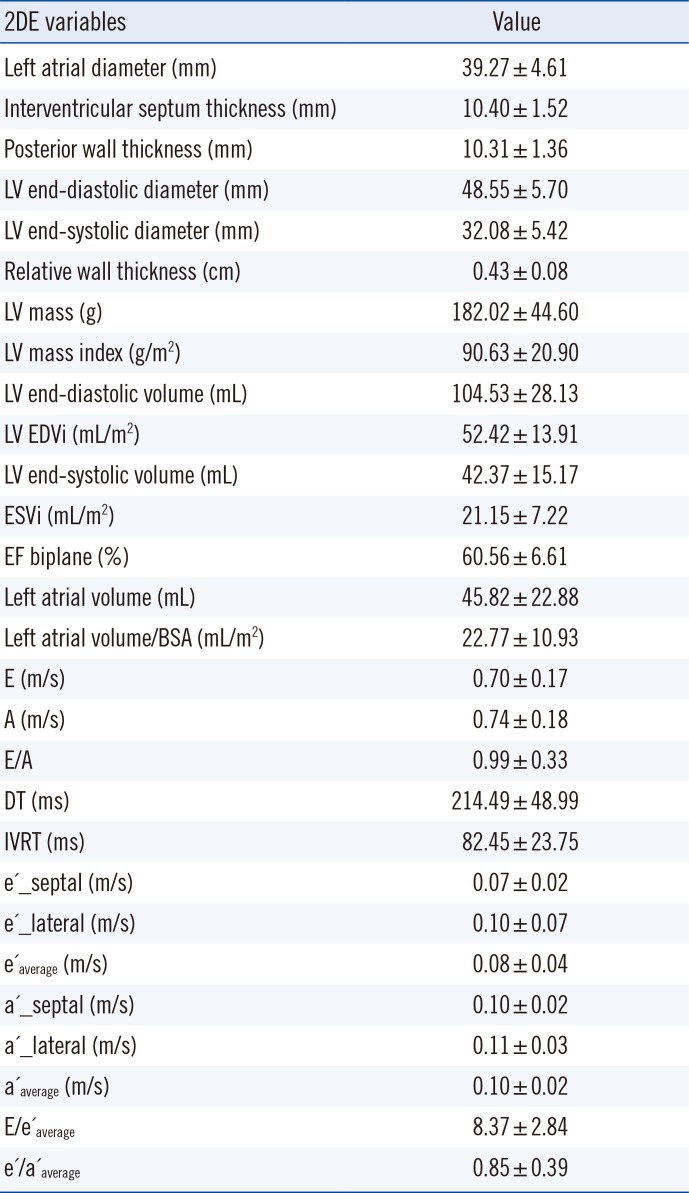
Results of 2D echocardiographic examinations of LV structure and function in subjects with MetS are shown in Table 3. Mean values of LA dimensions, LV volumes, and EFs were normal. There was an increased diastolic thickness of the septum and posterior wall, as well as an increased relative wall thickness. Overall, parameters of LV diastolic function (E/A, e'/a' average, E/e' average) were impaired in study participants.
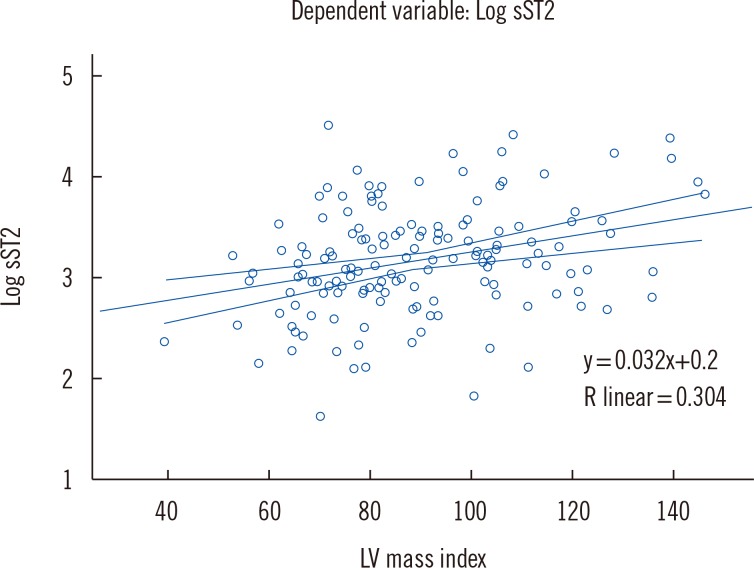
Correlation analysis demonstrated that HDL (r=-0.188, P=0.022), IVSTD (r=0.185, P=0.023), PWTD (r=0.225, P=0.006), LV mass (r=0.286, P=0.000), LVMI (r=0.304, P=0.000), DT (r=-0.181, P=0.029), and IVRT (r=-0.228, P=0.008) were significantly related to sST2, but correlation coefficient was relatively weak.
When these parameters were added in the linear regression model, stepwise method, only LVMI (β=0.337, P=0.000), IVRT (β=-0.256, P=0.002), and HDL (β=- 0.199, P= 0.013) were independently associated with sST2 concentrations, which is shown graphically in Fig. 1.
LVH was found in 48 (26.7%) subjects. LVMI was normal in 132 (73.3%) subjects. sST2 was significantly higher in patients with LVH than in patients without LVH (32.18±16.88 ng/mL vs 25.94±15.19 ng/mL, P=0.042).
A logistic regression was performed to determine the effects of age, BMI, gender, SBP, DBP, therapy, and sST2 concentration on the likelihood of participants having LVH. The logistic regression model was statistically significant (χ2=9.65, P=0.008). The model correctly classified 89% of cases. Increased sST2concentration was associated with an increased likelihood of exhibiting LVH [Exp (B)=2.20, P=0.048] as well as increased SBP [Exp (B)=1.02, P=0.05]. Males with MetS were 2.51 times more likely to exhibit LVH than females (P=0.001).
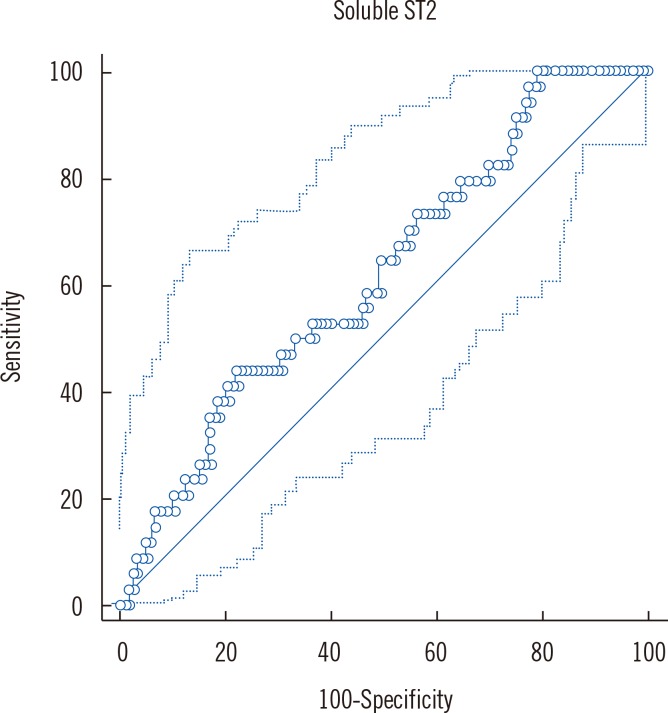
We performed ROC analysis for sST2, and the classification variable was LVH. ROC analysis showed that testing for sST2 has the ability to distinguish between the two groups; the area under the ROC was 0.62, P=0.02 (95% confidence interval [CI]: 0.557, 0.724). This relatively low area under the ROC in our study indicates that non-invasive risk scores regarding LVH and sST2 concentrations in patients with MeS needs further refinement and testing (Fig. 2).
Youden index was criteria used to find the optimal sST2 threshold point (>30.94) from the ROC curve for sST2 and increased LVMI, with CI of 14.81-49.76, sensitivity of 44.12%, and specificity of 77.78%.
Comparing mean concentrations of sST2 between different remodeling patterns of LV, using GLM, we found the highest sST2 concentration in the group of subjects with concentric hypertrophy (Table 4).
Among study participants, 101 (56.1%) subjects had impaired LV DD. Regardless of sST2 correlating with IVRT as the parameter of LV DD, there were no differences in the mean sST2 serum concentration between groups with and without LV DD (29.77 ng/mL±15.87 ng/mL vs 25.85 ng/mL±15.16 ng/mL, P=0.303). LV DD was linked to SBP [Exp (B)=1.19, P=0.05], age [Exp (B)=1.19, P=0.001], and LVMI [Exp (B)=1.044, P=0.045].
DISCUSSION
The principal finding of the present study was that sST2concentration increased in patients with MetS, and was significantly related to LV remodeling. The serum concentration of sST2 in MetS patients was not linked to age, gender, or history of hypertension or diabetes. In addition, we did not find a significant correlation with most of MetS factors: BMI, waist circumference, BP, plasma glucose and triglycerides.
In The Dallas Heart Study (DHS), sST2 concentrations were not significantly associated with most traditional CV risk factors or subclinical CV disease [15]. In the Framingham heart study (FHS), sST2 concentrations differed between men and women, increased with age, and were associated with diabetes and hypertension [11]. The DHS and the FHS were large, population-based studies. In the study by Ojji et al [12], BP in hypertension patients did not differ significantly between four groups of LV remodeling patterns. Therefore, BP did not influence sST2 concentration, which was higher in the concentric hypertrophy group. The results of the study conducted by Fousteris et al [14] indicate that type 2 diabetes is associated with higher sST2 concentrations, which are positively correlated with CRP levels and the extent of glycemic control. In this study, there was a control group with normal glucoregulation, while the MetS study did not include controls. Our results are related to a specific group of patients with MetS, which, by definition, already includes risk factors and their interactions. This could explain the lack of correlation between sST2 and risk factors. sST2 was recently shown to be expressed in adipose tissue macrophages [1323]. Waist circumference and BMI of our patients were in accordance with MetS criteria for central obesity.
We demonstrated that parameters of LV structure and subclinical DDwere considerably related to sST2. Among the dysfunction parameters, only LVMI and IVRT were independently associated with sST2 concentration. Increased sST2concentration was associated with an increased likelihood of exhibiting LVH, as well as increased SBP. In addition, LVH was gender-related: males with MetS were 2.5 times more likely to show LVH than females. Elevated BP and hormones are well known predictors of LVH. Our results indicate that the proinflammatory state as determined by elevated sST2 is a more powerful LVH contributing factor than SBP in MetS.
The mechanism of sST2 action in the heart is not fully understood. ST2 is a member of the IL-1 receptor family. The gene encoding ST2 is clearly upregulated in cardiomyocytes and fibroblasts during mechanical stretch [79]. This gene encodes a protein that consists of a functionally active (via binding to IL-33) transmembrane ST2 receptor form (ST2L) and a soluble receptor form (sST2) that can be detected in serum [8]. Cardiomyocytes and cardiac fibroblasts show a concordant increase in release of both ST2L and sST2 under biomechanical strain [8]. This release is an important step in the overall mechanism of inducing cardiac remodeling due to volume and/or pressure overload [24]. The pitfall of this action lies in the fact that presence of large amounts of sST2 may be a "decoy" receptor, acting as a sort of "off switch" for ST2/IL-33 signaling [8]. In the context of CV damage, ST2L/IL-33 reduces cardiac remodeling, fibrosis, and hypertrophy. Possibly, IL-33 can exert an antihypertrophic effect by preventing the actions of angiotensin II or phenylephrine on myocardium [24]. It was recently shown that in CVD models, IL-33 reduces atherosclerotic plaque formation or cardiac hypertrophy secondary to pressure overload [25]. These protective effects of ST2L/IL-33 on cardiac remodeling could be blocked by the presence of large amounts of sST2 competing for IL-33. At the same time, released IL-33 is recognized by different immune cells that produce proinflammatory mediators, and can induce endothelial activation. Both macrovascular (aortic and coronary artery) and heart microvascular endothelial cells are sources of sST2 protein [26].
This situation with modulated proinflammatory response could easily be translated to other similar scenarios of increased volume and/or pressure overload and impaired overall homeostasis, such as MetS.
Our results confirmed that increased sST2 concentrations in MetS were associated with LV remodeling. sST2 concentrations were significantly elevated in MetS patients with LVH, and the highest sST2 concentrations were found in the group of MetS subjects with concentric hypertrophy, which agrees with the results of the study by Ojji et al [12]. This author, in the group of hypertensive patients, showed that sST2 is a useful biomarker for distinguishing hypertensive LVH from hypertension without LVH [12]. We also showed that increased sST2 concentrations could be helpful for making a distinction between MetS patients with and without LVH, but the area under the ROC was 0.62, implying relatively poor accuracy, and the optimal cut-off value of sST2 had low sensitivity.
Regarding LV function, parameters of diastolic function were generally impaired in patients with MetS. Even though sST2 concentration correlated with IVRT, there was no difference in sST2 concentration between groups with and without LVDD. A greater likelihood of having impaired LV diastolic function was seen in MetS patients who were older, had increased SBP, and had increased LVMI. This result is in accordance with the findings of Wang et al [27] in a group of hypertensive patients. Authors reported a poor correlation between sST2 concentration and diastolic parameters in hypertensive patients with stable heart failure and normal LV EF.
A limitation of the present study is that it does not have an inherent temporal dimension, because it was a cross-sectional study. We recognize that the lack of follow-up data could be a limitation of this study regarding the prognostic significance of our results.
To our knowledge, the present study is the first to examine the relationship between sST2 and LV structure and function in patients with MetS. An increased sST2 concentration in patients with MetS was associated with a greater likelihood of exhibiting LVH. sST2 was a more powerful predictor for LVH than SBP. Our results suggest that inflammation could be one of the principal triggering mechanisms for LV remodeling in MetS. According to our findings, sST2 might be a useful biomarker in the early assessment of LV remodeling in MetS. Future studies on the prognostic utility of sST2 and therapeutic strategies targeted toward the IL family in MetS are necessary.

 XML Download