

 PDF
PDF ePub
ePub Citation
 Print
Print


INTRODUCTION
Early detection of at-risk populations with decreased kidney function is important for both acute kidney injury and chronic kidney disease (CKD) [123]. Glomerular filtration rate (GFR) is the most widely used index for assessing kidney function, which is implicated in the guidelines for CKD diagnosis and staging [3456]. Various equations for estimating GFR (eGFR) have been introduced and are currently used; among them, 83% of clinical laboratories used the serum creatinine (Cr)-based Modification of Diet in Renal Disease (MDRD) Study equation in the 2013 College of American Pathologists survey [7]. However, the equation was derived from subjects with CKD, and had the limitation of systematically underestimating GFR in healthy individuals with GFR ≥60 mL/min/1.73 m2 [89]. To overcome this limitation, the Chronic Kidney Disease Epidemiology Collaboration equation (CKD-EPICr) was developed in 2009 on the basis of serum Cr, and more accurate calculations for GFRs ≥60 mL/min/1.73 m2 were made possible [10]. In addition, CKD-EPI 2012 equations based on cystatin C (CysC) (CKD-EPICysC) or a combination of Cr and CysC (CKD-EPICr-CysC) were proposed in a standardized assay to better estimate GFR [1112]. Another new equation, the revised Lund-Malmö (LMRevised) equation was recently developed, and its performance was reported to be more consistent than the MDRD Study and CKD-EPI equations [131415]. However, this equation was derived from only a Swedish Caucasian population.
There have been several reports that compared the MDRD Study and CKD-EPI equations in the general population [1617181920]; however, only a few studies have included the CysC-containing equations. In this study, we compared five eGFR equations (MDRD Study equation, LMRevised equation, and three CKD-EPI equations) to explore the differences in the equations across the GFR categories in Korean adults.
METHODS
1. Study population
During the year 2014, the recipients of annual physical check-ups at the Gangnam branch of Korean Association of Health Promotion (KAHP, Seoul, Korea) were consecutively included according to the following criteria: over 30 yr old and presence of serum Cr and/or CysC results. There were no exclusion criteria for the subject selection process. KAHP is a specialized health-screening center, which provides routine medical check-ups to over 1,000,000 individuals annually in 16 branch clinics nationwide in Korea.
The number of subjects with serum Cr and CysC results was 1,482 (51 [42-59] yr, 48.9% males). Besides serum Cr and/or CysC results, lipid profiles and HbA1c levels were also collected. We conducted a retrospective analysis of laboratory data using the five eGFR equations, and this study was approved by the Institutional Review Board of KAHP.
2. Estimation of GFR
GFR (mL/min/1.73 m2) was estimated by using five different equations (MDRD Study, LM revised, and three CKD-EPI equations) as follows:
a) Four-variable MDRD Study equation [9], GFR=175×sCr-1.154×Age-0.203×0.742 (if female);
b) LMRevised equation [13], GFR=eX-0.0158×Age+0.438×ln(Age), where ln is natural logarithm and X=2.50+0.0121×(150-sCr) for females with sCr level <150 µmol/L, 2.50-0.926×ln (sCr/150) for females with sCr level ≥150 µmol/L, 2.56+0.00968×(180-sCr) for males with sCr level <180 µmol/L, and 2.56-0.926×ln (sCr/180) for males with sCr level ≥180 µmol/L;
c) CKD-EPICr equation [10], GFR=141×min (sCr/κ, 1)α× max (sCr/κ, 1)-1.209×0.993Age×1.018 [if female], where sCr is serum creatinine, κ is 0.7 for females and 0.9 for males, α is -0.329 for females and -0.411 for males, min is the minimum of sCr/κ or 1, and max is the maximum of sCr/κ or 1;
d) CKD-EPICysC equation [11], GFR=133×min (sCysC/0.8, 1)-0.499×max (sCysC/0.8, 1)-1.328×0.996Age×0.932 [if female], where sCysC is serum cystatin C, min indicates the minimum of sCysC/0.8 or 1, and max indicates the maximum of sCysC/0.8 or 1;
e) CKD-EPICr-CysC equation [11], GFR=135×min (sCr/κ, 1)α× max (sCr/κ, 1)-0.601×min (sCysC/0.8, 1)-0.375×max (sCysC/0.8, 1)-0.711×0.995Age×0.969 [if female], where Scr is serum creatinine, sCysC is serum cystatin C, κ is 0.7 for females and 0.9 for males, α is -0.248 for females and -0.207 for males.
Serum Cr levels were determined by the kinetic Jaffe method using SICDIA CRE reagent (Shinyang Chemical, Seoul, Korea) on an automated chemistry analyzer (HITACHI 7600-110; Hitachi High-Technologies Co., Tokyo, Japan). Isotope-dilution mass spectrometry (IDMS)-traceable calibration was conducted weekly with a C.f.a.s. calibrator (Roche Diagnostics, Indianapolis, IN, USA). For internal quality control in the Cr assay, two levels of Lyphochek assayed chemistry quality control materials (Bio-Rad, Hercules, CA, USA) were tested once a day. The mean within-laboratory precision of the serum Cr assay was 2.1% during the study period. The laboratory participated in the external proficiency testing program organized by the Korean Association of Quality Assurance for Clinical Laboratory, and the results were all acceptable (variance index scores <150) during 2014.
Serum CysC levels were measured by the latex immunoturbidimetric method using Sekisui reagent (Sekisui Chemical, Tokyo, Japan) on the same analyzer. The reagent was traceable to the European Reference Material DA471/IFCC. Two levels of Liquichek Immunology Control materials (Bio-Rad) were tested once a day. The mean within-laboratory precision of the serum CysC assay was 1.4% during the study period. The inter-laboratory comparison was performed for CysC, and the differences in results between the two locations were within 10%. All measurements were performed according to the manufacturer's in structions and standard laboratory procedures.
3. GFR categories
GFRs were categorized into ≥90 (G1), 60-89 (G2), 45-59 (G3a), 30-44 (G3b), 15-29 (G4), and <15 (G5) mL/min/1.73 m2 according to the Kidney Disease Improving Global Outcomes (KDIGO) 2012 guideline [4]. The prevalence of reduced GFR, defined as eGFR <60 mL/min/1.73 m2, was compared among the equations on the basis of the levels of serum Cr, CysC, or both [4].
4. Statistical analyses
The eGFRMDRD was regarded as the comparative GFR for com-parisons. Bland-Altman plots were used to identify mean differences and 95% limits of agreement of eGFRs between each equation and the MDRD Study equation. Pearson's correlation coefficients (r) were calculated to compare the equations. r coefficients ≤0.35 were considered low or weak correlations; 0.36-0.67, modest or moderate correlations; and 0.68-1.0, strong or high correlations; with r coefficients ≥0.90 being very high correlations [21].
Categorical agreement rates were calculated when eGFRMDRD and eGFR based on other equations were within the same GFR categories. Weighted kappa value was determined to evaluate the degree of categorical agreement, and kappa value was determined for diagnostic agreement with GFR cutoffs of 60 mL/min/1.73 m2 and 45 mL/min/1.73 m2 [4]. The kappa values were interpreted as follows: <0.20, poor; 0.21-0.40, fair; 0.41-0.60, moderate; 0.61-0.80, good; and >0.81, very good [22]. In general, reduced GFR is defined as an eGFR <60 mL/min/1.73 m2. Additionally, the KDIGO guideline recommends measuring CysC in adults with an eGFRCr of 45-59 mL/min/1.73 m2, who do not have markers of kidney damage for confirmation of CKD [4]. Thus, we used two GFR cutoff points. The overall concordance rate (positive and negative) was also calculated for all equations.
Data were analyzed by using Analyse-it (Analyse-it Software Ltd., Leeds, UK) and MedCalc Statistical Software version 15.2.2 (MedCalc Software, Ostend, Belgium). P values ≤0.05 were considered statistically significant.
RESULTS
1. GFR category distribution in the study population
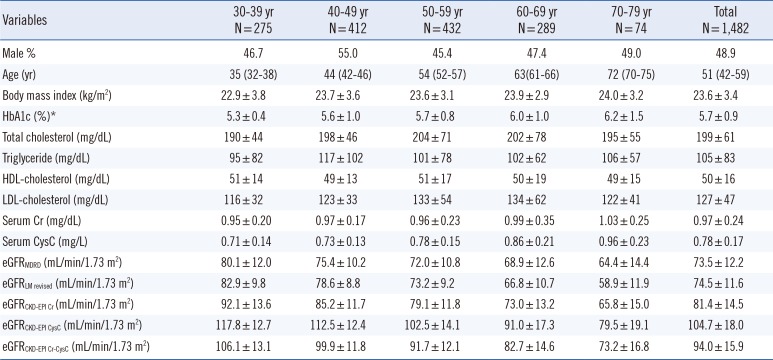
The baseline subject characteristics and calculated eGFR stratified by age groups are shown in Table 1. The CKD-EPI equations yielded higher mean eGFRs than the MDRD Study equation, and the degree of difference varied with the equations and age groups. The eGFRCKD-EPI CysC (104.7 mL/min/1.73 m2) was the highest, followed by eGFRCKD-EPI Cr-CysC (94.0 mL/min/1.73 m2), eGFRCKD-EPI Cr (81.4 mL/min/1.73 m2), eGFRLM Revised (74.5 mL/min/1.73 m2), and eGFRMDRD (73.5 mL/min/1.73 m2). In older patients (≥ 60 yr), the LMRevised equation yielded a lower eGFR than the MDRD Study equation. For all equations, a decreasing eGFR trend was observed as age increased.
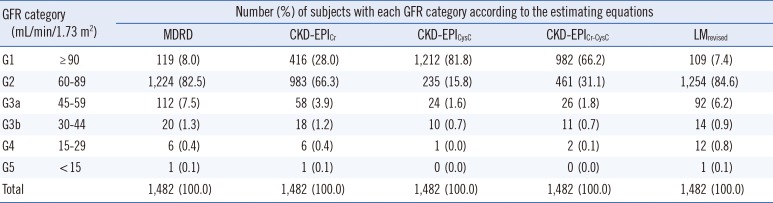
The frequencies of the subjects in each GFR category are shown in Table 2. The proportion of each GFR category varied considerably between equations, especially for categories G1 and G2. The proportions of G1 were 8.0% (MDRD), 28.0% (CKD-EPICr), 81.7% (CKD-EPICysC), 66.2% (CKD-EPICr-CysC), and 7.4% (LMRevised), and the proportions of G2 were 82.5% (MDRD), 66.3% (CKD-EPICr), 15.8% (CKD-EPICysC), 31.1% (CKD-EPICr-CysC), and 84.6% (LMRevised).
2. Concordance between MDRD Study equation and other equations
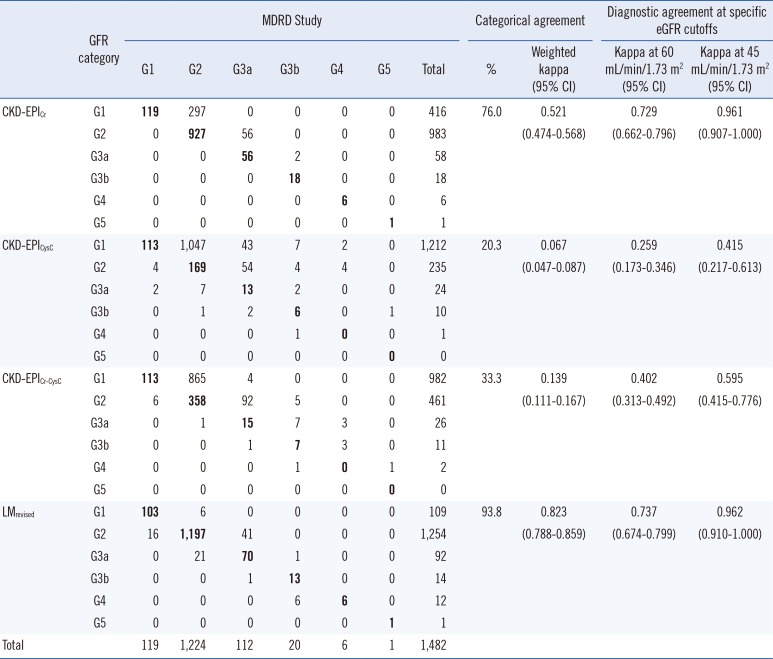
Categorical agreement rates between the MDRD Study and other equations ranged from 20.3 to 93.8%. Upward reclassification from G2 (MDRD Study equation) to G1 (CKD-EPI equations) was common, especially for CKD-EPICysC and CKD-EPICr-CysC equations (Table 3). Weighted kappa values were fair to good in serum Cr-based equations, but poor in CysC-containing equations.
For diagnostic agreement, kappa values at two eGFR cutoffs were variable depending on the equation. Kappa values were better at cutoff 45 mL/min/1.73 m2 than 60 mL/min/1.73 m2. For all equations, overall concordance rates were greater than 90% when the GFR cutoff of 60 mL/min/1.73 m2 was used (96.2% for CKD-EPICr, 91.6% for CKD-EPICysC, 93.1% for CKD-EPICr-CysC, and 95.8% for LMRevised), or when 45 mL/min/1.73 m2 was used (99.9% for CKD-EPICr, 98.5% for CKD-EPICysC, 98.9% for CKD-EPICr-CysC, and 99.9% for LMRevised).
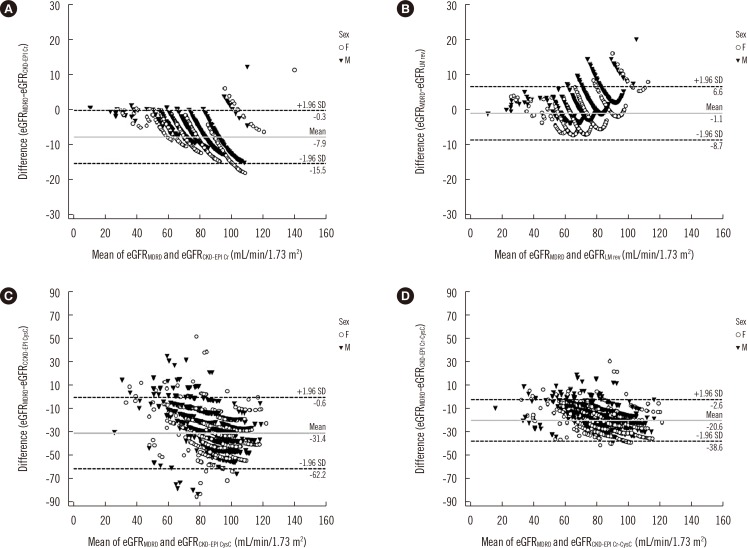
The mean eGFR difference (calculated by: GFR by MDRD Study equation-GFR by other equations) was largest in the CKD-EPICysC equation (-31.4, Fig. 1); it was significantly larger than the differences of other equations compared with the MDRD Study equation (P<0.001). The r coefficients were 0.936 for LMRevised, 0.972 for CKD-EPICr, 0.494 for CKD-EPICysC, and 0.806 for CKD-EPICr-CysC equations (P<0.001).
3. Prevalence of reduced eGFR
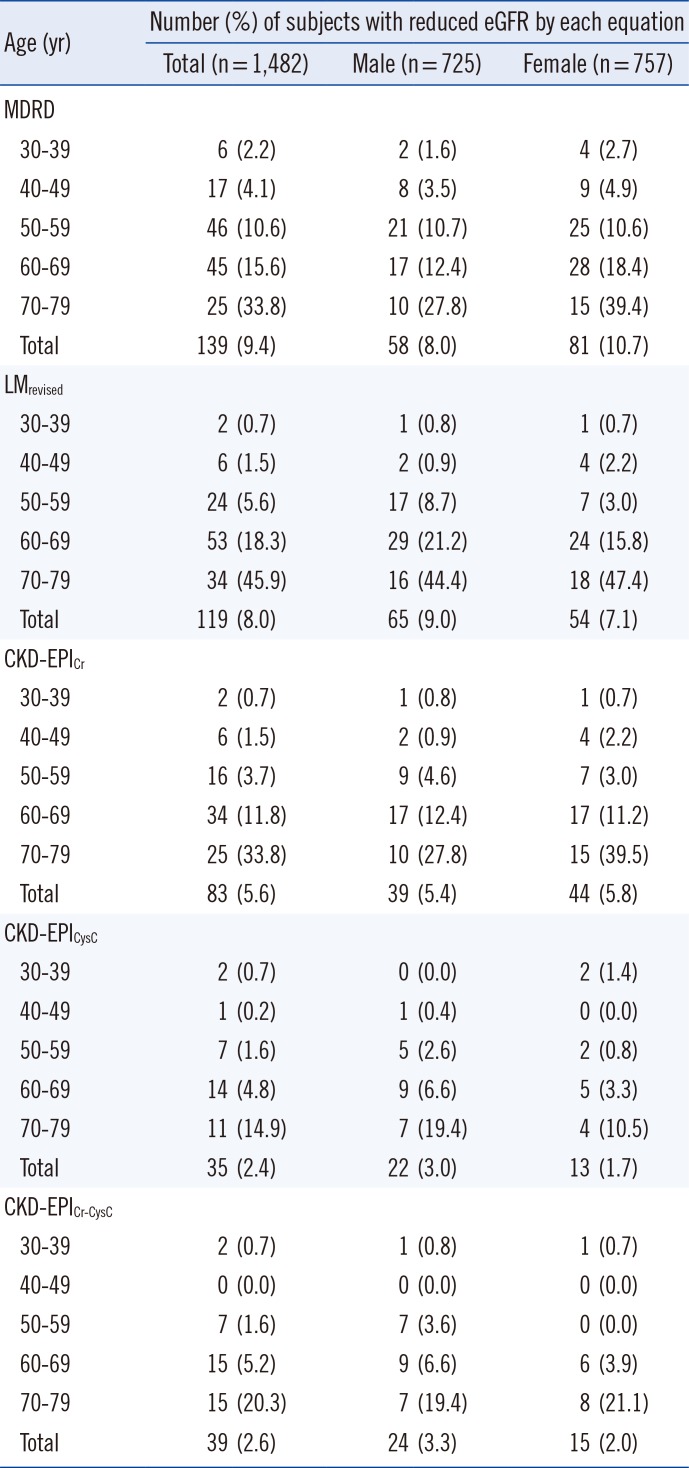
The prevalence of reduced GFR (<60 mL/min/1.73 m2, which corresponds to GFR categories G3a-G5) according to the age group and gender are presented in Table 4. In total, the prevalence of reduced GFR was the highest according to the MDRD Study equation (9.4%) and the lowest (2.4%) according to the CKD-EPICysC equation. The prevalence increased as age increased in all equations. Of note, a very high percentage of low GFR (45.9%) was noted in patients in their 70's according to the LMRevised equation.
DISCUSSION
The Cr-based CKD-EPI equation is recommended for the initial assessment of GFR, and CysC-based CKD-EPI equations can be used for confirmation of kidney disease according to the KDIGO guidelines [423]. In this study, we compared five eGFR equations, including CysC-based formulas, in the Korean population. The prevalence of reduced GFR by CysC-based CKD-EPI equations has not been reported in Korea yet.
The eGFR classification differed considerably according to the equation used for estimation, especially between CKD-EPICysC or CKD-EPICr-CysC equations compared with the MDRD Study equation. Most of the study population (>80%) were in the G2 category (60-89 mL/min/1.73 m2) according to the MDRD Study equation, but in G1 (≥90 mL/min/1.73 m2) according to the CKD-EPICysC equation. The reason for this discrepancy might be related to the eGFR distribution of the study population. Mean eGFRMDRD was 73.5 mL/min/1.73 m2 with a standard deviation of 12.2 mL/min/1.73 m2; thus, there were many results around the cutoff value of 90 mL/min/1.73 m2. In addition, the CKD-EPICysC and CKD-EPICr-CysC equations yielded systematically higher eGFR results (mean difference 31.4 mL/min/1.73 m2 and 20.6 mL/min/1.73 m2, respectively) in comparison with the MDRD Study equation. This finding was in line with previous studies. In the US National Health and Nutrition Examination Survey (NHANES) 1999-2002 data, the distribution of eGFRCKD-EPI CysC was broader and shifted to the right compared with that of eGFRMDRD [24]. Thus, upward reclassification might be common in CysC-based equations.
All equations, except for the CKD-EPICysC equation, showed good correlation with the MDRD Study equation. CKD-EPICysC showed only a moderate correlation (r=0.49). The three different CKD-EPI equations showed an overall low prevalence of reduced GFR compared with the MDRD Study equation, especially according to the two CysC-containing equations. The LMRevised equation was recently reported to outperform the MDRD Study and CKD-EPI equations in a Swedish population [15]; however, there has been no evaluation of this equation in the Asian population. It yielded similar mean eGFR results compared with the MDRD Study equation; these two equations showed a very high correlation and a similar prevalence of reduced GFR. However, eGFR was underestimated in patients ≥ 60 yr, when using the LMRevised equation. This observation needs to be subjected to further studies because of the increased possibility of co-morbidities in older patients. The LMRevised equation was generated only from the Swedish population; hence, ethnic differences might have influenced GFR estimation as well.
Although the CKD-EPICr equation is recommended by KDIGO for initial GFR assessment, newer GFR estimating equations have been developed and validated, including a Korean version of the CKD-EPICr equation [25], a serum Cr-based full age spectrum equation [26], and a CysC-based equation based on a Caucasian, Asian, pediatric, and adult population (CAPA) [27]. Our study did not aim to compare all recent equations; however, we analyzed the CysC-based CAPA equation briefly. The mean eGFRCAPA (106.3 mL/min/1.73 m2), eGFR difference in comparison with MDRD Study equation (-32.9), and prevalence of eGFR less than 60 mL/min/1.73 m2 (2.7%) were similar when compared with CKD-EPICysC equation.
The prevalence of reduced GFR has been reported differently depending on the study population and the GFR-estimating equation used. In several previous studies, there were clinically significant differences in the prevalence of stage 3 or higher CKD depending on the equation used to estimate GFR. Delanaye et al [20] reported that the prevalence of eGFR less than 60 mL/min/1.73 m2 was the highest for eGFRMDRD (13%), intermediate for eGFRCKD-EPI Cr (9.8%), and the lowest for eGFRCKD-EPI Cr-CysC (5%) and eGFRCKD-EPI CysC (4.7%) in 4,189 Belgian patients over 50 yr old. This prevalence trend was similar to ours. One Japanese study showed a 2-fold difference of prevalence between the MDRD Study and CKD-EPICr equations (12.8 vs 6.5%), by studying over 26,000 participants who underwent annual health check-ups [16]. Lujambio et al [28] reported that the prevalence of eGFR less than 60 mL/min/1.73 m2 was the highest for eGFRCKD-EPI CysC (21.8%), intermediate for eGFRCKD-EPI Cr-CysC (11.8%), and the lowest for eGFRMDRD (5.9%) and eGFRCKD-EPI Cr (3.4%) in 119 Uruguayans.
In the US, the prevalence of reduced GFR (eGFR <60 mL/min/1.73 m2) by CKD-EPICr equation was reported to be 4.7% from 1988-1994 and 6.5% from 1999-2002 from NHANES data [29]. In Korea, the prevalence of reduced GFR by the CKD-EPICr equation has been reported as 7.7% in 2007 and 2.6% in 2010 from Korea NHANES data [1718]. In this study, it was 5.1% of the whole study population. This difference could be due to the following reasons. First, the proportion of younger individuals under 40 yr old was lower than that in other studies (23% vs 30-32%). Compared with 2010 Korea NHANES data, the mean eGFR was relatively lower in this study (81.4 mL/min/1.73 m2 vs 95.9-96.8 mL/min/1.73 m2), resulting in higher prevalence of reduced GFR compared with other studies. Second, the study period was different (2014 vs 2007-2010), although the impact of this on the prevalence is still uncertain.
Our retrospective study has several limitations. First, we com-pared all the eGFR equations to the MDRD Study equation, because of the absence of GFR data measured by the gold standard method [18]. Therefore, it was impossible to evaluate the accuracy. The magnitude of bias, calculated by measured GFR-calculated GFR was previously reported to be 2.5-5.8 mL/min/1.73 m2, and this difference could influence the prevalence of CKD stages [1724]. Second, our population might not be representative of the entire population of Korea. Third, we could not analyze albuminuria data or other markers of kidney damage. The classification of CKD was not performed, which is based on both GFR category and albuminuria category. Thus, there could be the CKD patients among the subjects with eGFR ≥60 mL/min/1.73 m2.
In conclusion, this is the first study that compared five eGFR equations in the Korean population. Our data demonstrated remarkable differences in GFR assessment depending on the equation used. The proportion of each GFR category varied considerably, and CysC-containing equations yielded higher eGFRs and showed larger differences compared with the MDRD Study equation. The prevalence of reduced GFR was lowered by the CKD-EPI equations. Further studies using prospective design and in various ethnicities are necessary.
 XML Download