

 PDF
PDF ePub
ePub Citation
 Print
Print


Therapeutic drug monitoring (TDM) of second-line anti-tuberculosis (TB) drugs becomes increasingly important to assess patients with multidrug-resistant (MDR) or extensively drug-resistant (XDR) TB due to current complex treatments [12]. Inappropriate dosing due to pharmacokinetic variability of anti-TB drugs is a main casual factor in the emergence of drug-resistant Mycobacterium tuberculosis strains [34]. We recently reported on a multiplex assay for nine second-line anti-TB drugs, namely, streptomycin, kanamycin, clarithromycin, cycloserine, moxifloxacin, levofloxacin, para-aminosalicylic acid (PAS), prothionamide, and linezolid, in human sera by using ultra-performance liquid chromatography-tandem mass spectrometry (UPLC-MS/MS) [5]. Dried blood spots (DBSs) have various advantages over conventional venous blood sampling, including easier sampling, storage, and transportation, thereby enabling TDM even in remote areas [6]. Owing to these advantages, assays with DBSs for one or two anti-TB drugs like moxifloxacin, linezolid, rifampicin and clarithromycin have been developed [789]. However, an assay for simultaneously measuring three or more anti-TB drugs in DBSs is currently unavailable. We developed an UPLC-MS/MS method for simultaneously measuring concentrations of these nine second-line anti-TB drugs in DBSs.
Standard plasma were prepared by spiking stock solutions into blank plasma. Standard whole-blood with six drug concentrations (streptomycin, kanamycin, cycloserine, and PAS at 0, 5, 10, 20, 40, and 100 µg/mL; clarithromycin and prothionamide at 0, 0.5, 1, 2, 4, and 10 µg/mL; and moxifloxacin, levofloxacin, and linezolid at 0, 1, 2, 4, 8, and 20 µg/mL) were prepared by mixing equal amounts of standard plasma and blank packed red blood cells. For standard DBSs, 100 µL of six standard whole-blood was added dropwise onto Whatman 903 filter paper by using an adjustable pipette [1011]. After samples were dried for 12 hr at room temperature, they were stored in a sealed bag at -20℃.
Total 79 DBS patient samples were prepared with similar method to that of plasma with some modifications [5]. In brief, two 3.2-mm diameter punched-out DBSs made by the same process as the standards were extracted by using 100 µL 50% methanol in distilled water with 50 µL internal standard in the same mixed solution except for streptomycin and kanamycin. For these drugs, 5 µL of 3M HCl were also added. After 20 min of sonication, mixtures were centrifuged at 15,700g for 5 min; 90 µL supernatant was mixed with 90 µL methanol. In the case of two drugs, 5 µL of 1M NaOH was added to the mixtures. After centrifugation at 15,700g for 5 min, the supernatants were injected into a UPLC system. Plasma samples were prepared as described previously [5].
All samples were analyzed on an LC-30A Nexera UPLC system (Shimadzu Co., Kyoto, Japan) with an AQUITY Waters HSS T3 column (50.0×2.1 mm, 1.8 µm; Waters, Watford, UK). The flow rate was 0.25 mL/min. The mobile phase was a gradient of a mixture of 10 mM ammonium formate in 0.1% formic acid (solvent A) and acetonitrile in 0.1% formic acid (solvent B). The total running time was 4 min. All drug concentrations were determined by using an AB Sciex API 6500 triple quadrupole tandem mass spectrometer (AB Sciex Pte., Ltd., Framingham, MA, USA).
All drugs and internal standards were clearly separated in the UPLC-MS/MS system, as in our previous study [5]. Ion suppression, evaluated by the post-column infusion model method [12], was not observed at the retention time for any of the compounds.
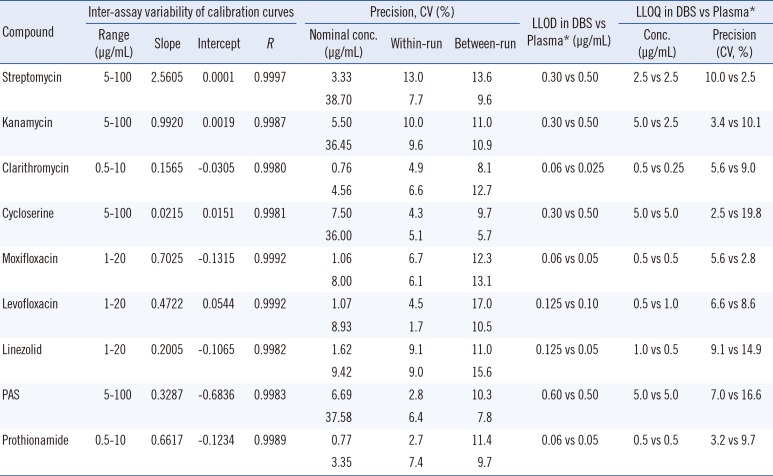
Inter-assay calibration variability data were collected on five consecutive days. Linear and reproducible curves were obtained in the observed analytical ranges (Table 1). According to the CLSI EP6-A guideline [13], linearity was acceptable at five concentrations for each drug (R>0.9990).
Values of within-run precision, determined by using 10 replicated analyses of quality control samples, were 2.7-13.0% at low concentrations and 1.7-9.6% at high concentrations. Values of between-run precisions, determined by measuring controls for 10 consecutive days, were 8.1-17.0% at low concentrations and 5.7-15.6% at high concentrations.
The lower limit of detection (LLOD) and lower limit of quantification (LLOQ) were defined as the lowest concentration with a signal-to-noise ratio of >3.0 and the lowest concentration with precision <20% and an accuracy within ±20%, respectively. The LLOD and LLOQ were 0.06-0.30 and 0.5-5.0 µg/mL, respectively (Table 1). Compared with our previous study in plasma [5], LLOQs of DBSs were generally higher. According to the pharmacokinetic study of second-line anti-TB drugs [14], Cmax values of streptomycin, kanamycin, cycloserine, PAS, moxifloxacin, levofloxacin, and prothionamide were within linear ranges, and at least five times higher than the LLOQ for each drug.
All standard DBSs were tested again after being kept in a sealed bag at -20℃ over 6 months, to assess their stability. Differences between the time points were within ±10%, except for streptomycin at low levels and prothionamide at both low and high levels.
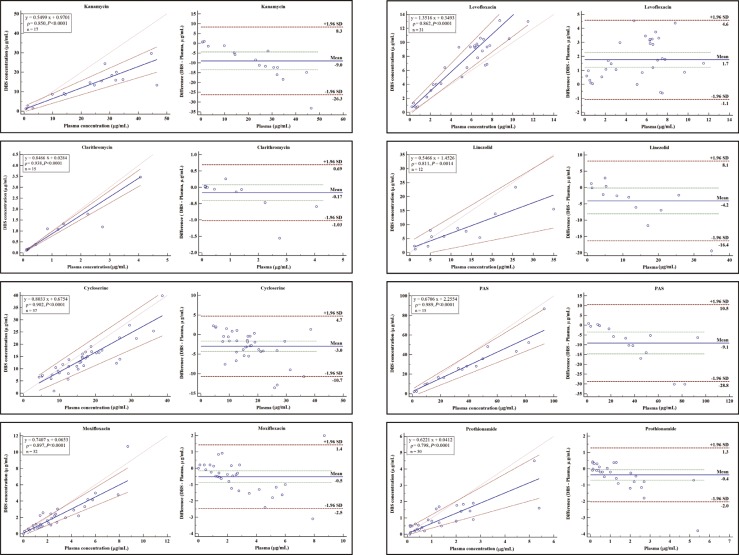
Plasma and DBSs for the comparison study were obtained from residual samples of TB patients. This research was approved by the Seoul National University Bundang Hospital Institutional Review Board, and was conducted in accordance with the Declaration of Helsinki. Passing-Bablok regression analysis revealed strong similarity between drug concentrations in DBSs and in plasma (Fig. 1). For streptomycin, only two residual samples were tested, and the results were 4.8/3.6 µg/mL and 2.1/2.7 µg/mL (plasma/DBS) respectively. The Pearson's rho (ρ) of drugs ranged from 0.798 to 0.989 (P<0.0015). Although these values were lower than those of published single or dual drug assays [789], they are acceptable for TDM in MDR/XDR management. The concentration of each drug in DBSs showed a degree of negative bias compared with that in plasma, except for levofloxacin. Several factors cause a mismatch of drug concentration between plasma and venous whole blood, including differential partition between red blood cells and plasma, and individual hematocrit variations [6]. Nevertheless, a very high positive correlation for clarithromycin, cycloserine, and PAS and high positive correlation for the other drugs were observed [15]. At first, the corresponding plasma values could be calculated from the DBSs by using the conversion equations for clarithromycin, cycloserine and PAS.
This study had some limitations. First, concentrations of more than a half of the samples were lower than the Cmax value because most samples were not originally intended for TDM. Further studies into TDM should use samples collected immediately before the test to assess and optimize such multiplex assays. Second, we did not measure hematocrit and hence could not correct for the effect of hematocrit. This may cause differences between plasma and DBS concentrations in some samples. It is possible to measure the hematocrit directly from DBSs: potassium could be used to predict the hematocrit of DBS [16]. Third, our procedure is not universally applicable because a 100-µL spotted volume cannot be drawn from a finger prick, and a falling drop of blood has volume of 30-50 µL. In addition, there were no paired samples obtained by finger prick and venous puncture. Nevertheless, we successfully developed a method to measure nine second-line anti-TB drugs in DBSs simultaneously using UPLC-MS/MS.
So far, a few methods of TDM for second-line anti-TB drugs in plasma or DBSs have been developed [789]. Our study is the first description of a method for the simultaneous measurement of nine second-line anti-TB drugs in DBSs. The performance of our detection technique in DBSs, comparable with those of currently applied methods using plasma, was feasible for application of TDM of second-line anti-TB drugs. We expect that such TDM of second-line anti-TB drugs using DBSs will be crucial in the identification and management of MDR/XDR TB.
 XML Download