

 PDF
PDF ePub
ePub Citation
 Print
Print


INTRODUCTION
Signaling lipids in inflammation control important cellular processes, and an imbalance in metabolic homeostasis may contribute to the pathogenesis of human diseases such as cardiovascular and neurodegenerative diseases [123]. The chronic inflammatory response is partly mediated by lipid peroxidation, uncontrolled proliferation of immune-related cells, and activation of the innate immune system [4], whereas activation of the acute inflammatory response alters cytochrome P450 (CYP) expression and eicosanoid metabolism [5]. Lipid profiling can be used to map the entire spectrum of lipids in biological systems to identify changes in lipid biosynthesis and metabolism that contribute to inflammatory processes [678].
Eicosanoids, biological oxidative metabolites of arachidonic acid (AA), play essential roles in cellular homeostasis as well as in therapeutic applications [910]. These lipid mediators, which include prostaglandins (PGs), thromboxanes (TXs), leukotrienes (LTs), and hydroxyeicosatetraenoic acids (HETEs), are generated from cyclooxygenases (COXs), lipoxygenases (LOXs), and CYP ω-hydroxylase and through non-enzymatic processes. Compared with the analysis of individual circulating inflammation markers such as nuclear factor κB, interleukin (IL)-6, IL-10, C-reactive protein, and tumor necrosis factor-α (TNF-α) [28], the metabolite profiling of signaling mediators may reveal the biological consequences of inflammation.
Gas chromatography-mass spectrometry (GC-MS)-based profiling of eicosanoids is generally performed with chemical derivatization because of their low volatility and polar nature [1112]. However, the lack of analytical stability and assay accessibility limits its use for clinical applications, and instead liquid chromatography-mass spectrometry (LC-MS) is widely used [68131415]. In particular, LC-MS-based lipidomic platforms are useful for both qualitative and quantitative determination of eicosanoids in biological specimens [8131415]. Given the complex regulation of eicosanoid metabolism, it is beneficial to simultaneously quantify various types of lipid mediators rather than to quantify only a limited number of eicosanoids.
Therefore, a method for LC-MS-based quantitative profiling of 32 eicosanoids was developed and validated using rabbit liver S9 fractions. The devised in vitro assay was then used to quantify the metabolites of AA catalyzed by COXs, LOXs, and CYP ω-hydroxylase in liver S9 fractions obtained from rabbits with systemic inflammation, which was induced by injecting 1% carrageenan (CGN) subcutaneously. In addition to corticosteroids, which act as potent anti-inflammatory agents in the treatment of chronic inflammation [1617], endogenous androgens play an important role in regulating inflammation and immune responses [1819]. After confirming the validity of our assay using two known COX inhibitors, celecoxib for COX-2 and ibuprofen for COX-1/2, an in vitro metabolic assay was applied to investigate the new biochemical functions of the androgen epitestosterone, which has complex and diverse metabolic functions in endocrine physiology [2021].
Go to : 
METHODS
1. Materials
Reference standards of the 32 eicosanoids used in this study (Table 1) were obtained from Cayman Chemical (Ann Arbor, MI, USA). The following internal standards were also purchased from Cayman Chemical: 3,3,4,4-d4-6-keto PGF1α for 6-keto PGF1α, 3,3,4,4-d4-PGE2 for the seven prostaglandins and for 11-dehydro TXB2, 3,3,4,4-d4-8-iso PGF2α for the ten isoprostanes, 6,7,14,15-d4-LTB4 for the four leukotrienes, 5,6,8,9,11, 12,14,15-d8-12(S)-HETE for TXB2 and for the five hydroxyeicosaeonic acids, and 5,6,8,9,11,12,14,15-d8-AA for AA. Epitestosterone was obtained from Steraloids (Newport, RI, USA). For solid-phase extraction (SPE), an Oasis MAX cartridge (1 mL, 30 mg; Waters; Milford, MA, USA) was preconditioned with 1 mL methanol followed by 1 mL deionized water. L-Ascorbic acid (reagent-grade) and formic acid (mass spectrometry-grade, 98% purity) were obtained from Sigma (St. Louis, MO, USA), while HPLC-grade methanol and acetonitrile were acquired from Burdick & Jackson (Muskegon, MI, USA). Deionized water was prepared using a Milli-Q purification system (Millipore; Billerica, MA, USA). Ultrafree-MC polyvinylidene fluoride membrane (0.1-µm pore size) filters were obtained from Millipore.
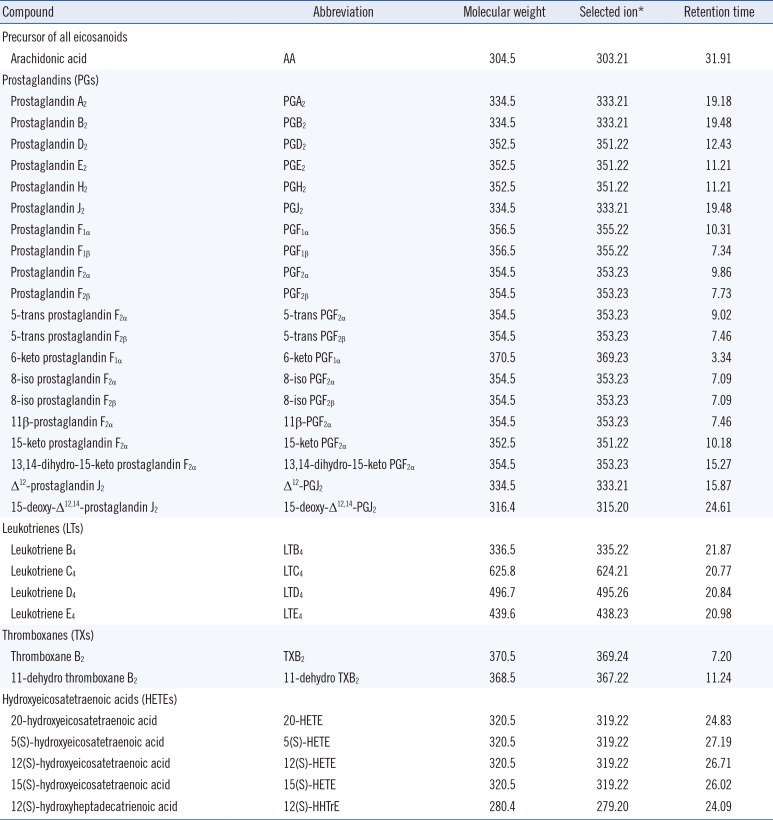
Table 1
Liquid Chromatography-Mass Spectrometry (LC-MS) data for the 32 eicosanoids analyzed
![]()
2. Preparation of liver S9 fractions from rabbits
Ten male New Zealand white rabbits (12 weeks old at the beginning of the experiment) were maintained under standardized conditions (21℃, 41-62% humidity) with a regular day/night (10/14 hr) cycle and free access to water and food. All animal experiments were conducted in accordance with the Korea University Animal Science Rules and Regulations and were approved by the Korea University Institutional Animal Care and Use Committee (KUIACUC20110627-1). The experimental procedures and housing conditions were approved by the Committee of Animal Experimentation, Hiroshima University. The animals in both groups were fed a standard maintenance chow diet (K-H4 pellets; Ssniff; Soest, Germany) and the experimental group animals received regular subcutaneous injections of 1% CGN (0.5 mL per 3 weeks). After three months of treatment, increased levels of serum markers of inflammation (IL-1, IL-6, and TNF-α) were confirmed and then the liver tissues were isolated. All samples were stored at -80℃ until use.
Rabbit livers were homogenized in five volumes of 20mM potassium phosphate buffer containing 0.32 M sucrose and 1mM dithiothreitol (DTT) (pH 6.5). To remove the nuclei and other debris, the whole-liver homogenate was centrifuged at 800g for 10 min, and the resulting supernatant was subjected to further centrifugation at 9,000g for 30 min to yield the liver S9 fraction. The protein content of the final supernatant was then assessed by Bradford assay.
3. Metabolic incubation of rabbit liver S9 fractions
Metabolic incubation was performed as previously described with minor modifications [222324]. The incubation mixture consisted of 50 or 100µM AA, an NADPH-generating system (0.5 µmol NADP+, 5 µmol glucose-6-phosphate, 5 µmol MgCl2), 50 and 100µM celecoxib, ibuprofen or epitestosterone, and 500 µg S9 fraction in a final volume of 0.5 mL in 40 mM potassium phosphate buffer (pH 6.5). Incubation was carried out at 37℃ for 1 hr. An incubation system without COX inhibitors was used as a control. All substrates tested were added under dry conditions and then the incubation mixture was added.
4. LC-MS conditions
Profiling of 32 eicosanoids was performed using an ACQUITY UPLC system (Waters) coupled to quadrupole/time-of-flight-mass spectrometry. Chromatographic separations were carried out on a 1.9-µm particle Hypersil gold-C18 column (50×2.1 mm; Thermo Fisher Scientific; Waltham, MA, USA) at a flow rate of 0.25 mL/min. The gradient elution consisted of 0.1% formic acid in 95% water (solvent A) and 0.1% formic acid in 95% acetonitrile (solvent B) controlled as follows: 0 min: 20% B; 0-15 min: 20-25% B; 15-30 min: 25-70% B; 30-35 min: 70-100% B (hold 2 min); 37-37.5 min: 100-20% B. The gradient was then returned to the initial condition (20% B) and held for 2.5 min before running the next sample. The column and autosampler temperatures were maintained at 30℃ and 4℃, respectively.
At the beginning of the experiment, selected-reaction monitoring (SRM) mode was applied and compared with selected-ion monitoring (SIM) mode. In SRM analysis, most eicosanoids showed precursor ions at [M-H]-, except PGD2 and PGJ2, which were selected using [M-H-2H2O]- ions. However, both PGD2 and PGJ2 showed poor reproducibility in quantitative analysis, and the analytical sensitivity was not improved for many analytes compared with the results of SIM analysis (data not shown). Therefore, all eicosanoids were detected using the negative ionization of the SIM mode with their [M-H]- ions as precursor ions, where hexestrol (1 µg/mL) was used as a lock solution at a flow rate of 5 µL/min. Peak identification was achieved by comparing the retention times and matching the peak height ratios of the characteristic ions to those of standards (Table 1). MS analyses were carried out under the following optimized conditions: capillary voltage of 3 kV, cone voltage of 36 kV, source temperature of 120℃, desolvation temperature of 350℃, cone flow rate of 50 L/hr, and desolvation flow rate of 600 L/hr. The full loop mode was used, and the injection volumes were 20 µL for 40 min runs. Data acquisition and analysis were performed using MassLynx software version 4.1 (Waters).
5. Sample pretreatment
The samples (0.5 mL) were spiked with 20 µL of the six internal standard mixtures (d4-6-keto PGF1α and d4-8-iso PGF2α: 10 µg/mL; d4-PGE2 and d4-LTB4: 20 µg/mL; d8-12(S)-HETE: 25 µg/mL; d8-AA: 200 µg/mL), after which 0.5 mL 0.2% formic acid and 100 µL aqueous 0.2% L-ascorbic acid were added. After loading a sample onto the Oasis MAX cartridge, the cartridge was washed with 1 mL 0.2% formic acid and then eluted off the cartridge with 1 mL 0.1% formic acid in methanol. Combined methanol eluates were evaporated under a nitrogen stream at 40℃. The dried extracts were reconstituted in 100 µL 60% methanol and then subjected to centrifugation through an Ultrafree-MC polyvinylidene fluoride membrane (0.1 µm pore size; Millipore) for 5 min at 13,000g. Twenty microliters of the filtrate was subjected to LC-MS analysis.
Solutions of L-ascorbic acid or butylated hydroxy toluene have been widely used as antioxidants to prevent oxidative decomposition during biological sample preparation, and the relative efficacies of these solutions were assessed in this study. Measurement precision was found to be significantly improved by the addition of one of the two antioxidants: measurement precision for all eicosanoids was <20% when one of the two antioxidants was included and >20% in the absence of antioxidants. L-Ascorbic acid was used in this study because butylated hydroxy toluene is insoluble in water and would thus increase the column-head pressure during LC-MS analysis.
6. Method validation
Eicosanoid-free samples were prepared for calibration and QC purposes, and they were prepared by percolating liver S9 solutions through an Oasis MAX cartridge. In this way, most eicosanoids and other potential interfering compounds were retained in the cartridges, and the eluates were collected as eicosanoid-free samples, which were confirmed by negative results for all analytes.
QC samples containing eicosanoids were quantified using the peak height ratios versus the corresponding internal standards for the eicosanoids, and calibration samples were prepared at nine different concentrations (limit of quantification [LOQ], ~400 ng/mL), which were chosen based on the sensitivity of the method. The limit of detection (LOD) and LOQ were defined as the lowest concentrations with signal-to-noise ratios of >3 and >10, respectively. Precision was expressed as % CV and accuracy as percent relative error (% bias), and these parameters were determined from the QC samples at three different concentrations. Intra- and inter-day assays were assessed by analyzing five replicates of samples run on five different days. Extraction recoveries were determined using eicosanoid-free samples spiked with three different concentrations specific to each calibration range in triplicate for each eicosanoid. Absolute recoveries were calculated by comparing the peak heights of extracted samples versus those of their non-extracted counterparts. The method was found to be linear with a correlation coefficient of R2 >0.99 for all eicosanoids analyzed (Table 2).
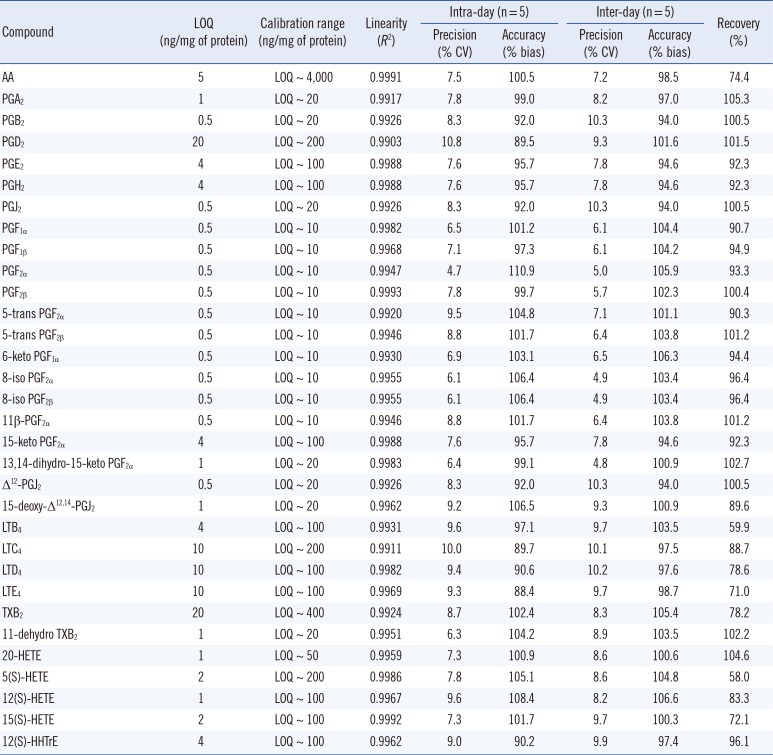
Table 2
Validation of intra- and inter-day assays for the analysis of 32 eicosanoids in S9 fractions
![]()
7. Statistical analysis
Data were analyzed with SPSS 21.0 (SPSS Inc.; Chicago, IL, USA). Quantitative results were expressed as the mean±SD, and groups were compared using an unpaired two-tailed Student's t-test. P values <0.05 were considered statistically significant.
Go to :
RESULTS
1. LC-MS-based analysis of eicosanoids
For sample purification experiments, an Oasis HLB cartridge (3 mL, 60 mg), which is widely used in eicosanoid analysis [1325], was compared with Oasis MAX cartridges (1 mL, 30 mg), which contain quaternary amine-treated mixed-mode anion-exchange sorbent modified from the Oasis HLB sorbent. After sequential conditioning with methanol, ethyl acetate, and methanolic 0.2% formic acid (2 mL each), samples were loaded onto Oasis HLB cartridges. The samples were then washed and eluted with 2 mL 0.2% formic acid and ethyl acetate (2 mL, twice), respectively. For Oasis MAX cartridges, the samples were washed with 1 mL 0.2% formic acid and subsequently eluted with 1 mL methanolic 0.1% formic acid. Extraction recoveries were acceptable for all eicosanoids tested; however, some of the LTs (e.g., LTC4, LTD4, and LTE4) were detected only following SPE using the Oasis MAX cartridges. Although poor recoveries (< 60%) were obtained for LTB4 and 5(S)-HETE, the extraction efficiencies of these species were reproducible and robust (Table 2). The LC-MS-based quantitative eicosanoid profile showed meaningful chromatographic separation from 6-keto PGF1α to AA under the LC conditions used (Fig. 1).
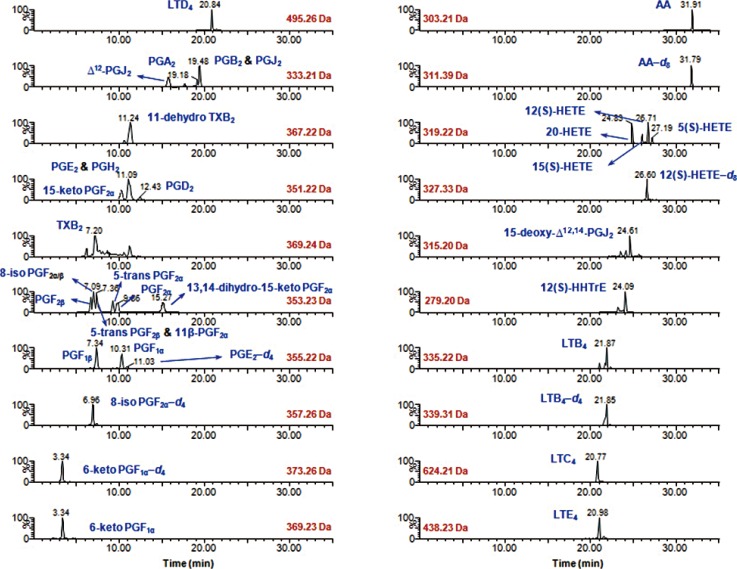 | Fig. 1Representative LC-SIM/MS chromatograms for the 32 eicosanoids analyzed in rabbit liver S9 fractions.Abbreviations: See Table 1; SIM, selected-ion monitoring.
|
For method validation, linearity, LOD, LOQ, precision, and accuracy were evaluated using calibrated samples prepared from eicosanoid-free rabbit liver S9 fractions. A calibration curve was generated for each eicosanoid using the QC samples fortified with all reference standards at different concentrations. The devised method was found to be linear (R2=0.990-0.999) over the dynamic ranges. The LOD and LOQ were determined for all eicosanoids in the range of 0.5-20 ng/mg protein. Precision and accuracy were determined by analyzing three QC samples at three different concentrations for individual eicosanoids. Intra-day (n=5) precision (expressed as % CV) was 4.7-10.8%, while accuracy (expressed as % bias) was 88.4-110.9%, and inter-day (n=5) precision (% CV) and accuracy (% bias) were 4.8-10.3% and 94.0-106.6%, respectively (Table 2).
2. In vitro eicosanoid profiles of CGN-induced inflamed livers
Differences in the eicosanoid profiles of the S9 fractions obtained from rabbits with and without CGN-induced systemic inflammation were assessed by incubating the S9 fractions with AA (Fig. 2). After incubating the S9 fractions with AA in vitro, nine AA metabolites catalyzed by COXs, LOXs, and CYP ω-hydroxylase were quantitatively measured. Among these, COX metabolites were found to be higher in liver S9 fractions from inflammation-induced rabbits than from control rabbits (P<0.05; Fig. 2A), whereas 20-HETE catalyzed by CYP ω-hydroxylase was significantly lower in liver S9 fractions from inflammation-induced rabbits than from control rabbits (P<0.05; Fig. 2B). Eicosanoid metabolites catalyzed by LOXs generally increased in a dose-dependent manner in the S9 fractions prepared from CGN-treated rabbits (P<0.05; Fig. 2C).
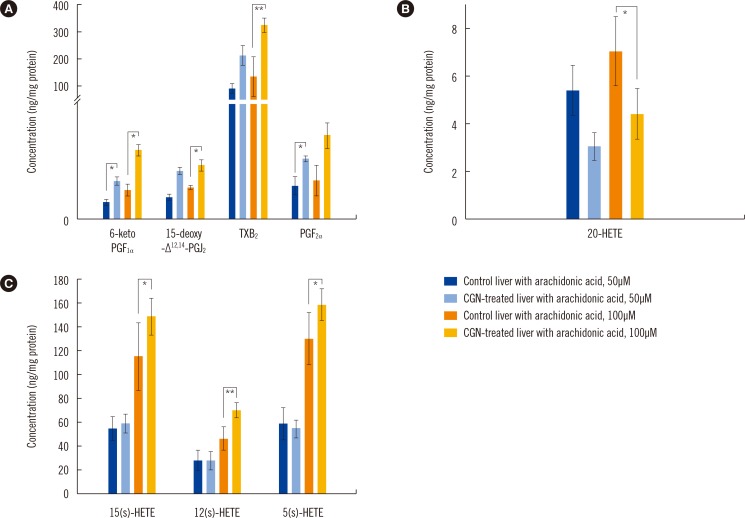 | Fig. 2Quantification of eicosanoids in liver S9 fractions obtained from CGN-treated rabbits and control (untreated) rabbits. Differences in eicosanoid levels were examined for (A) COX-, (B) CYP ω-hydroxylase-, and (C) LOX-derived metabolites with 50 and 100 µM arachidonic acid. *P<0.05 and **P<0.01.Abbreviations: See Table 1; CGN, carrageenan; LOX, lipoxygenase.
|
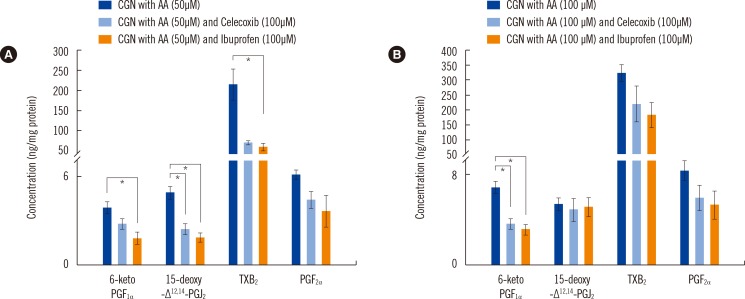
To validate our in vitro assay and method of eicosanoid quantification, two different inhibitors were tested: celecoxib, a selective COX-2 inhibitor, and ibuprofen, a dual inhibitor of both COX-1 and COX-2 (Fig. 3). The COX inhibitors reduced the levels of COX metabolites [26]. Compared with ibuprofen, selective COX-2 inhibitor (celecoxib) showed less interference with the irreversible inhibition of COX-1. In particular, ibuprofen, a nonselective COX inhibitor, caused greater changes in metabolite levels (6-keto PGF1α [the stable metabolite of PGI2], 15-deoxy-Δ12,14-PGJ2 [the stable metabolite of PGD2], and TXB2 [the stable metabolite of TXA2]) than celecoxib.
3. Biochemical roles of epitestosterone in eicosanoid metabolism
Epitestosterone was evaluated for its potential to affect metabolic enzyme expression in eicosanoid metabolism in CGN-treated rabbit liver S9 fractions. Epitestosterone reduced the levels of 6-keto PGF1α, 15-deoxy-Δ12,14-PGJ2, PGF2α, and TXB2 in terms of a balanced pathway toward the preferential inhibition of eicosanoids in liver S9 fractions from CGN-induced rabbit models of inflammation. Among these, the levels of 6-keto PGF1α and 15-deoxy-Δ12,14-PGJ2 significantly decreased following both 50 and 100µM epitestosterone treatment compared with non-treated samples (P<0.05). All HETEs measured, except 5(S)-HETE and PGF2α were generally suppressed, but the differences were not statistically significant (Fig. 4). Induction of both COX-1 and COX-2 by inflammatory mediators does not increase all PGs produced by a given cell type.
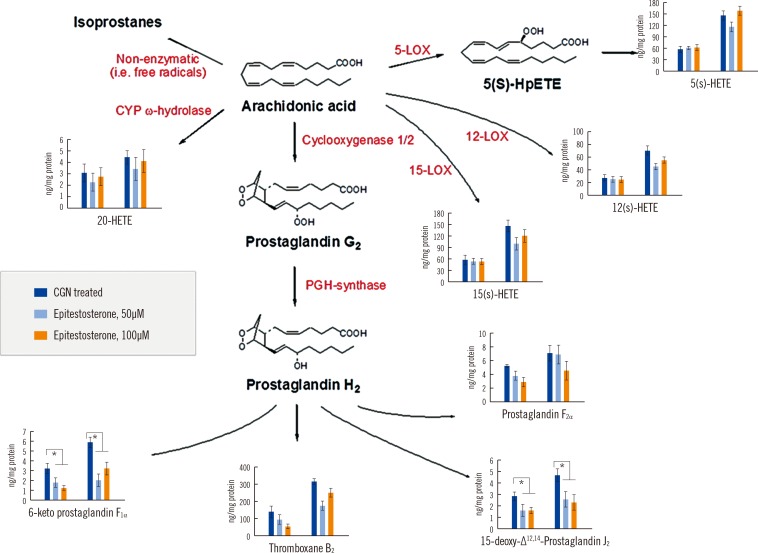 | Fig. 4Changes in eicosanoid metabolism affected by epitestosterone in liver S9 fractions from CGN-induced rabbit models of inflammation. Different levels of arachidonic acid (50 or 100µM) were tested. Differences among eicosanoid levels after treatment with epitestosterone (50 or 100µM) were measured (n=8, each concentration). *P<0.05.Abbreviations: See Table 1; CYP, cytochrome P450; LOX, lipoxygenase; CGN, carrageenan.
|
Go to :
DISCUSSION
We developed an LC-MS method for the quantitative profiling of eicosanoids from CGN-treated rabbit liver S9 fractions as an in vitro eicosanoid metabolic assay. We applied this assay to evaluate metabolic alterations in eicosanoid levels affected by epitestosterone, which may regulate inducible COX enzymes since it is an endogenous androgen [1819].
Comprehensive LC-MS-based methods previously reported for the measurement of eicosanoids in biological specimens exhibited good chromatographic properties as well as reliability, which are ideal features of a lipidomics platform [68131415]. To optimize the accuracy and reproducibility in the quantification of eicosanoids in liver S9 fractions, sub-2 µm particle LC columns were used, as these columns selectively eliminated interference in the liver S9 fraction, combined with anion-exchange SPE purification. The devised method successfully separated most eicosanoids with good peak shapes and with retention times ranging from 3.34 for 6-keto PGF1α to 31.91 for AA, while PGE2 and PGH2, 8-iso PGF2α and PGF2β, 5-trans PGF2β and 11β-PGF2α co-eluted (Fig. 1).
Sample preparation techniques involving SPE were also optimized to concentrate the analytes and reduce sample complexity in the liver S9 fractions. Oasis HLB cartridges contain a unique copolymer sorbent that allows for highly selective extraction of various lipid molecules [132427]. Under SPE conditions, both the sample loading and washing steps are critical for preventing sample loss and improving extraction selectivity. When six different SPE methods were compared to determine the overall extraction recovery of 13 stable isotope-labeled eicosanoids added to the blood plasma [1415], the Oasis HLB protocol not only efficiently removed matrix interference, but also could not detect LTs, including LTC4, LTD4, and LTE4, which were measured by our method with the Oasis MAX cartridges. According to our initial experiments, no eicosanoids were detected in both the loading and washing fractions using the Oasis MAX procedure, unlike in the case of the Oasis HLB procedure, and thus the Oasis MAX was used to remove background interference derived from the liver S9 fractions.
In general, PGs and TXs, the formation of which is catalyzed by COX isoenzymes, play a key role in inflammatory response activation and significantly increase in inflamed tissues [2628]. As LOX metabolites, 5- and 12-HETEs also increased by inflammation [29], while 20-HETE was suppressed by systemic inflammation in vivo [5]. In this study, S9 fractions from rabbit models of systematic inflammation induced by CGN treatment exhibited enhanced formation of the three PGs, TXB2, and three HETEs compared with those from control rabbits (excluding 20-HETE, the levels of which were decreased; Fig. 2). In contrast to COX-1, which produces PGI2, TXA2, PGD2, and 12(S)-HHTrE, COX-2 catalyzes the formation of PGE2 and may increase the levels of PGE2, PGF1α, and TXB2 [30]. In both in vivo and in vitro experiments, celecoxib has been shown to inhibit 5-LOX but not the other LOXs [31]. In this study, the levels of all detected HETEs, including 20-HETE, 5(S)-HETE, 12(S)-HETE, and 15(S)-HETE, were not altered by celecoxib or ibuprofen (data not shown). As expected, the levels of other metabolites such as 6-keto PGF1α, 15-deoxy-Δ12,14-PGJ2, PGF2α, and TXB2 were reduced by each of these inhibitors (Fig. 3). This result is comparable to those of a previous report that demonstrated that acute inflammation decreased the production of some eicosanoid metabolites, particularly of 20-HETE [32].
Regarding the effects on eicosanoid metabolism, COX-catalyzed metabolites were reduced after epitestosterone treatment, while LOX metabolites did not significantly change (Fig. 4). Following epitestosterone treatment at 50µM, four COX metabolites were dose-dependently suppressed, but some were not altered following treatment with 100µM epitestosterone. This may be because of the fluctuating inhibitory activity of epitestosterone for COXs and LOXs, which leads to different responses towards inflammation, depending on the samples tested, e.g., pure enzyme or cell homogenates [33]. The serum levels of androgens, including testosterone and dehydroepiandrosterone sulfate, are inversely correlated with the disease severity of rheumatoid arthritis [19]. In particular, as a major androgen, testosterone has immune-modulating properties and may stimulate anti-inflammatory cytokines such as IL-10 [34]. Epitestosterone, a naturally occurring steroid hormone, is an epimer of testosterone. Its biological significance is controversial, as it has been suggested to act as a biologically inactive metabolite or may have antiandrogenic effects by competing with testosterone for androgen receptor binding sites [2021]. The antiandrogenic effects of epitestosterone on androgenic alopecia have been proposed to result from its competition with testosterone for binding to androgen receptors [35], but hair loss may also be prevented by its anti-inflammatory actions because androgenic alopecia is closely associated with inflammation [36]. We suggest that epitestosterone uses a similar mode of action on COX-1 as ibuprofen; however, epitestosterone needs to be further investigated as a potential inhibitor of COX-dependent inflammation.
This study has several limitations. First, our in vitro experiments evaluating metabolic alterations caused by epitestosterone were conducted in inflamed rabbit liver S9 fractions; however, lipid metabolism in rabbits differs from that in humans [37]. Additionally, fixed doses of epitestosterone were used in the in vitro experiments and thus are not representative of doses present in human circulating blood. The present study focused more on the development of an LC-MS-based in vitro screening assay to identify metabolic changes in eicosanoids than on inflammation-associated responses.
In conclusion, an in vitro assay coupled with a novel LC-MS assay was developed to quantitatively determine eicosanoid signatures. The method was validated using the known COX inhibitors—celecoxib and ibuprofen. Moreover, changes in the levels of a large number of eicosanoids were measured, thereby shedding light on the coordinated effects of epitestosterone on inhibiting the release of AA metabolites associated with lipid metabolism. Given the complex physiological processes involved in anti-inflammatory responses in cells, our results do not indicate that epitestosterone has an anti-inflammatory effect but reveal metabolic suppression of COX-mediated metabolites of AA in the presence of epitestosterone. The present method will be useful for assessing the biochemical responses of eicosanoid metabolism affected by the pharmacometabolic actions of inflammatory mediators.
Go to :
 XML Download