

 PDF
PDF ePub
ePub Citation
 Print
Print


INTRODUCTION
Myocardial infarction (MI) is accompanied by structural and geometric changes in the heart [1]. Early remodeling is characterized by the stretching and thinning of the myocardium and the dilation and spherification of the left ventricle. The acute stretching of the viable myocardium maintains the pumping function despite the decrease in its contracting function [1]. If more than 20% of the left ventricular mass is affected, the compensation is inadequate. A traditional indicator of the stretching of cardiomyocytes and the development of chronic heart failure is the level of the N-terminal pro-brain natriuretic peptide (NT-proBNP) [23]. However, the widespread application of this indicator is limited by its biological variation, as it varies according to sex, age, and body mass index. The levels of NT-proBNP may vary also in other pathologies, such as infections and kidney diseases [4].
ST2 is an early marker of myocardial remodeling, and this understudied growth-stimulating factor is expressed on macrovascular (aortic and coronary artery) and microvascular endothelial cells in the heart in humans [5] and on cardiomyocytes in rats and mice [3] when under biomechanical stress [6]; thus, it is a novel and promising marker. ST2 is a member of the family of interleukin (IL)-1 receptors. The main function of ST2, which potentiates IL-33, is to exert antihypertrophic and antifibrosing effects on cardiomyocytes that are under biomechanical stretching conditions [78]. However, an acute increase in the ST2 level has been observed when damage is accompanied by the inhibition of IL-33 and its favorable antihypertrophic effects. Studying the role of ST2 during hospitalization for MI can be helpful for predicting the course of the hospitalization and development of complications [391011]. The aim of this study was to determine the level of soluble ST2 (sST2) and its correlation with the level of NT-proBNP and with the clinical course of MI during hospitalization.
Go to : 
METHODS
1. Study population
For this study, 88 patients (64 men and 24 women with a median age of 58 [55;64)] yr) with MI between January 2011 and December 2013 were recruited and verified by using the All-Russian Scientific Society of Cardiology (2007) and ESC/ACCF/AHA/WHF [12] diagnostic criteria for the diagnosis of MI, namely, the presence of typical chest pain lasting longer than 20 min, ST-segment elevation of 0.1 mW in two or more contiguous leads, or the appearance of a complete left bundle branch block on an ECG, as well as laboratory findings (elevated CK [creatine phosphokinase], CK-MB, and troponin T levels [>0.1 ng/mL]). The exclusion criteria included previously or newly diagnosed type 2 diabetes at the time of the index event, diagnosis of severe diseases affecting prognosis (including anemia, renal and hepatic failure, cancer, acute infectious and inflammatory diseases), autoimmune diseases, long-term corticosteroid therapy, and death during the hospitalization. The demographic data of patients are presented in Table 1.
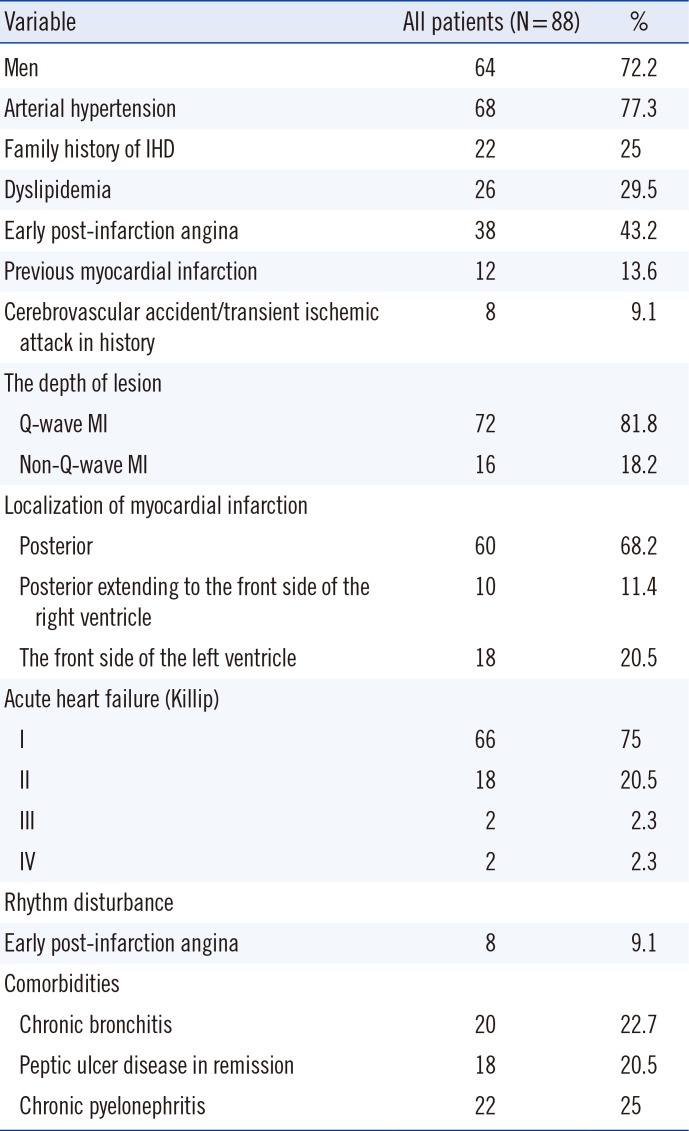
Table 1
Baseline clinical and anamnestic characteristics of the patients
![]()
The control group included 30 participants without cardiovascular diseases or diabetes, and the members were comparable in age and sex ratio to the enrolled patients.
The study protocol was approved by the local ethics committee of the Federal State Budgetary Institution "Research Institute for Complex Issues of Cardiovascular Disease" and was developed in accordance with the WMA Declaration of Helsinki "Ethical principles for medical research involving human subjects" (amended in 2000) and "Rules for clinical practice in the Russian Federation" approved by the Ministry of Health of the Russian Federation on June 19, 2003. All patients provided written informed consent prior to their participation in the study.
Among all patients included in the study, 34 had a history of hypertension, and 13 had hypercholesterolemia. We identified 18 patients with angina of different functional classes and 4 with acute cerebrovascular accidents. Eleven patients had a family history of coronary artery disease. A total 26 patients were current smokers.
The complications observed during the hospitalization for MI were early postinfarction angina in eight patients (9.1%), rhythm disturbances in four (4.5%), recurrence of MI in six (6.8%), and clinical manifestations of acute heart failure (AHF) (Killip class II-IV) in 22 (25.1%). Depending on the course of the hospitalization, the patients were divided into two groups: the favorable (n=58) and unfavorable (n=30) outcome groups. Depending on the concentration of sST2 35 ng/mL, all patients were divided into two groups below (Group 1) or above (Group 2) at this level (Table 2).
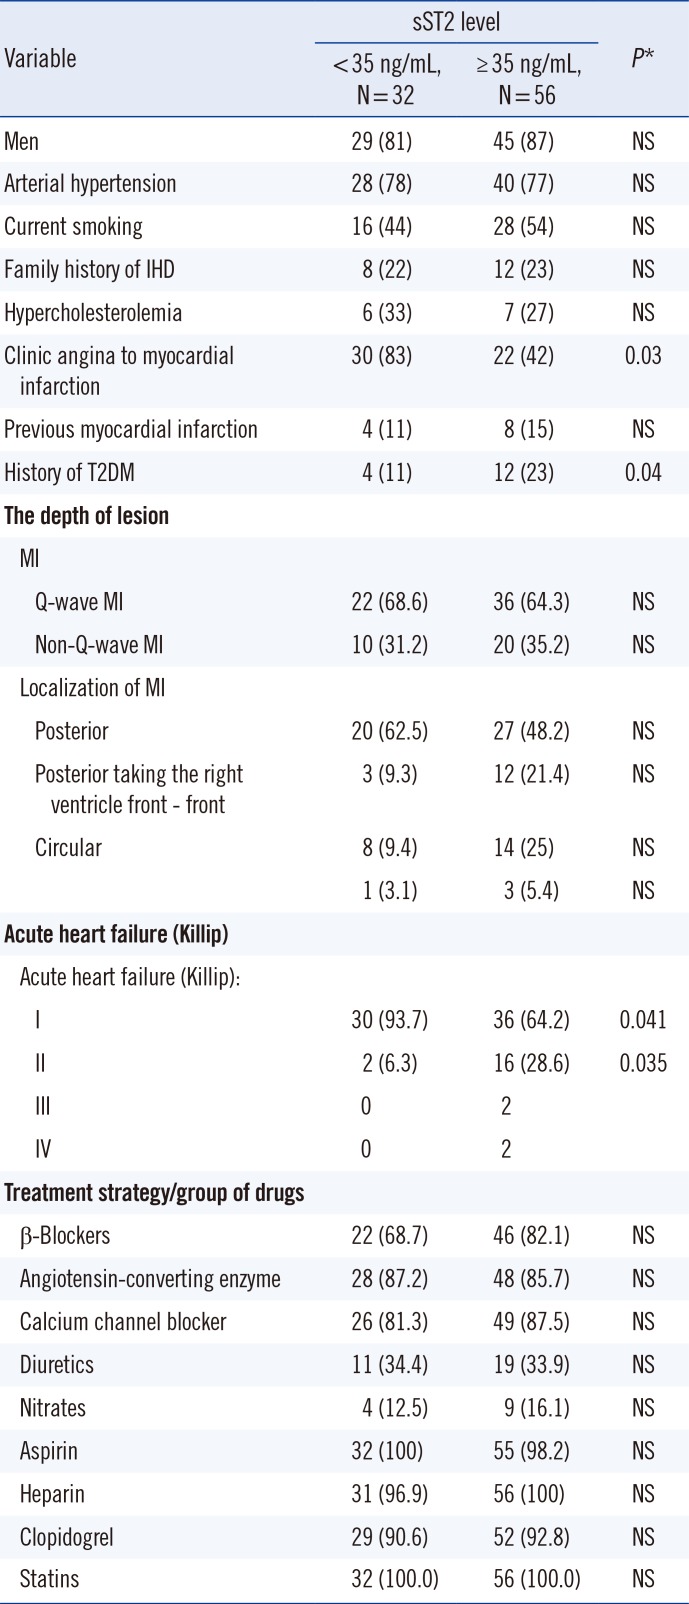
Table 2
Initial clinical and anamnestic characteristics of the patients according to the sST2 level
![]()
Unless contraindicated, all patients received combined coronary active, antithrombotic, and lipid-lowering therapy, including aspirin, clopidogrel, β-blockers, angiotensin-converting-enzyme (ACE) inhibitors, statins, and antianginal medications, during the hospitalization period in accordance with standard clinical practice.
2. Assays
Serum was separated from venous blood by centrifugation at 3,000g for 20 min and stored at -70℃. sST2 levels were measured with the Presage ST2 assay (Critical Diagnostics, San Diego, CA, USA). This assay has a within-run CV < 6.5% and total CV < 9.1% at a mean concentration 16.9 ng/mL. We measured NT-proBNP with the Biomedica kit (Bratislava, Slovakia). The intra-assay CVs were 5 and 8% at a mean concentration of 13 fmol/mL. Troponin T levels were measured with Roche CARDIAC (Roche Diagnostics, Mannheim, Germany). All Roche assays were performed with the use of the Elecsys 2010 system (Roche Diagnostics): Troponin T (fourth generation) with a limit of detection of 0.01 ng/mL, a 99th-percentile cutoff point of less than 0.01 ng/mL, and a CV of less than 10% at 0.035 ng/mL.
3. Statistical analysis
Statistical analysis was performed by using Statistica 6.1. (StatSoft, Tulsa, OK, USA) and SPSS 10.0 for Windows (SPSS Inc., Chicago, IL, USA). Results are presented as the median (Me) and the Me 25 and 75% quartiles (Q1;Q3). Nonparametric tests were used to assess and analyze the data. The Mann-Whitney U test or the Kolmogorov-Smirnov method (more than 50 cases in each group) was used for quantitative comparisons of two independent groups. The Spearman rank correlation coefficient was used to investigate relationships between variables (P<0.05). The value of R (rank correlation coefficient) is 0.3 or less - low rates closeness of the connection; values greater than 0.4 but less than 0.7 - indicators of moderate closeness of the connection, and the values of 0.7 and more - high-performance connection tightness [13]. Stepwise logistic regression analysis with odds ratios (OR) and 95% confidence intervals (CI) was used to determine the prognostic significance of parameters regarding long-term prognosis. Cox regression was used to evaluate the risk of unfavorable events; the impact of independent variables as predictors of risk was determined. A P<0.05 was considered statistically significant.
Go to :
RESULTS
On day 1 of hospitalization for MI, the levels of sST2 and NT-proBNP increased by 2.4-fold and 4.5-fold, respectively, compared with the control group [44.75 (24.90; 93.56) ng/mL, P=0.002; 18.81 (15.12; 21.03) ng/mL] [36.84 (24.09; 89.26) fmol/mL, P=0.000; 8.23 (5.61; 11.12) fmol/mL)].
By day 12, the sST2 level significantly decreased by 2.5-fold [17.82 (15.30; 23.25 ng/mL, P=0.001], whereas the changes in the NT-proBNP level were not significant (Fig. 1).
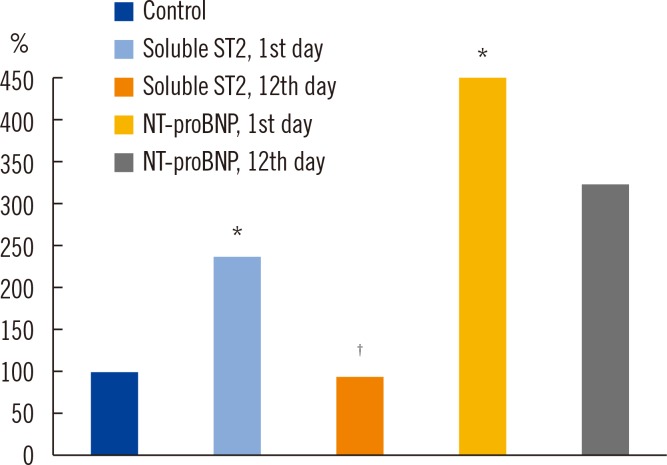 | Fig. 1Concentration of soluble ST2 and the N-terminal pro-brain natriuretic peptide (NT-proBNP) in the patients on day 1 and day 12 after myocardial infarction.
*Compared with the control group (P=0.002 for comparison of sST2 concentrations; P=0.001 for comparison of NT-proBNP concentrations); †Statistically significant differences between groups at day 12 (P=0.001).
|
The results of the correlation analyses indicated a moderate correlation between the levels of sST2 and NT-proBNP in both groups on days 1 (R=0.50, P=0.001) and 12 of MI hospitalization (R=0.55, P=0. 0002).
According to experimental data, sST2 in animals is expressed only in cardiomyocytes during myocardial injury; nevertheless, we were interested in the correlation analysis between troponin T (the classic marker of cardiomyocyte damage) and sST2 concentrations during the MI hospitalization period. The results of the correlation analyses indicated a direct correlation between the levels of sST2 and troponin T in both groups at the time of admission (R=0.65, P=0.002).
A comparative analysis of the levels of sST2 and NT-proBNP in both groups (favorable (n=58) and unfavorable (n=30) outcome) was performed, and the results are shown in Table 3. The level of sST2 in the unfavorable outcome group on day 1 was 2-fold higher than that in favorable outcome group. The sST2 levels increased by 1.9- and 3.7-fold in the favorable and unfavorable outcome groups, respectively, compared with those in the control group.
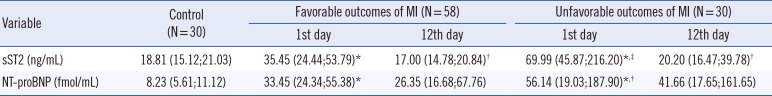
Table 3
Concentration of soluble ST2 and N-terminal pro-brain natriuretic peptide (NT-proBNP) in the patients hospitalized for myocardial infarction
![]()
On day 12 after MI onset, the sST2 level was significantly lower (P=0.011) in subjects in both groups compared with the level in the control group.
In contrast to sST2, the level of NT-proBNP increased equally in both the favorable and unfavorable outcome groups up to day 12 of the study. The highest increase in the NT-proBNP level (6.8-fold) was observed in patients in the unfavorable outcome group on day 1.
A level of sST2 higher than 35 ng/mL is considered an indicator of adverse outcome development in cardiovascular pathology [1013]. Thus, in the next stage of our study, we analyzed the differences in the clinical and anamnestic characteristics of the subjects by categorizing the sST2 level as lower (Group 1) or higher (Group 2) than the critical level of 35 ng/mL (Table 2). In Group 2 (sST2 concentration above 35 ng/mL), according to the clinical and anamnestic characteristics, complications [MI (44.6%) and diabetes mellitus (23%)] during hospitalization were more common. In Group 1 (sST2 level lower than 35 ng/mL), the percentage of adverse events and complications during hospitalization was significantly lower (P=0.021).
Conversely, analysis of individual patient data indicated that five patients (15.6%) with a poor prognosis had an sST2 concentration lower than 35 ng/mL, whereas 31 (55.4%) patients with a favorable prognosis had an sST2 level higher than 35 ng/mL.
The results of the evaluation of the NT-proBNP level as a function of sST2 are shown in Table 4. On day 1, in patients with sST2 concentrations above 35 ng/mL, the concentration of NT-proBNP increased by 6.7-fold compared with the controls. At the same time, in patients with a moderate increase in the concentration of sST2 (less than 35 ng/mL), the concentration of NT-proBNP also increased, although to a lesser degree (4.6-fold compared with the controls). At day 12, the level of NT-proBNP remained elevated in both groups and did not differ significantly between the two (Table 4).
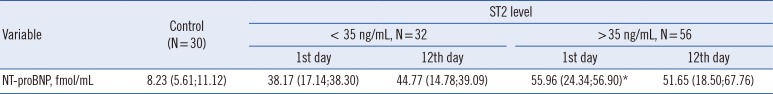
Table 4
Concentration of N-terminal pro-brain natriuretic peptide (NT-proBNP) in patients hospitalized for myocardial infarction
![]()
Logistic regression analysis showed that an increase in the concentration of sST2 increased the risk of complications during the hospitalization by 1.7-fold times (OR, 1.7; 95% CI, 1.6-2.8; areas under curve [AUC]=0.78; P=0.003), with sensitivity of 76.9% and a specificity of 69.4%. At the same time, the increase in the level of NT-proBNP was accompanied only by a 1.2-fold increase in adverse outcomes (OR, 1.2; 95% CI, 1.1-1.6; AUC=0.69; P=0.034), without affecting the high diagnostic sensitivity (69.6%) and specificity (65.3%).
Determining the level of sST2 in combination with NT-proBNP increases their diagnostic significance (OR, 1.92; 95% CI, 1.7-3.2). These indicators, when used together and measured at the early stages of MI, increased the quality of the model, with sensitivity of 81%, specificity of 72%, and AUC of 0.86.
Go to :
DISCUSSION
MI is accompanied by the mechanical deformation of cardiomyocytes, which may undergo adaptive and maladaptive changes, leading to chronic heart failure [1]. In response to increased wall tension of the heart ventricles, the intracardiac pressure increases, resulting in increased cardiomyocyte volume and the synthesis of factors such as NT-proBNP and sST2, which function to increase myocardial performance [3].
Our study showed that on day 1 after MI, the NT-proBNP concentration increased 4.5-fold (Fig. 1) and remained elevated up to day 12 of the study. It was shown in BNP transgenic mice that following artificially induced MI, the infarcted area increased by about 5-fold during the 48 hr following MI onset and remained at an increased level over the next three to four weeks [1415]. When the disease course was unfavorable, the NT-proBNP concentration increased even more, to 6.8-fold compared with the control values. In addition to the mechanical stretching of the ventricles, there may be other mechanisms that stimulate the production of NT-proBNP, such as ischemia in various locations, arrhythmias, myocardial hypertrophy, and endothelial dysfunction [16]. However, in this study, the NT-proBNP level had a low diagnostic sensitivity and specificity as an indicator of an unfavorable course following MI, with its increase indicating only a 1.2-fold increase in the risk for complications.
The stimulating growth factor sST2 had a higher sensitivity for the development of a poor prognosis. With its increase on day 1, there was a 1.7-fold increase in the risk of an unfavorable outcome following MI. Compared with the controls, the sST2 level increased by 1.9-fold in cases with a favorable course of MI and increased 3.7-fold in cases of unfavorable outcomes (Table 2). Elevated levels of sST2 have been associated with an increase in the synthesis of sST2 in cardiac myocytes and fibroblasts due to biomechanical stress [31718].
ST2 is a member of the superfamily of IL-1 receptors. It exists in two forms: a transmembrane receptor (ST2L) and soluble receptor-trap (sST2). The ST2 ligand is IL-33, which contributes to the process reduction of the fibrosis and hypertrophy of tissues under mechanical loads [19]. sST2 acts as a decoy receptor by binding free IL-33 and preventing its signaling through ST2L [2021]. A moderate increase in the concentration of sST2 probably exerts a protective effect, which manifests itself in patients with a favorable course of MI [39]. The transmembrane form protects the myocardium from overcharging, whereas the soluble form of ST2 prevents this protective mechanism, binds to IL-33, and blocks its cardioprotective effect [320]. Perhaps the increase in the concentration of sST2 in cases of unfavorable outcomes is associated with an increased content of the soluble form of the marker following release by damaged cardiomyocytes.
Both sST2 and troponin levels have been measured in several other studies. In the study by Mueller et al. [22] in 2015, in contrast to our study, no correlation between sST2 and troponin levels was found. This difference can be explained by the fact that we measured biomarkers in patients in the acute phase of MI, whereas the patients in the study by Mueller et al. [22] had heart failure.
In the present study, by day 12 following MI, sST2 concentrations decreased to the level of control values, thus making it difficult to distinguish between the favorable and unfavorable outcome groups. The dynamics of the sST2 changes are somewhat similar to those of C-reactive protein (CRP). CRP levels increased acutely during acute MI; however, this marker tended to decrease by day 12 after MI onset [23]. This similarity indicates their common inflammatory nature. These results are consistent with those reported in the study by Weinberg et al. [24], which was performed on an experimental MI model (in vivo) by using C57/BL6J mice. After ligating the coronary artery, the maximal transcriptional induction of sST2 in cardiac myocytes occurred within 2 hr, was maintained for 9 hr, and decreased after 15 hr.
Studies have shown that the sST2 threshold in patients with chronic heart failure is 35 ng/mL. Above this value, the risk of death increases dramatically within one year of the event [91018]. Kohli et al. [10] reported similar results, showing that high levels of sST2 (>35 ng/mL) in patients suffering from acute coronary syndrome predicted a 3-fold higher risk of cardiovascular death and heart failure within 30 days and one year. It is of particular interest to study such patterns in a cohort of patients with MI. In our study, the adverse outcomes during the early period of MI were not associated with sST2 levels above 35 ng/mL, as there were complications in patients with levels below (15.5%) and above (55.4%) the threshold. These results were probably affected not only by the level of sST2 but also by the presence of other factors, specifically the increase in NT-proBNP. Indeed, the use of these two markers together significantly increases their sensitivity and specificity of predicting the risk of unfavorable MI outcomes [25].
Our findings are consistent with the study by Sabatine et al. [18], in which unfavorable outcomes were observed with high levels of both markers (risk of death or developing heart failure was 6.5-fold higher) during the 30-day observation period. Using the levels of NT-proBNP and sST2 to construct the receiver operating characteristics curve, the identification of combined cardiovascular mortality or heart failure significantly improved to 0.78 (95% CI, 0.74-0.83; P=0.0025).
In conclusion, the concentration of sST2 is a more sensitive indicator of the course of hospitalization for MI than the traditional indicator of the NT-proBNP concentration. Increased concentrations of sST2 on day 1 after MI were followed by an unfavorable hospitalization course, including progressive angina, arrhythmias, MI, and recurrent symptomatic AHF (Killip class II-IV).
Go to :
 XML Download