

 PDF
PDF ePub
ePub Citation
 Print
Print


INTRODUCTION
Glycosylated hemoglobin (A1c) has been established as the gold standard index for long-term glycemic control and the A1c level of 6.5% is utilized for the diagnosis of diabetes mellitus (DM) [1]. A1c levels are a reflection of glycemic control over 8-12 weeks but do not effectively predict glycemic fluctuations. On the other hand, glycated albumin (GA) reflects glycemic status over a period of 2-4 weeks and responds more rapidly to changes of the glycemic level, enabling the monthly evaluation of the response to treatment [2].
Cardiovascular disease (CVD) is the leading cause of mortality among patients with type 2 DM (T2DM) along with renal diseases [3]. Clear risk factors for CVD in patients with T2DM are hypertension and dyslipidemia, which are common. Additionally, DM is an independent CVD risk factor [4]. Lower control of A1c appears to reduce fatal and non-fatal vascular risks [5]. In patients with T2DM, cholesterol and lipid levels are significantly higher in patients with CVD than in patients without CVD [6]. Moreover, lipid ratios are more sensitive predictors of morbidity and severity of CVD than individual lipid parameters [7]. The LDL/HDL ratio is higher in patients with coronary heart disease than in the control group [8]. Along with GA, GA/A1c was suggested as a new indicator of glycemic variability, irrespective of the diabetes type [9]. GA is implicated as the causal factor in the artherosclerotic process by interacting with endothelial cells [10]. Albumin irreversibly glycated induces marked chemical and morphological changes of LDL particles isolated from normal and diabetic subjects [11], and LDL-receptor-mediated clearance mechanisms are impaired by advanced glycation end products, which may contribute to elevated LDL levels in diabetic patients [12]. On the basis of these reports, we speculated that A1c and GA could be related to lipid profiles.
This study was designed to investigate whether GA could serve as a diagnostic tool for DM compared with A1c. Secondly, we investigated the correlations of GA with serum lipid profiles and compared the results to that of A1c. We further evaluated the associations of glycemic indices with lipids in patients with T2DM receiving treatment.
Go to : 
METHODS
1. Subjects
The present study is a retrospective and cross-sectional investigation.
For the diagnostic utility of GA for DM, we recruited normal control subjects and patients newly diagnosed with T2DM. Normal controls, from whom blood samples were drawn to measure fasting serum glucose, A1c, triglyceride (TG), total cholesterol (TC), HDL, and LDL, were recruited from our health examination center at the same time in May 2013. The exclusion criteria were as follows: (1) history of DM; (2) chronic kidney diseases (creatinine >1.5 mg/dL); (3) abnormal albumin level (albumin<3.5 g/dL); (4) increased AST and/or ALT levels (AST >40 IU/L, ALT >40 IU/L). One hundred sixty three subjects were included in the non-diabetic group (group 1) according to the medical history and/or the DM diagnostic criteria for A1c level ≥6.5%. GA concentration was measured in the serum drawn on the same day.
Patients newly diagnosed with T2DM were recruited in our hospital among patients for whom A1c and GA measurements were requested for the first time between October 2013 and September 2015. The same exclusion criteria were applied. From 240 patients, patients with a previous history of DM (n=118) and patients proven not to be diabetic (n=8) were excluded. Two patients were excluded for increased creatinine levels, nine for abnormal albumin or AST/ALT, and one for thyroid disease. One hundred two subjects were categorized in the group of patients newly diagnosed with T2DM (group 2).
To investigate the correlations between glycemic indices and serum lipid profiles, patients with T2DM receiving treatment were recruited. Data from 2,651 patients with GA results from the endocrinology department were reviewed between August 2013 and December 2014. Owing to the lack of laboratory tests, only 280 patients were eligible for the analysis of the relationship between glycemic indices with serum lipids. Of the 280 patients, one non-diabetic patient was excluded and 16 patients were categorized in group 2. Two hundred sixty three patients were eligible (group 3). To compare the potential of GA and A1c as the indicators of dyslipidemia in group 3, we divided the patients into two groups; A1c<7.0% and ≥7.0% based on the glycemic control target value [13], corresponding to GA<17.0% and ≥17.0% derived from our simple equation; GA=2.48×A1c.
This study was approved by the local Institutional Review Board (IRB #EUMC 2015-01-029-001), which decided to waive the informed consents.
2. Laboratory methods
Venous blood samples were collected from subjects after at least an 8-hr-fast. Serum samples of normal controls were refrigerated at 4℃ after centrifugation. Serum GA was measured with Lucica GA-L glycated albumin Assay kit (Asahi Kasei Pharma Co., Tokyo, Japan) with the Hitachi 7600-110 analyzer (Hitachi, Tokyo, Japan) adapted to the Modular P Roche system (Roche Diagnostics GmbH, Mannheim, Germany). Serum GA is hydrolyzed to amino acids by albumin-specific proteinase and then oxidized by ketoamine oxidase to produce hydrogen peroxide, which is measured quantitatively. Next, the albumin concentration was measured by the bromocresol purple (BCP) method and, finally, GA levels were calculated as a percentage of GA relative to albumin. GA (%) was computed according to the manufacturer's instructions as (GA/modified BCP serum albumin)×100/1.14+2.9 [14], modified for higher correlation with HPLC measured GA value [15]. Total coefficients of variation of GA assay were 1.48% and 1.17% for low (11.3%) and high (36.2%) concentrations of GA, respectively. The reference interval of the GA assay was 10.24% to 15.82%.
A1c was measured by ion exchange HPLC using Tosho HLC-732 G8 (Tosho Bioscience, Tokyo, Japan). A1c measurement was standardized to the Diabetes Control and Complications Trial (DCCT) reference assay and reported as a % result according to the National Glycohemoglobin Standardization Program standards [16].
Serum glucose levels were measured by using hexokinase method with Hitachi 7600-110 and the L-type Glu 2 reagent (Wako pure chemical industries, Osaka, Japan). Serum TG, TC, HDL, LDL, creatinine, AST, and ALT were determined by routine procedures using the Hitachi 7600-110.
3. Statistics
All statistical analyses were performed by using Analyse-it, 3.90.5 (Analyse-it Software, Ltd, Leeds, UK). Correlations among the three glycemic indices (glucose, A1c, and GA) were checked by simple linear regression analysis. The diagnostic utility of GA compared with that of A1c was assessed by ROC curve analysis according to the presence of DM to determine the cut-off value of GA for DM diagnosis. Correlations between GA, A1c, and serum lipid profiles were analyzed by Pearson correlation coefficient. The r less than 0.35 was interpreted as a low correlation, 0.36 to 0.67 as a moderate correlation, 0.68 to 1.0 as a high correlation, and greater than 0.90 as a very high correlation [17]. Statistical comparisons of lipid profiles and the incidence of dyslipidemia between subgroups of patients with T2DM receiving treatment were performed by Wilcoxon-Mann-Whitney test and Chi-squared test. P<0.05 was considered statistically significant.
Go to :
RESULTS
1. Correlation between serum glucose, GA, and A1c
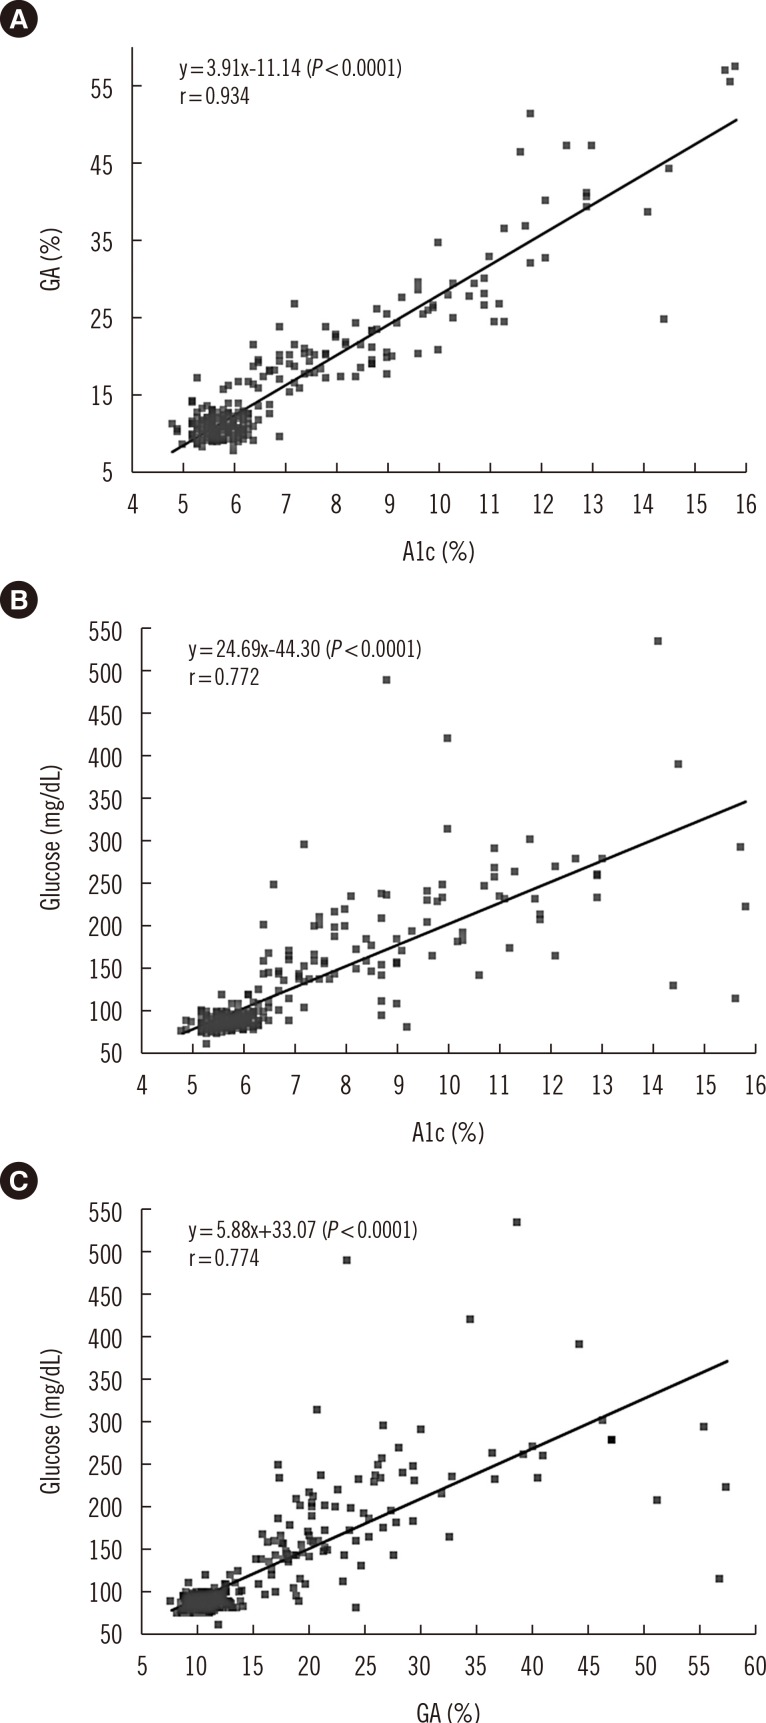
Among the 265 subjects of groups 1 and 2, the correlation coefficients between GA vs. A1c, glucose vs. A1c, and glucose vs. GA were 0.934, 0.772, and 0.774, respectively (P<0.0001). The correlation coefficient between GA vs. A1c was significantly higher than those between glucose vs. A1c and glucose vs. GA. Linear regression curves are shown in Fig. 1. Correlations by linear regression analysis were GA=3.91×A1c-11.14 (P<0.0001), glucose=24.69×A1c-44.30 (P<0.0001), and glucose=5.88×GA+33.07 (P<0.0001). When the constant of the regression line was adjusted as zero, GA could be roughly estimated by multiplying A1c by 2.48 (95% confidence interval [CI] 2.397-2.552, P<0.0001). In addition, glucose could be roughly estimated by multiplying A1c by 18.98 (95% CI 18.20-19.75, P<0.0001) and by multiplying GA by 7.40 (95% CI 7.09-7.708, P<0.0001).
2. Diagnostic utility of GA compared with that of A1c
ROC curve analysis using data from the 265 subjects included in groups 1 and 2 for DM diagnosis showed that the areas under the curve (AUC) for both GA (0.988, 95% CI 0.972-1.004) and A1c (1.000, 95% CI 0.999-1.000) were excellent. The cut-off level of GA was 15.6% (sensitivity 0.951 and specificity 0.975). The cut-off level of A1c was 6.3%, (sensitivity 1.0 and specificity 0.982) (Fig. 2).
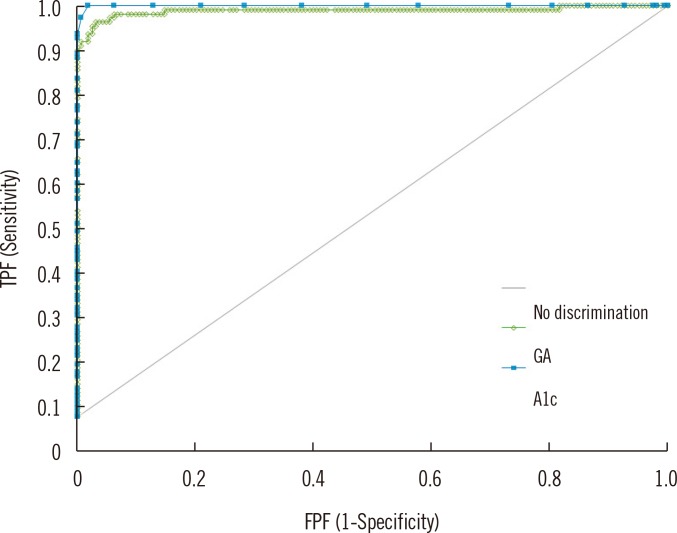 | Fig. 2ROC curve analysis of the potential of glycated albumin (GA) and glycated hemoglobin (A1c) for the diagnosis of diabetes mellitus (DM). (n=265; 163 normal subjects and 102 patients newly diagnosed with type 2 DM) The areas under the curve for GA and A1c are 0.988 and 1.000, respectively.Abbreviations: TPF, true positive fraction; FPF, false positive fraction.
|
3. Association between glycemic indices and serum lipid profiles
The demographic characteristics, glycemic indices, and serum lipid profiles of the patients in the three groups are described in Table 1. Compared with patients in group 1, patients in groups 2 and 3 were significantly older and serum glucose, GA, A1c, GA/A1c ratio, and TG levels were higher, while HDL levels were significantly lower. TC and LDL levels were not significantly different between groups 1 and 2 (P=0.2157 and P=0.7318, respectively), while significantly low in group 3. No difference was observed in HDL levels between groups 2 and 3 (P=0.8685).
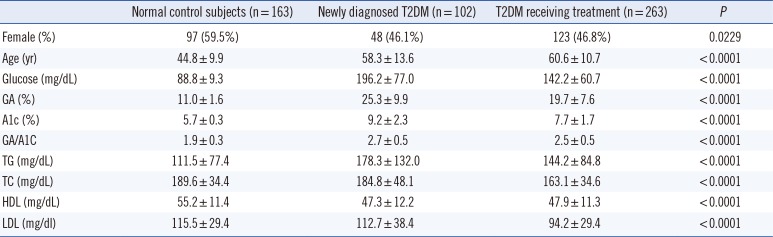
Table 1
Demographic and biochemical characteristics of subjects in each group (n=528)
![]()
For the correlation analysis, each group was separately evaluated (Table 2). In group 1, all parameters showed low correlations with A1c, while GA had low inverse correlations with TG/HDL and TC/HDL. However, in group 2, no correlation was observed between glycemic indices and lipid parameters. In group 3, a low correlation was detected between A1c and LDL levels.
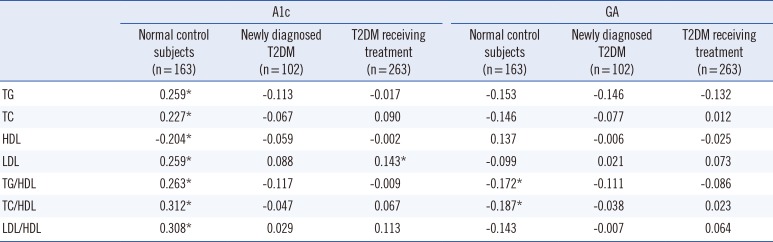
Table 2
Correlation coefficients (r) of A1c and GA in each group with lipid parameters (n=528)
![]()
The mean values of lipids and the incidence of dyslipidemia in group 3 are illustrated in Table 3. HDL levels were significantly reduced in patients with A1c ≥7.0% (P=0.0124) and GA ≥17.0% (P=0.0141). LDL levels tended to be higher in the poorly-controlled groups without statistical significance (P=0.0868 and P=0.1522). TG and TC levels were not different between the two groups. According to the Adult Treatment Panel III guidelines [4], we further investigated the incidence of dyslipidemia: TG ≥200 mg/dL, TC ≥150 mg/dL, HDL<40 mg/dL, and LDL ≥100 mg/dL, in group 3. The incidence of hypertriglyceridemia was significantly higher in the low GA group than in the high GA group. The incidence of dyslipidemia with low HDL levels in the well- and poorly-controlled groups was 13.6% vs. 26.3% (P=0.0196) when patients were categorized on the basis of Alc levels and 15.4% vs. 27.4% (P=0.0195) when patients were categorized on the basis of GA levels.
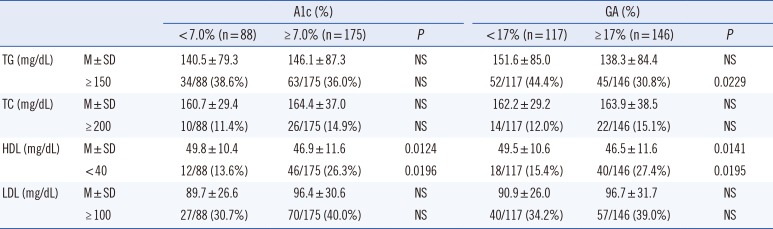
Table 3
Lipid profiles according to A1c and GA levels in the patients with T2DM receiving treatment* (n=263)
*Patients with T2DM receiving treatment were categorized into two groups, A1c <7.0% and ≥7.0% based on the glycemic control target value; GA <17.0% and ≥17% derived from our simple equation; GA=2.48×A1c.
Abbreviations: A1c, glycated hemoglobin; DM, diabetes mellitus; TG, triglyceride; M, mean; NS, no significant; TC, total cholesterol.
![]()
Go to :
DISCUSSION
GA is an intermediate glycemic index. It reflects the glycemic variability over a short time [2] due to its short life span. GA is reported to correlate better with the severity of CVD than A1c and indicates glycemic fluctuations better [18]. GA and A1c show similar association with diabetic retinopathy and nephropathy in patients with type 1 DM [19]. To reduce diabetic complications, early diagnosis and treatment are essential for managing diabetic patients. GA presents an advantage in terms of measurement as it can be determined from serum samples together with glucose measurement, obviating the need for EDTA tube sampling for A1c. Because of its relatively short half-life, GA can provide a more sensitive and early detection of the glycemic status in diabetic patients.
In our study, serum glucose levels, GA, and A1c were positively correlated in all three combinations, and a very high positive correlation was observed between A1c and GA (r=0.934, P<0.0001). This result is consistent with a previous study [20]. GA has a none times more rapid reaction time with glucose than A1c [21]; hence, it changes more quickly according to blood glucose levels. However, A1c is most closely correlated with the 4-week-mean blood glucose level. These findings can partially explain the very high correlation between GA and A1c. Furthermore, the strong correlation between A1c and GA in our study may be due to a population difference and/or strict population selection criteria.
The linear regression analysis indicated that serum GA level could be roughly estimated by multiplying A1c by 2.48. The GA/A1c ratio in group 1 was considerably different (1.91) than that in group 2 (2.8). Serum glucose levels could also be predicted by multiplying A1c and GA by 18.98 and 7.40, respectively. GA provides an alternative glycemic marker when A1c shows abnormal values in various conditions affecting the lifespan of red blood cells (RBCs) such as anemia, hemodialysis, hepatic cirrhosis, and hemoglobinopathy [22]. However, GA can also be altered in disorders disturbing albumin metabolism such as thyroid disorder, nephritic syndrome, and chronic liver diseases [23]. These simple calculations could be useful to clinicians for the interpretation of discrepant results among glycemic indices.
The clinical utility of GA is not only restricted to short-term monitoring of glycemic control, but can also be extended to DM diagnosis [20]. There are several reports on the application of GA as a screening tool for DM. Furusyo et al. [20] suggested a cut-off value of GA for DM diagnosis as 15.5%, where 83.3% of sensitivity and 83.3% of specificity could be expected. Ma et al. [24] determined that, using the following criteria, FPG ≥110 mg/dL and GA ≥17.1%, could result in relatively high positive predictive values (84.79%, 95% CI 81.62-87.60%) in DM screening and expected over a 76% decrease of additional oral glucose tolerance test for DM diagnosis. Although GA test is not a standardized tool for DM diagnosis, GA has advantages over the FPG test, including the fact that it is less influenced by diet and may allow for the detection of DM patients undetectable with FPG measurement as A1c.
In this study, A1c and GA presented comparable diagnostic utilities for DM screening (AUC 1.0 vs. 0.988). The cut-off value of GA was 15.6% with a sensitivity of 95.1% and specificity of 97.5%. Based on our equation of GA=2.48×A1c, the diagnostic cut-off value of 6.5% A1c can be converted into 16.1% GA. Applying the cut-off value of 6.3% and 15.6% for A1c and GA, respectively, for DM diagnosis, 10 cases showed higher than 6.3% A1c and five cases had high GA levels (>15.6%) in the normal group, and five cases had low GA (<15.6%) in the DM group. Particularly, the higher incidence rate of discrepant results for the diagnosis of DM in the normal group may be caused by the non-inclusion of the GA parameter to current standard DM diagnostic criteria. Although the AUC of A1c was higher than that of GA, this result should be interpreted carefully, because A1c is included in the diagnostic criteria of DM, while GA is not.
CVD is the main cause of high morbidity and mortality in diabetic patients [3] and causes high medical expenses. Lipid profiles of patients with T2DM indicated high TG, small dense LDL, and low HDL levels in one study [25], which are artherogenic factors. In another study, A1c was directly correlated with TC, TG, and LDL levels, and an inverse correlation was observed with HDL levels in patients with T2DM [26], while A1c was positively associated with LDL levels, TC/HDL ratio, and LDL/HDL ratio in patients with T2DM in another study [27]. In this study, we confirmed that TG and HDL levels were higher and lower, respectively, in patients newly diagnosed with T2DM than in the normal control group. No difference was observed in LDL levels between the two groups.
According to the Action to Control Cardiovascular Risk in Diabetes (ACCORD-Lipid) trial, combination therapy of fenofibrate with statin failed to reduce the risk of fatal cardiovascular events, nonfatal myocardial infarction, or nonfatal stroke [28]. Intensive glycemic control treatment with behavior modifications and pharmacologic therapy for hypertension and dyslipidemia resulted in a significantly lower risk of CVD (hazard ratio, 0.47; 95% CI, 0.24-0.73) [29]. Since this is a cross-sectional, case-control study, we could not assess the cardiovascular outcomes based on the correlation between GA or A1c and lipid profiles. In this study, the correlation between A1c and lipid parameters was better than that between GA and lipid levels in the normal group. Because the association of lipid profiles with glycemic indices was analyzed in separate groups, HDL levels showed no significant correlation in groups 2 and 3. Patients in groups 2 and 3 presented significantly lower HDL levels than patients in group 1. When analyzed by dichotomous categorization of the patients in group 3, lower HDL levels were detected in the A1c ≥7.0% and GA ≥17% groups. Patients in group 3 presented lower TG, TC, and LDL levels than patients in group 2. Patients in group 3 were under lipid control treatment either taking lipid lowering agents or not. As observed in Table 3, the poorly-controlled group presented a trend of slightly higher TG, TC, and LDL levels, but no significant difference was detected. The lowest rate of CVD hospitalization was noted for patients whose A1c, hypertension, and LDL levels were controlled and in patients whose hypertension and LDL levels were controlled, while the highest rate was detected in patients for whom these three risk factors were not controlled and in patients for whom A1c was controlled [30].
In conclusion, GA shows high sensitivity and specificity for the diagnosis of DM and is a promising diagnostic tool for DM. In addition, GA is less relevant to dyslipidemia than A1c.
Go to :
 XML Download