

 PDF
PDF ePub
ePub Citation
 Print
Print


INTRODUCTION
METHODS
1. Donor basophils
2. Negative and positive control sera
1) Negative control sera
2) Positive control sera
3) Stimulation control reagent
3. Indirect flow BAT
1) Basophil activation and fluorescent staining
2) Flow cytometry
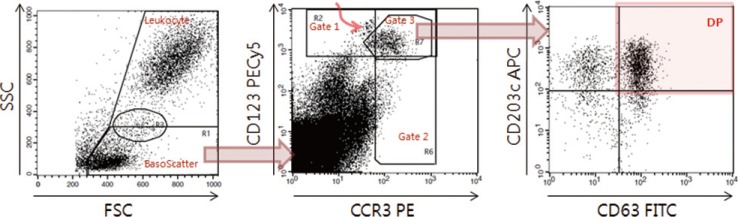 | Fig. 1Data acquisition and analysis of indirect flow BAT for autoimmune urticaria diagnosis. On the FSC/SSC plot (left), the basophil scatter gate (BasoScatter) and leukocyte gate are defined to calculate the basophil percentage among total leukocytes. On the CCR3/CD123 plot (middle), three basophil gates, gates 1, 2, and 3, are defined. The upper left subset, indicated by a curved red arrow within gate 1 and just outside gate 3, appears to be monocyte doublets, an assumption based on their back-gated location on the FSC/SSC plot. On the CD63/CD203c plot (right), a quadrant is set to obtain the expression percentage of CD203c (two upper quadrants), DP (red-shaded quadrant, CD203c+CD63+), or CD63 (two right quadrants).Abbreviations: FITC, fluorescein isothiocyanate; PE, phycoerythrin; PECy5, PE-cyanine 5; APC, allophycocyanine; FSC, forward scatter; SSC, side scatter; DP, double positivity; CCR3, eotaxin CC chemokine receptor-3.
|
4. Statistical analysis
RESULTS
1. Test sample volume
2. Definition of the cutoff value in negative control sera
Table 1
Definition of the cutoff values* for basophil activation markers according to four basophil preparation methods and three basophil gating strategies
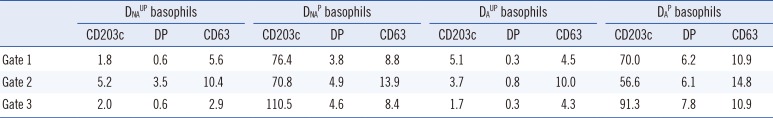
Data are presented as percentages.
*The cutoff value for an activation marker was defined as the average of its expression percentages+(3×SD) in negative control sera (n=20), which were measured on the CD63/CD203c plot of gated basophils (Fig. 1, right plot).
Abbreviations: DNAUP, non-atopic donor unprimed; DNAP, non-atopic donor primed; DAUP, atopic donor unprimed; DAP, atopic donor primed basophils; DP, double positive (CD63+CD203c+).
![]()
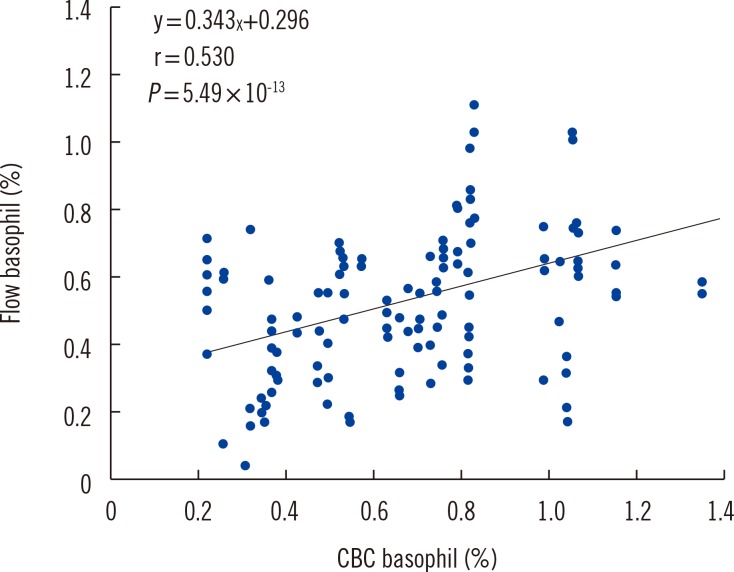
3. Correlation of basophil percentage between flow cytometry and CBC
4. Assay sensitivity for each variation in positive control sera
Table 2
Comparison of assay sensitivity (%) among basophil activation markers according to four basophil preparation methods and three basophil gating strategies in positive control sera (n=21-24)*
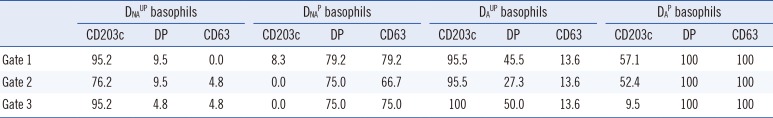
Data are presented as percentages.
*See Table 1 for the cutoff values of each marker, which were used to discriminate the expression percentages as positive or negative. The assay specificity using such a cutoff value can be regarded as 99%.
Abbreviations: DNAUP, non-atopic donor unprimed; DNAP, non-atopic donor primed; DAUP, atopic donor unprimed; DAP, atopic donor primed; DP, double positive (CD63+CD203c+).
![]()
1) Comparison of basophil gating strategies
2) Comparison of basophil activation markers according to the basophil preparation method
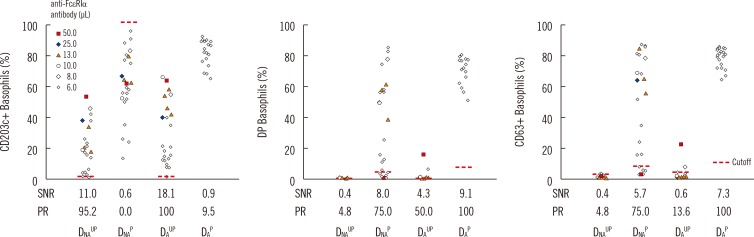 | Fig. 3Comparison of basophil activation markers according to basophil variables. Indirect flow BAT was performed in positive control sera. The expression percentage for each activation marker (CD203c, DP, and CD63) is plotted according to the four basophil preparation methods (DNAUP, DNAP, DAUP, and DAP). To prepare artificial positive control serum, negative control serum was spiked with reconstituted monoclonal anti-FcεRIα antibody. The spiking volume (µL) per 100 µL of negative control serum is indicated by colored markings (see legend). All four types of basophils were tested in parallel by changing the volume of the monoclonal anti-FcεRIα antibody in series of batches. DAP basophils, however, were tested only with the minimum volume of 6 µL. Nevertheless, DAP basophils displayed the highest SNR and positivity rate (PR, assay sensitivity). Expression percentages of each activation marker were measured by using basophil gate 3.Abbreviations: FcεRIα, α-chain of IgE receptor; DP, double positive (CD63+CD203c+); SNR, signal to noise ratio; PR, positivity rate, DNAUP, non-atopic donor unprimed; DNAP, non-atopic donor primed; DAUP, atopic donor unprimed; DAP, atopic donor primed.
|
 XML Download