

 PDF
PDF ePub
ePub Citation
 Print
Print


INTRODUCTION
Breast cancer is the most common malignant disease among women. In 2014 in the United States alone, 232,670 women were diagnosed as having this type of cancer, and 40,000 of them died [1]. Breast tumors can appear at any age but the incidence increases drastically after the age of 50, in connection with hormonal changes [2].
The most effective way to prevent mortality caused by breast cancer is early diagnosis. Biochemical detection of this cancer is based on the determination of markers such as CA 15-3, CEA, and CA 27.29 [3]. However, these are still neither fully specific nor sensitive; hence the researchers attempt to find the biomarkers whose levels would correlate with the presence and stage of breast cancer. We assumed that these factors might include matrix metalloproteinase (MMP), tissue inhibitors of matrix metalloproteinase (TIMPs), and cytokines, for example macrophage colony-stimulating factor (M-CSF). The diagnostic role of the analyzed parameters will involve determination of breast tumor stage based on the following relationship: the more advanced tumor stage, the higher the concentration of these substances.
MMPs form a large group of enzymes responsible for the remodeling of the extracellular matrix (ECM) in tumor invasion [4]. One of them – MMP-9 – also known as a gelatinase B, plays an important role in cancer growth and invasion with its unique ability to destroy collagen type IV and other ECM components. Furthermore, overexpression of this factor correlates with poor prognosis and patient survival [5].
TIMPs are natural inhibitors of MMPs. Only four proteins are included in this group [6]. TIMP-1 can be detected in a variety of body fluids and tissues. This factor stimulates cancer invasion by apoptosis inhibition, promotion of tumor cell growth, and regulation of angiogenesis [7]. The relationship between high levels of TIMP-1 and poor prognosis of breast tumor patients had been confirmed [8].
Previous studies revealed an autologous synthesis of M-CSF in various human cancer cell lines in vitro and by tumors in vivo. This glycoprotein, which belongs to the group of hematopoietic growth factors (HGFs), is responsible for monocyte production and function; yet in pathological conditions, it stimulates cancer cell growth [9].
The aim of this study was to evaluate the plasma levels of MMP-9, TIMP-1, M-CSF, and CA 15-3 (comparative marker) in breast tumor patients in respect to two control groups: benign breast cancer patients and healthy subjects.The data obtained in this work may be helpful in both the determination of the usefulness of the analyzed parameters (separately and together) in diagnosis of breast cancer and the differentiation of its subtypes.
Go to : 
METHODS
1. Patients
Table 1 shows the tested groups. The study included 110 breast cancer patients whose conditions were diagnosed by the Oncology Group and treated in the Department of Oncology, Medical University, Białystok, Poland, between 2013 and 2015. Tumor classification and staging were carried out in accordance with the International Union Against Cancer Tumor-Node-Metastasis (UICC-TNM) classifications [10]. The breast cancer histopathology was established in all cases by tissue biopsy of mammary tumor or based on tumor cancer tissues collected during surgery (all patients with adenocarcinoma ductale). Pretreatment staging procedures included physical and blood examinations, mammography, mammary ultrasound scanning, breast core biopsies, and chest X-ray. In addition, radioisotopic bone scans, examination of bone marrow aspirates, and brain or chest computerized tomography (CT) scans were performed when necessary. None of the patients had received chemo- or radiotherapy before blood sample collection.
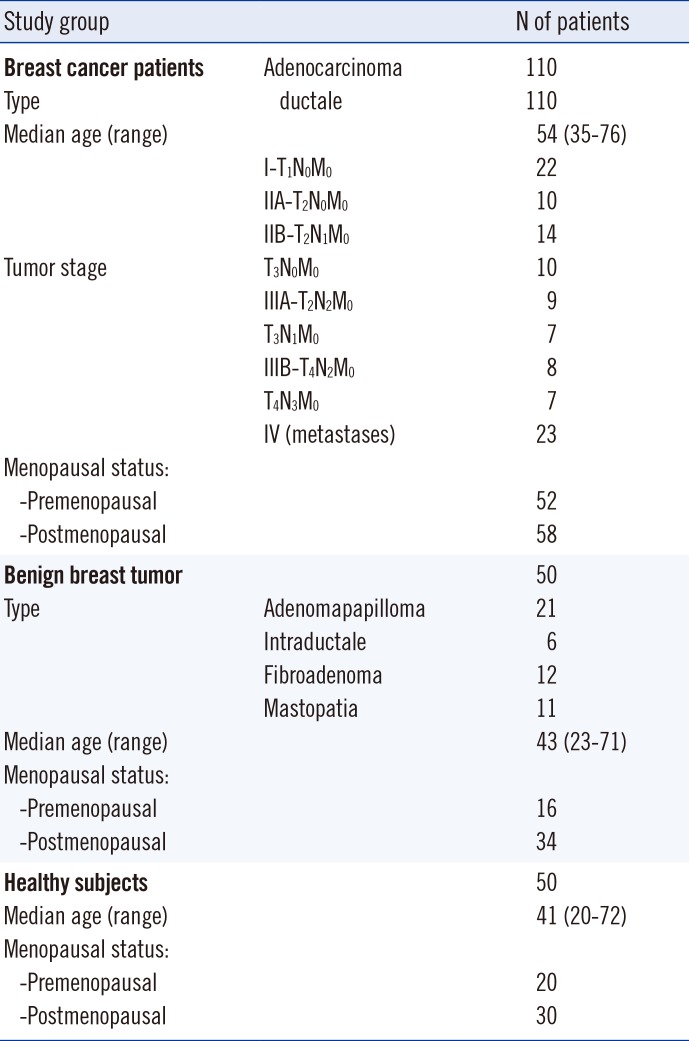
Table 1
Characteristics of breast cancer patients and control groups: benign breast tumor patients and healthy subjects
![]()
The control groups included 50 patients with benign breast tumors and 50 healthy untreated women who had undergone mammary gland examination performed by a gynecologist prior to blood collection. Moreover, mammary ultrasound scanning was performed when necessary. The benign breast tumor histopathology was established in all cases with the use of tissue biopsy of mammary tumor or after surgery.
The study was approved by the local Ethics Committee in Medical University in Białystok no R-I-002/239/2014/. All the patients gave their informed written consent for the examination.
2. Biochemical analyses
Venous blood samples were collected from each patient into a heparin sodium tube, centrifuged for 15 min at 1,000g to obtain plasma samples, and stored at -85℃ until assayed. The tested cytokines (MMP-9, TIMP-1, and M-CSF) were measured by using ELISA (Quantikine Human HGFs Immunoassay, R&D systems, Minneapolis, MN, USA), according to the manufacturer's protocols. Duplicate samples were assessed for each patient.
The intra-assay CV of MMP-9 is reported to be 1.9% at a mean concentration of 2.04 ng/mL, SD=0.039; TIMP-1-3.9% at a mean concentration of 1.27 ng/mL while SD=0.05; M-CSF-3.4% at mean concentration of 227 pg/mL, SD=7.7.
The inter-assay CV of MMP-9 amounted to 7.8% at a mean concentration of 2.35 ng/mL, SD=0.184; TIMP-1-3.9% at a mean concentration of 1.28 ng/mL while SD=0.05; and M-CSF-3.1% at mean concentration of 232 pg/mL, SD=7.3. The assay showed no significant cross-reactivity or interference with numerous human cytokines and other growth factors.
The plasma concentrations of CA 15-3 were measured with chemiluminescent microparticle immunoassay (CMIA) (Abbott, Abbott Park, IL, USA). The intra-assay CV for CA 15-3 is reported to be 2.2% at mean concentration of 27.0 U/mL, SD=0.6 while the inter-assay CV for CA 15-3 is reported to be 2.6% at mean concentration of 27.0 U/mL, SD=0.7.
The value of intra- and and inter- assay CVs were calculated by the manufacturers and enclosed in the reagent kits.
3. Statistical analysis
Statistical analysis was performed by using STATISTICA 8.0 Pl (StatSoft, Tulsa, OK, USA). A preliminary statistical analysis (Chi-square test) revealed that the cytokine and tumor marker levels did not follow normal distribution. Consequently, the Mann-Whitney U test was used for statistical analysis between cancer patients and control groups. Additionally, statistical analysis between the groups with different stages of breast cancerwas performed by using the Kruskal-Wallis test and a multivariate analysis of various data by the post-hoc Dwass-Steele-Crichlow-Flinger test. The data were presented as a median and a range [11].
Diagnostic sensitivity, specificity, and the predictive values of positive and negative test results (PPV, NPV) were calculated by using the following cut-off value: 95th percentile from the control group (calculated from healthy blood donors). This value for each of the substances was as follows: MMP-9-382.00 ng/mL; TIMP-1-119.22 ng/mL; M-CSF-396.94 pg/mL; and CA 15-3-20.85 U/mL. The construction of the ROC curves was performed using GraphRoc program for Windows (Windows,Royal, AR, USA) and the areas under the ROC curve (AUC) were calculated.
In the analyses of both diagnostic performance (sensitivity, specificity, PPV, and NPV) and ROC curve, only healthy subjects were used as a control group.
Go to :
RESULTS
Table 2 presents the median and the range of plasma levels of the investigated parameters and CA 15-3 in tested groups. The median values for MMP-9 (286.00 ng/mL) and M-CSF (437.05 pg/mL), similar to those of commonly accepted tumor marker CA 15-3 (26.90 U/mL) in all breast cancer patients (stages I-IV) were significantly higher compared with the values in healthy subjects (181.00 ng/mL; 281.20 pg/mL; 15.20 U/mL, respectively) (P<0.001). Furthermore, the median level of TIMP-1 in BC total group (155.74 ng/mL) was significantly higher than that in the benign breast tumor group (74.75 ng/mL). We also noticed significantly higher concentrations of M-CSF and CA 15-3 at stage III or IV of cancer compared with stage I or II (M-CSF: I vs. III P<0.001, I vs. IV P<0.001 and II vs. III P=0.005, II vs. IV P=0.001; CA 15-3: I vs. III P=0.001, I vs. IV P<0.001 and II vs. III P=0.023, II vs. IV P=0.001). Furthermore, we detected significantly higher plasma levels of TIMP-1 in the comparison of stage III to stage I (P=0.018) and to stage II (P=0.042).
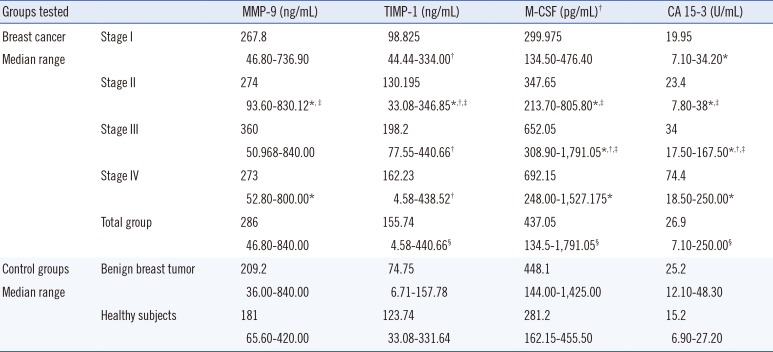
Table 2
Plasma levels of tested parameters and CA 15-3 in patients with breast cancer and in control groups
*Statistically significant when compared breast cancer patients with healthy subjects (P<0.05); †Statistically significant when compared breast cancer patients with benign breast tumor group (P<0.05); ‡Statistically significant when compared breast cancer patients stage III or IV with breast cancer patients stage I or II (P<0.05); §Statistically significant when compared benign breast tumor patients with healthy subjects (P<0.05).
Abbreviations: MMP-9, matrix metalloproteinase-9; TIMP-1, tissue inhibitor of metalloproteinases-1; M-CSF, macrophage colony–stimulating factor.
![]()
Additionally, we observed significantly higher concentrations of CA 15-3 in all the analyzed groups at all stages of breast cancer (with the exception of stage I) in comparison with healthy women (P values were: 0.004 at stage I and below 0.001 at stages II and III).
Moreover, M-CSF, TIMP-1, and CA 15-3 concentrations showed a statistical difference between the two control groups (Table 2).
Table 3 shows the diagnostic criteria: sensitivity, specificity, PPV, and NPV in breast cancer patients. The sensitivity of the tested parameters in the total cancer group was higher for M-CSF (57%) than for MMP-9 (38%) and TIMP-1 (18%), and slightly lower than for CA 15-3 (64%). The combined use of tested factors with CA 15-3 resulted in an increase in sensitivity. A maximum value for the BC total group was obtained for the combination of four studied parameters (84%). Among all tested factors, CA 15-3 showed the highest sensitivity at almost every stage of cancer (with the exception of stage III-equal to M-CSF-and stage IV- the highest value of M-CSF). The sensitivity of the analysis using the tested parameters distinctly rose with the increase in the stage of cancer (with the exception of MMP-9 and TIMP-1 at stage IV), in an identical manner to CA 15-3. The combined use of the analyzed factors and antigen CA 15-3 resulted in an increase in sensitivity at every stage of breast cancer. Higher values were obtained for the combination of MMP-9, TIMP-1, or M-CSF with CA 15-3 (stage III-97%, 87%, 97%, stage IV-87%, 87%, 96%; respectively). A maximum range was observed for the combination of all studied parameters at stageIII and IV of breast cancer (100%).
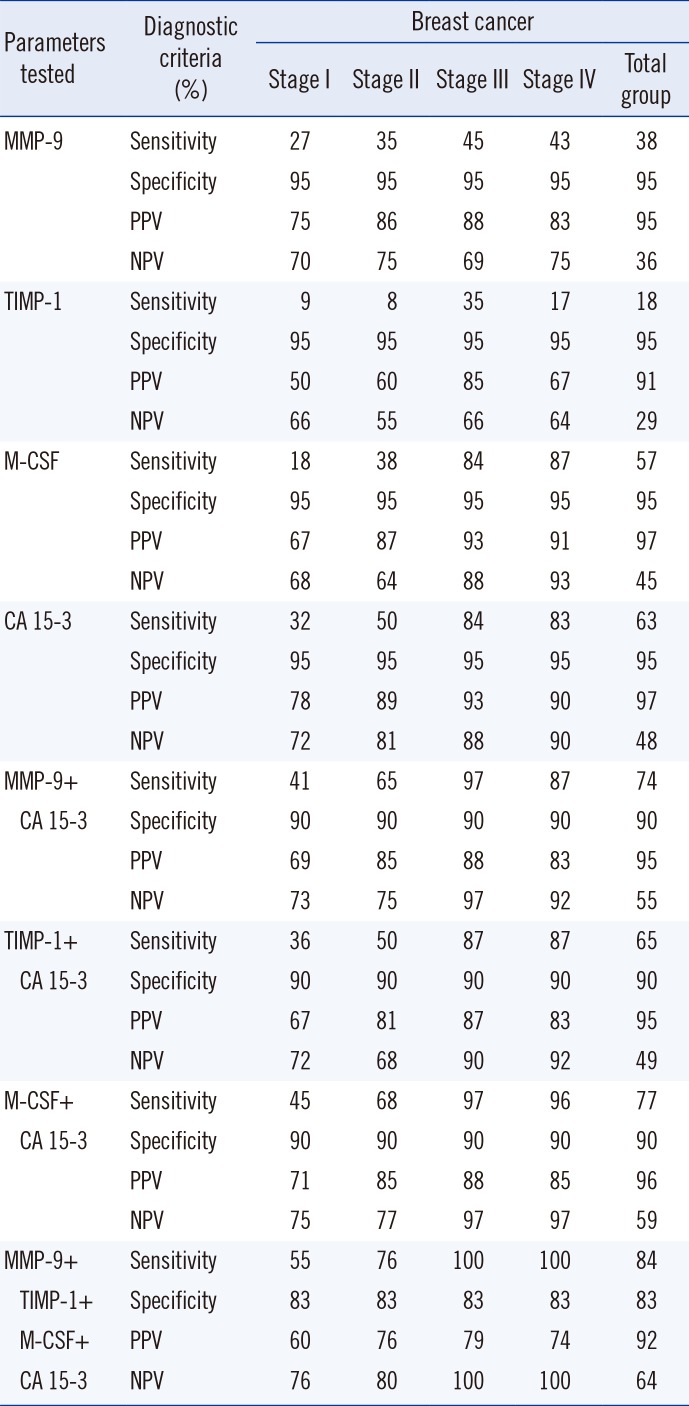
Table 3
Diagnostic criteria of tested parameters and in combined analysis with CA 15-3 in breast cancer patients
![]()
The diagnostic specificity for M-CSF, MMP-9, TIMP-1, and CA 15-3 showed very high values (95% in all cases).
The PPVs in the total group of breast cancer patients was the highest for M-CSF and CA 15-3 (97%) compared with MMP-9 (95%) and TIMP-1 (91%). The combined use of the tested parameters with CA 15-3 resulted in a decrease in the PPV range (Table 3).
The NPVs in the total group of breast cancer was repeatedly higher for CA 15-3 (48%) than for M-CSF (45%), MMP-9 (36%), and TIMP-1 (29%). The combined use of the tested factors and CA 15-3 resulted in an increase in the NPV in all cases, for example with M-CSF-to 59%. A maximum range was obtained for the combination of CA 15-3, M-CSF, MMP-9, and TIMP-1-64%. The combined use of the analyzed parameters and CA 15-3 resulted in an increase in the NPV at every cancer stage. Maximum equal ranges (100%) were obtained for the combination of M-CSF, MMP-9, TIMP-1, and CA 15-3 at stage III and IV of BC (Table 3).
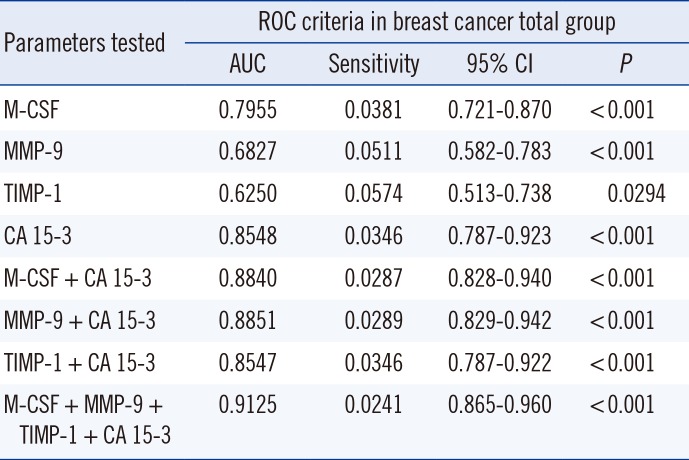
The relationship between the diagnostic sensitivity and specificity is illustrated by the ROC curve. The AUC indicates the clinical usefulness of a tumor marker and its diagnostic power. We noticed that the M-CSF AUC (0.7955) in the total breast cancer group was larger than the area of MMP-9 (0.6827) and TIMP-1 (0.6250) and slightly lower than the AUC of CA 15-3 (0.8548). In case of MMP-9 and M-CSF, the AUC was significantly larger in comparison with AUC=0.5, which is similar to the case of CA 15-3 (borderline of the diagnostic usefulness of the test) (P<0.001; in all cases). The combined analysis of AUC tested parameters with CA 15-3 resulted in an increase in the AUCs (MMP-9-0.8851, TIMP-1-0.8547, and M-CSF-0.8840), but a maximum range in the BC total group was obtained for the combination of all studied parameters (0.9125). Additionally, the AUCs in combined analysis of MMP-9, TIMP-1 or M-CSF with CA 15-3 were significantly larger in comparison with AUC=0.5 (Fig. 1) (Table 4).
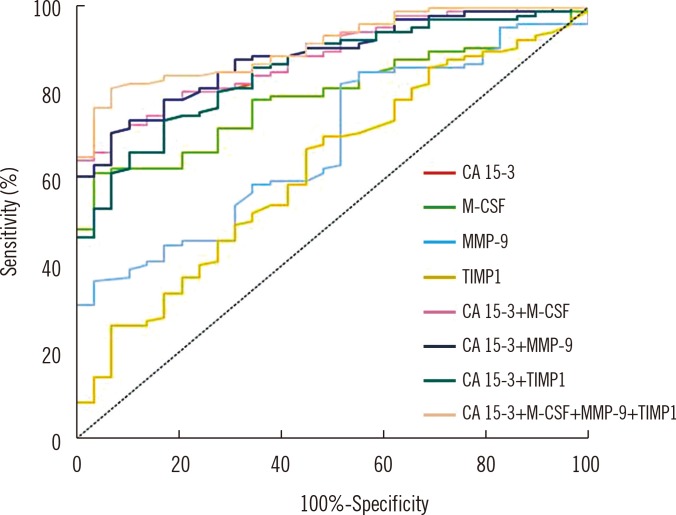 | Fig. 1Diagnostic criteria of ROC curve for tested parameters and in combination with CA 15-3 in total breast cancer group.Abbreviations: MMP-9, matrix metalloproteinase-9; TIMP-1, tissue inhibitor of metalloproteinases-1; M-CSF, macrophage colony-stimulating factor.
|
Table 4
Diagnostic criteria of the ROC curve for tested parameters and CA 15-3
![]()
Go to :
DISCUSSION
The group of HGFs is composed of cytokines such us stem cell factor (SCF), interleukin 3 (IL-3), granulocyte-macrophage-colony-stimulating factor (GM-CSF), granulocyte-colony stimulating factor (G-CSF), and M-CSF. Their main function is regulation of hematopoietic progenitor cell growth and differentiation. Furthermore, HGFs have the ability to stimulate the proliferation of non-hematopoietic cells in vitro, for instance cancer cells [12].
Significant plasma overexpression of M-CSF was detected in patients suffering from many types of tumors, for instance endometrial [13], ovarian [14], or breast tumors [15]. Moreover, scientists who examined this factor demonstrated that M-CSF is a good candidate as a marker of pancreatic tumor [16] or non-small-cell lung cancer [17]. McDermond et al. [18] found that serum levels of this marker were elevated in breast cancer patients but the highest concentrations of M-CSF were detected by Kaciński [19] in the ascites and pleural effusion of the patients in the advanced stages of this cancer. The high grade and poor prognosis correlated with elevated levels of M-CSF [20].
MMPs and TIMPs play a crucial role in ECM and basement membrane homeostasis [21]. Giannelli et al. [22] proved that in physiological conditions, the MMP: TIMP ratio is highly regulated. The imbalance between concentrations and activities of those factors may lead to the disturbances in the production and degradation of ECM components. They also demonstrated that the MMP and TIMP dysfunction might lead to faster invasion and metastasis of the cancer. Moreover, Jinga et al. [23] affirmed that high ratios of MMP-9: TIMP-1 signify strong proteolytic ability of MMPs (especially gelatinases) in malignant tumors. The correlation between the levels of MMP-9 and TIMP-1 and breast tumor sizes was notpreviously confirmed [24].
According to our research, plasma concentrations of MMP-9, M-CSF, and CA 15-3 were significantly higher in the whole breast cancer group than in healthy subjects. The same observations on MMP-9 were reported previously [232425]. The overexpression of M-CSF in similar groups was confirmed by Kaciński [19]. We also found comparable data in our previous studies [2627].
Contrary to the other parameters analyzed in this study, there was no difference between TIMP-1 levels in healthy subjects and breast cancer patients. According to other researchers, the concentrations of TIMP-1 were either significantly lower [28] or significantly higher [29] in carcinomas versus fibroadenomas.
Interestingly, the levels of TIMP-1, M-CSF, and CA 15-3 were significantly higher in total breast cancer patients than in benign breast tumor cases. These observations about M-CSF and CA 15-3 are in accordance with both the data found in our previous studies, in which we analyzed a smaller benign breast cancer group [14] and the study by Wu et al. [24]. Concurrently, Jingla et al. [23] found no statistical differences between TIMP-1 serum levels in benign and malignant cases.
In this work we found that MMP-9, TIMP-1, and M-CSF present high levels at stage III and IV. The highest concentrations of these factors are probably the consequence of a higher mass of cancer cells. This is the further argument for our theory that the analyzed factors can play a prognostic role on the basis of following relationship: the more advanced tumor stage, the higher the concentration of the substance.
In the present study, the diagnostic sensitivity of M-CSF in total breast cancer patient group (57%) was higher than that of MMP-9 (38%) and TIMP-1 (18%) and slightly lower than that of CA 15-3 (63%). In our previous studies on breast cancer, M-CSF showed a higher sensitivity than CA 15-3 [2526]. Concurrently, MMP-9 presented the highest sensitivity at stage I of BC (27%), but still slightly lower than that of CA 15-3 (32%).
Moreover, current findings, similarly to our former works, proved that the combination of the commonly accepted tumor markers and the factors which may be useful in early detection of breast cancer significantly increases the pre-operative diagnostic sensitivity.
In this study, M-CSF had the highest predictive values of all tested factors, similar to that of CA 15-3, at every stage of cancer. The M-CSF diagnostic criteria are the highest for the group with stage IV cancer, which probably resulted from their vital role in the formation of both local and distant metastases [18].
In this study, M-CSF had the highest predictive values of all tested factors, similar to that of CA 15-3, at every stage of cancer. The M-CSF diagnostic criteria are the highest for the group with stage IV cancer, which probably resulted from their vital role in the formation of both local and distant metastases [18].
The ROC curve illustrated by a specificity/sensitivity diagram is a crucial value describing all markers. The best cancer markers are characterized by the largest AUCs. In the present study, the AUC of M-CSF was the largest among the analyzed parameters, yet slightly lower than CA 15-3. Additionally, we detected significantly larger AUCs for M-CSF, MMP-9, TIMP-1, and CA 15-3 compared with AUC=0.5. Our data demonstrated that the diagnostic power of the analyzed parameters, in particular M-CSF in total breast cancer patients group, had a higher value than the diagnostic power of M-CSF in cervical cancer [12].
The examined factors are unsuitable for basic screening when considered separately. Their diagnostic usefulness is high in their combined analysis with a comparison tumor marker (in this case with CA 15-3); yet the greatest diagnostic value is observed when they are considered altogether as a new panel of biomarkers.
In conclusion, the obtained results suggest the usefulness of M-CSF, MMP-9, and TIMP-1 in the diagnostics of breast cancer except in stage I-yet only in combination with CA 15-3. Our findings seem to be ambiguous, although they are a promising step forward. The main limitation of the studywas lack of significant differences in concentrations of analyzed factors between patients with stage I and healthy subjects. Therefore, further investigation will be necessary to clarify the utility of this new biomarker panel in clinical management.
Go to :
 XML Download