

 PDF
PDF ePub
ePub Citation
 Print
Print


INTRODUCTION
Hypertension (HT) is a significant risk factor for cardiovascular and cerebrovascular events including heart attack and stroke [1]. The renovascular system is commonly affected by elevated blood pressure in patients with HT. Proteinuria is among the earliest markers of renal damage and occurs owing to sustained high blood pressure. The effects of high blood pressure on the vital organs may be mediated by activation of the coagulation system via endothelium injury and/or might be due to their effects on platelets. Proteinuria is reportedly associated with endothelial dysfunction, inflammation, and platelet activation [2].
Platelet activation plays a critical role in the pathophysiology of thrombotic events and HT-related target organ damage [3]. Platelets retain their original and inactive form while circulating through vessels with intact endothelium. Because of the endothelial damage due to high blood pressure, platelets adhere to collagen released from the subendothelial tissue. Platelets are activated by increases in platelet adhesion and aggregation. Activated platelets exhibit degranulation, swelling, and increases in mass and volume [4]. In this situation, alterations of platelet indices occur owing to endothelial dysfunction, which also plays a role in the pathophysiology of proteinuria.
Platelet indices such as mean platelet volume (MPV), plateletcrit (PCT), and platelet distribution width (PDW) are easily calculated via routine blood counts. MPV reportedly increases in HT and its associated complications as well as in diabetes mellitus, hyperlipidemia, and coronary artery disease [567]. There is an inverse relationship between MPV and cardiovascular outcome [8]. PCT was recently accepted as an indicator of platelet activation, and it reportedly increases in cardiovascular diseases [910]. PCT is calculated by using the following formula: PCT=platelet count×MPV/107 [9]. PDW—another indicator of platelet activation—is thought to be associated with inflammation and atherosclerosis. Although its significance in HT-related proteinuria is unknown, PDW levels increase in acute coronary syndrome [11], Alzheimer's disease [12], and rheumatological diseases [13].
To the best of our knowledge, the literature does not include any studies on the relationship between the platelet indices PCT, MPV, and PDW, and proteinuria due to HT. As such, the present study aimed to determine the relationship between PCT, MPV, and PDW, and proteinuria associated with HT, as well as the relative power of each of the indices to predict proteinuria.
Go to : 
METHODS
This retrospective study was performed at Ankara Numune Education and Research Hospital, Nephrology Department, Ankara, Turkey, in accordance with the Declaration of Helsinki. The study protocol was approved by the Ankara Numune Education and Research Hospital Ethics Committee. The study included consecutive patients who were followed up with a diagnosis of isolated primary HT at the Nephrology and Internal Medicine Clinics between March 1 and June 30, 2013. All participants provided informed consent. All patient data, including complete blood count, routine biochemical parameters, 24-hr urine protein, and demographics, were obtained from the medical records. Duration of HT (years) was determined on the basis of patient self-reports of the time of diagnosis. Patients with secondary HT, diabetes mellitus, coronary artery disease, cerebrovascular disease, acute-chronic infection, collagen tissue disease, malignancy, hematologic disease, thrombocytopenia (platelet count <150×109/L), and thrombocytosis (platelet count >450×109/L) as well as those using aspirin, non-steroidal anti-inflammatory drugs, immunosuppressive drugs, or anticoagulant drugs were excluded.
The 24-hr protein and microalbumin levels were measured by a turbidimetric assay; creatinine levels were measured by a colorimetric enzyme assay in a Hitachi Moduler P800 analyzer (Roche Diagnostics Corp., Indianapolis, IN, USA). The erythrocyte and platelet count, leukocyte count, and other blood cell parameters were measured using the impedance (resistance) method on a Sysmex XE-2100 optic laser scatter hematology analyzer (Roche Diagnostics Corp.), while hemoglobin was quantified photometrically. The glomerular filtration rate (GFR) was calculated according to the simplified version of the Modification of Diet in Renal Disease Study prediction equation formula [14]: GFR=186×creatinine-1.154×age-0.203×1.212 (if African-American)×0.742 (if female). Proteinuria was defined as a 24-hr urine protein excretion ≥150 mg [15].
The study included 223 patients (68 men and 155 women) with a mean age of 52.0±11.7 (median 53 [range, 18-84]) yr. The patients were divided into two groups according to proteinuria status based on 24-hr urine protein excretion: proteinuria (+) group (15 men and 40 women; mean age, 53.3±11.1 (median, 53 [range, 21-84] yr) and proteinuria (-) group (53 men and 115 women; mean age: 51.3±11.9 [median, 52 (range, 18-81)] yr). There were no significant differences in demographic characteristics between the two groups (Table 1). The mean body mass index of the study population was 29.3±4.5 kg/m2, mean systolic blood pressure was 123.9±34.1 mm Hg, mean diastolic blood pressure was 77.4±9.4 mm Hg, median duration of HT was 3 yr, and smoking rate was 30%. In all, 25.5% of the patients were using angiotensin-converting enzyme and angiotensin receptor blocking agents, 13% were using beta-blockers, 39.9% were using calcium channel blockers, and 30.9% were using diuretics.

Table 1
Patient demographic characteristics
![]()
The statistical analysis was performed by using SPSS v.20.0 for Windows (IBM Corp., Armonk, NY, USA). The Kolmogorov-Smirnov test was used to determine the normality of the data distribution. Normally distributed numeric parameters are presented as mean±SD, while non-normally distributed parameters are shown as medians. Categorical variables are expressed as number and percentage. The chi-square test and Fisher exact test were used to compare categorical variables. Inter-group differences in normally distributed numeric parameters were analyzed by using the t-test for independent samples, while inter-group differences in non-normally numeric parameters were analyzed by the Mann-Whitney U test. Independent predictors of proteinuria were identified by using stepwise logistic regression. A receiver operating characteristic curve was analyzed to determine the predictive power of the platelet indices for proteinuria. The Youden index was used to determine the prediction point. The level of statistical significance was set at P<0.05.
Go to :
RESULTS
The mean platelet count, PDW, PCT, and MPV were 278.8±49.6×10⁹/L, 13.5%±1.8%, 0.31%±0.07%, and 11.3±2.6 fL, respectively. The mean platelet count, PCT, MPV, and PDW were significantly higher in the proteinuria (+) group than in the proteinuria (-) group (P<0.05); no significant differences were noted in the other blood parameters between the two groups (Table 2).
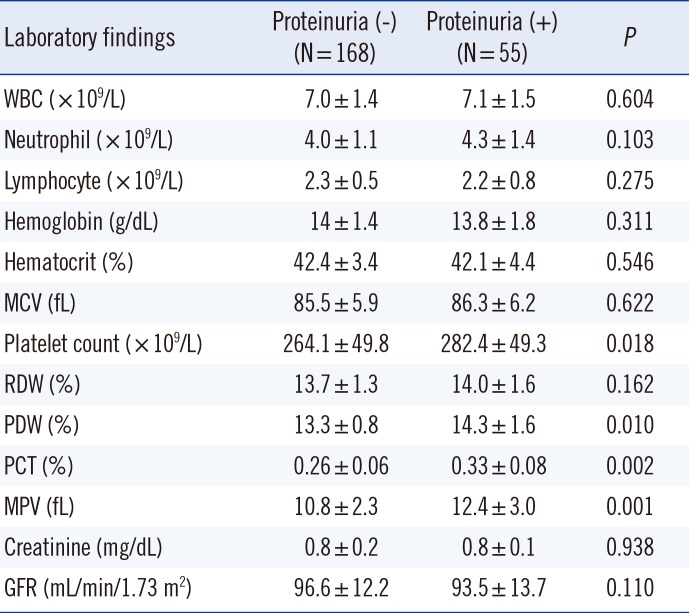
Table 2
Baseline laboratory data
![]()
The platelet count, PCT, MPV, and PDW were independent risk factors predictive of proteinuria according to a stepwise regression analysis of PDW, PCT, and MPV. PCT was the strongest independent predictor of proteinuria (odds ratio [OR], 2.522; P=0.005), followed by MPV (OR, 1.397; P=0.011), and PDW (OR, 1.295; P=0.013) (Table 3). A PCT level >0.3% predicted proteinuria with a sensitivity of 69.1% and a specificity of 62.5% (area under the curve [AUC]±SE, 0.725±0.038; 95% confidence interval [CI], 0.661-0.782; P<0.001) (Fig. 1), an MPV level >11 fL predicted proteinuria with a sensitivity of 59.3% and a specificity of 54.5% (AUC±SE, 0.615±0.068; 95% CI, 0.552-0.682; P=0.011), and a PDW level >13.1% predicted proteinuria with a sensitivity of 62.1% and a specificity of 52.8% (AUC±SE, 0.612±0.042; 95% CI, 0.544-0.677; P=0.007). In addition, the AUC value of PCT was significantly different from those of MPV and PDW variables (AUCPCT vs. MPV=110, P=0.018; AUCPCT vs. PDW=113, P=0.012; AUCMPV vs. PDW=0.003, P=0.991).
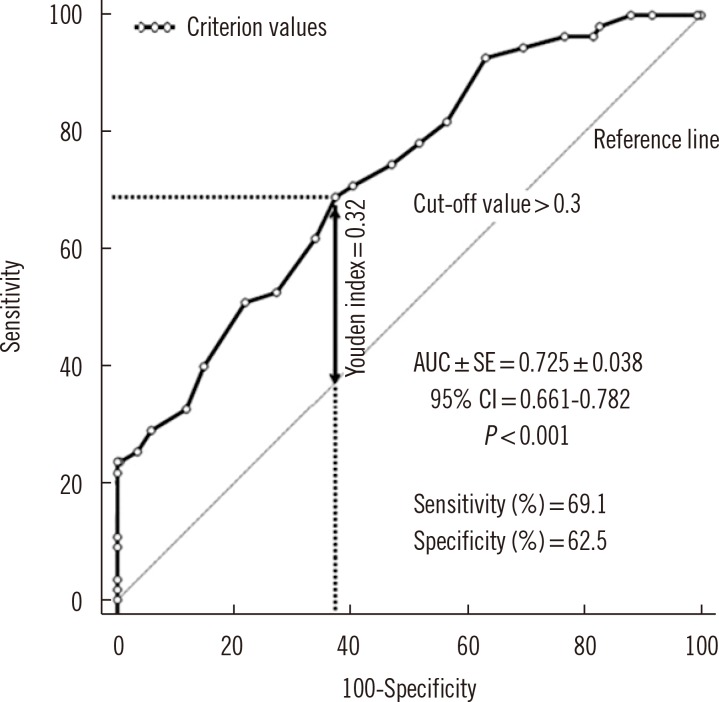 | Fig. 1ROC curve analysis, the determination of the possible cut-off value of plateletcrit level predicting the risk of proteinuria. Cutoff values were determined from the Youden index. Arrow indicates the Youden index.Abbreviations: AUC, area under the curve; CI, confidence interval.
|

The PCT >0.3% and MPV level > 11 fL combination predicted proteinuria with a sensitivity of 43.6% and a specificity of 75% (AUC±SE, 0.593±0.045; 95% CI, 0.504 -0.682; P=0.038), MPV level >11 fL and PDW level > 13.1% combination predicted proteinuria with a sensitivity of 45.5% and a specificity of 66.1% (AUC±SE, 0.558±0.045; 95% CI, 0.469-0.646; P=0.200), PCT >0.3% and PDW level >13.1% combination predicted proteinuria with a sensitivity of 45.5% and a specificity of 79.2% (AUC±SE, 0.623±0.045; 95% CI, 0.534-0.712; P=0.006), PCT >0.3% and MPV level >11 fL and PDW level >13.1% combination predicted proteinuria with a sensitivity of 29.1% and a specificity of 83.3% (AUC±SE, 0.562±0.046; 95% CI, 0.472-0.653; P=0.167).
Go to :
DISCUSSION
In the present study, the platelet indices PCT, PDW, and MPV were significantly higher in patients with proteinuria than in those without it. Among these three indices, PCT was the strongest predictor of proteinuria. The present study is the first to investigate the association between HT-associated proteinuria and these three platelet indices.
High blood pressure causes endothelial damage via shear stress, which results in activation of the coagulation and fibrinolytic pathways [16]. With the activation of the coagulation cascade, the platelets are reactivated, and the increase in platelet activation reduces bleeding time and increases platelet volume [17]; however, when platelet production is induced, MPV increases, as do the platelet count and PDW [7]. Newly produced large platelets are very active metabolically and enzymatically, and their dense granules secrete thromboxane A2 and B2, which increases thrombotic activity [18]. This increase in thrombotic potential reportedly increases HT-associated proteinuria [19] by inducing atherogenesis, inflammation, and atherothrombosis [3]. The cause of platelet activation in patients with HT is not limited to shear stress; rather, it is also associated with the renin-angiotensin system, an increase in catecholamines, and an elevated oxidative stress level [20]. The platelet count, MPV, and PDW levels increase in response to platelet activation of any cause; therefore, increases in the platelet count and PCT level calculated via MPV are expected.
A study that examined the correlation between subclinical target organ damage and MPV in HT patients reported that there was a positive correlation between MPV level and microalbuminuria, carotid intima-media thickness, and left ventricle mass indices [21]. Studies in patients with type 2 diabetes mellitus reported that the MPV level was higher in patients with microalbuminuria than in those without microalbuminuria [22]. Similarly, the MPV level in our study was significantly higher in the proteinuria (+) group than in the proteinuria (-) group. Although PDW was reportedly increased in patients with cardiovascular diseases such as coronary artery disease [11], acute myocardial infarction, and unstable angina [23], no studies have investigated the association between target organ damage and PDW in patients with HT. A few studies have examined the correlation between PCT and cardiovascular disease; they have reported that the PCT levels are higher in patients with coronary artery disease [9], slow coronary flow [10], and mitral stenosis [24]. To the best of our knowledge, no studies have evaluated the association between PCT and HT-associated microvascular complications. Akpinar et al. [10] reported that the platelet count, PCT, MPV, and PDW were higher in patients with slow coronary flow than in those with normal coronary flow; however, among the platelet indices, only PCT was an independent predictor of slow coronary flow on the basis of a multivariate logistic regression analysis of these parameters (platelet count, PCT, MPV, and PDW).
Moreover, in the present study, it was observed that PCT had greater diagnostic power than MPV and PDW for predicting proteinuria, indicating that it is a better predictor of HT-associated target organ damage than other platelet indices.
In the study by Akpinar et al. [10], a PCT >0.2% predicted slow coronary flow with a sensitivity of 62% and specificity of 72% in patients undergoing coronary angiography. In our study, PCT >0.3% predicted HT-related proteinuria with a sensitivity of 69.1% and a specificity of 62.5%. Based on the findings of Akpinar et al. and those of the present study, PCT is a stronger predictor of cardiovascular diseases than other platelet indices. We can explain this as follows: platelet activation is a factor related to cardiovascular diseases [19]. PCT, which shows the amount of platelets circulating in one unit of blood volume [10], can be directly affected by platelet count, MPV, and PDW. Therefore, we believe that PCT, among all the platelet indices, is the strongest predictor of platelet activation and the parameter most closely related to cardiovascular diseases.
The present study has some limitations, including its small patient population with proteinuria, lack of other thrombogenic factors, and no follow-up evaluations to determine the correlation between PCT, MPV, and PDW levels and disease prognosis. We believe that if platelet-activating factor was evaluated along with platelet indices and if a positive correlation was found between platelet indices and platelet-activating factor, this condition would have increased the reliability of the power of the platelet indices to predict proteinuria.
In conclusion, the platelet index is a simple, practical, and inexpensive test that can be calculated by hemogram parameters and is suitable for use in daily practice to predict HT-related proteinuria. However, additional randomized controlled studies with long follow-up durations are needed before platelet indices can routinely be used for diagnosis and treatment.
Go to :
 XML Download