

 PDF
PDF ePub
ePub Citation
 Print
Print


INTRODUCTION
Suppression of tumorigenicity 2 (ST2) is a member of the interleukin (IL)-1 receptor family, and ST2/IL-33 signaling was suggested as a novel mechanism for ventricular remodeling after ischemia and pressure overload [12]. Its soluble isoform, soluble ST2 (sST2), functions as a decoy receptor that limits the benefits of IL-33 and has been introduced as a novel, clinically useful biomarker for remodeling and mortality in both acute and chronic heart failures [34]. As a biomarker of myocardial fibrosis, sST2 is not only predictive of hospitalization and death in patients with heart failure but also adds prognostic value when measured in combination with natriuretic peptide levels [4].
Sepsis is a systemic inflammatory response caused by infections. Its progression to severe sepsis and septic shock is related to high morbidity and mortality in critical care settings [56]. The sepsis-related organ failure assessment (SOFA) scoring system has been used to describe and evaluate organ dysfunctions and failures in these patients [7].
Among the various markers of sepsis, procalcitonin (PCT) is regarded as the most well-established marker to diagnose sepsis, estimate its severity, and provide a prognosis [89]. In addition to being increased in heart disease, sST2 concentrations can be increased in various other diseases, such as inflammatory and autoimmune diseases [10]. A few experimental or clinical studies have reported that sST2 concentrations may be increased in sepsis [11121314], and in one study, sST2 concentrations were found to be correlated with disease severity and mortality in patients with severe sepsis [14].
Given that sST2 could be a marker of both heart disease and inflammatory disease and that sepsis is a critical setting with such comorbidities, further study is needed to elucidate the clinical value of sST2 in septic patients. We wanted to know whether sST2 is associated with the degree of cardiac dysfunction/failure and/or the degree of sepsis severity. We explored whether the concentration of sST2 in serum is related to the concentration of PCT and the cardiovascular subscore of the SOFA score and whether it varies according to the severity or clinical outcome of sepsis. We also questioned whether sST2 has a prognostic role in combination with PCT in patients with suspected sepsis.
Go to : 
METHODS
1. Study population
This study was conducted prospectively in two university hospitals: San't Andrea Hospital (SAH) in Rome and Konkuk University Hospital (KUH) in Seoul, Korea. The study protocol was designed following the criteria of the Declaration of Helsinki and was approved by the Institutional Review Board in both hospitals (SAH and KUH). In KUH, written informed consent from the enrolled patients was exempted, because the biomarkers were measured in residual blood samples that would have been discarded, without additional blood sampling from the patients. In SAH, written informed consent was obtained from all enrolled patients.
During the period from November 2013 to May 2014, a total of 397 patients (97 patients from SAH and 300 patients from KUH) were enrolled from the emergency department or intensive care unit. They were suspected as having systemic infections or sepsis, based on the clinical diagnostic criteria of sepsis (e.g. SIRS) [5]. Their medical records were reviewed to obtain the clinical and laboratory data. Their median age was 70.0 (range, 18-94) yr, and 211 (53.1%) patients were male. The patients were divided into five groups (from 0 [normal] to 4 [most abnormal]) according to the cardiovascular subscore of the SOFA score [7]. Briefly, the cardiovascular subscore was assigned according to subjects' mean arterial pressures and vasopressors treatments. The subjects were categorized into five cardiovascular subscore groups as follows: score 0, normal; score 1, mean arterial pressure <70 mm Hg; score 2, dopamine ≤5 µg/kg/min or dobutamine (any dose); score 3, dopamine >5 µg/kg/min or epinephrine ≤0.1 µg/kg/min or norepinephrine ≤0.1 µg/kg/min; and score 4, dopamine >15 µg/kg/min or epinephrine >0.1 µg/kg/min or norepinephrine >0.1 µg/kg/min. Demographic data of the study population is summarized in Table 1.
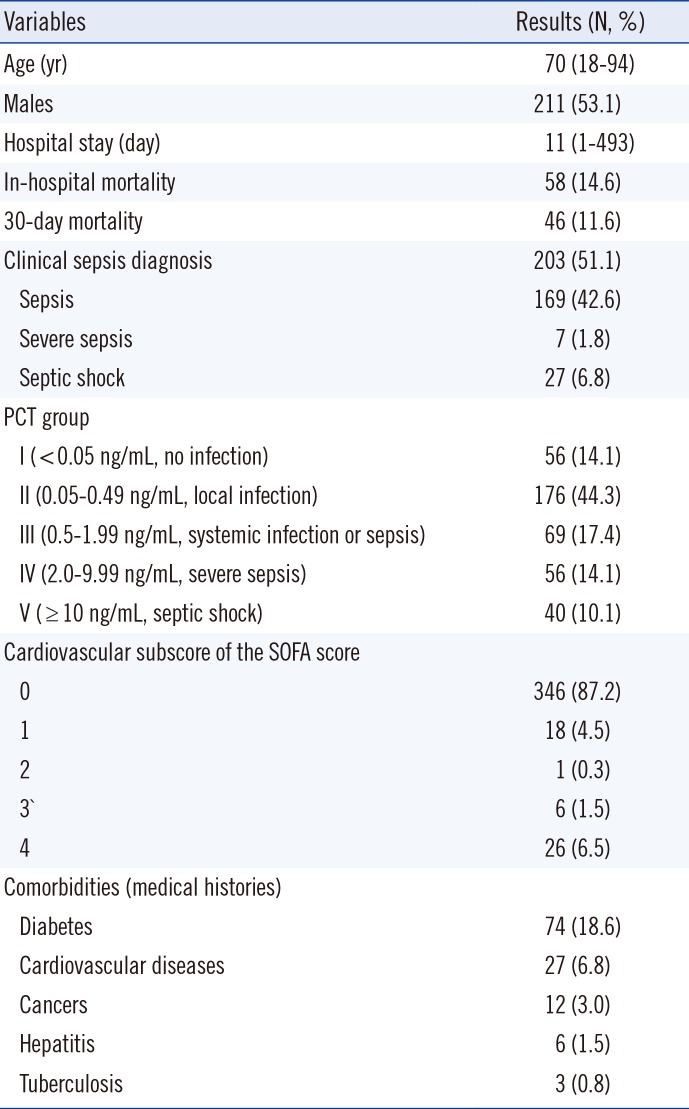
Table 1
Demographic data of the study population (N=397)
![]()
2. Measurement of sST2 and PCT
The serum samples for sST2 and PCT were obtained from blood samples collected when the patients appeared acutely ill with changed vital signs and were suspected of having systemic infection or sepsis [15]. The samples were stored at -70℃ until analysis. sST2 was measured by using the Presage ST2 Assay (Critical Diagnostics, San Diego, CA, USA), according to the manufacturer's instructions [1012]. It is an enzyme-linked immunosorbent assay comprising a ready-to-use 96-well microtiter plate coated with mouse monoclonal anti-human sST2 antibodies. After performing the assay procedure, spectrophotometric absorbance was read at 450 nm with a microtiter well reader; all samples were measured in duplicate, and the average value of the two measurements for each sample was used for statistical analysis. An sST2 concentration of 35 ng/mL was used as a cut-off value, based on the HF-ACTION study and the summary of the Presage ST2 assay provided by the US Food and Drug Administration [1516].
Serum PCT was measured by using the Elecsys BRAHMS PCT electrochemiluminescence assay (BRAHMS, Henningsdorf, Germany) in the Roche Cobas e-System (Roche Diagnostics, Basel, Switzerland) in KUH or the BRAHMS PCT sensitive Kryptor immunofluorescent assay system (BRAHMS) in SAH. According to previous studies and the manufacturers' recommendations, subjects were categorized into five groups depending on their serum PCT concentrations: group I (no infection), <0.05 ng/mL; group II (local infection), 0.05-0.49 ng/mL; group III (systemic infection or sepsis), 0.5-1.99 ng/mL; group IV (severe sepsis), 2.0-9.99 ng/mL; and group V (septic shock), ≥10 ng/mL [1718] (Table 1).
3. Statistical analysis
Data was expressed as the median and interquartile range. Chi-square test was used to compare the proportions of mortality among groups. Mann-Whitney test was used to compare sST2 concentrations between the two groups of sepsis diagnosis based on PCT concentrations (above and below the cut-off of 0.5 ng/mL, respectively) and the two groups categorized according to the cardiovascular subscore of the SOFA score (groups 0-2 vs. groups 3-4). Kruskal-Wallis test was used to compare sST2 concentrations among the five groups categorized by PCT concentration and the five groups categorized by the cardiovascular subscore of the SOFA score. Agreement between the groups categorized by sST2 and PCT concentrations was assessed by using Cohen's Kappa (agreement: <0.4, poor; 0.4-0.75, fair to good; >0.75, excellent). Kaplan-Meier survival curves were used to analyze the prognostic values of sST2 and PCT in predicting in-hospital or 30-day mortality. For the statistical analyses, MedCalc software (version 13.3, MedCalc Software, Mariakerke, Belgium) was used. P values ≤0.05 were considered statistically significant.
Go to :
RESULTS
The distribution of serum concentrations of sST2 was compared among the five groups categorized according to PCT concentration (Fig. 1). When sST2 was compared between the two groups categorized by the presence or absence of sepsis at the cut-off of 0.5 ng/mL of PCT in serum, its distribution was found to differ significantly between the groups with and without sepsis (184.4 [104.1-273.9] ng/mL vs. 51.3 [32.4-95.0] ng/mL, respectively, P<0.0001). A significant difference was also observed among the five groups categorized according to PCT concentration; the median value (interquartile range) of sST2 for each of the groups, from lowest to highest PCT concentration, was 31.5 (22.0-52.1) ng/mL, 59.7 (37.3-105.6) ng/mL, 150.0 (77.3-238.5) ng/mL, 173.2 (121.7-276.8) ng/mL, and 245.8 (167.4-318.7) ng/mL, respectively (P<0.000001).
 | Fig. 1Comparison of serum sST2 concentrations according to serum PCT concentrations. (A) Comparison of sST2 concentrations between the 2 groups of PCT concentration below and above the cut-off of 0.5 ng/mL, respectively. The median values (interquartile range) of the 2 groups were 51.3 (32.4-95.0) ng/mL and 184.4 (104.1-273.9) ng/mL, respectively (P<0.0001, Mann-Whitney test). (B) Comparison of sST2 concentrations among the 5 groups of PCT concentration. The median value (interquartile range) of each group was 31.5 (22.0-52.1) ng/mL, 59.7 (37.3-105.6) ng/mL, 150.0 (77.3-238.5) ng/mL, 173.2 (121.7-276.8) ng/mL, and 245.8 (167.4-318.7) ng/mL (P<0.000001, Kruskal-Wallis test). The central box represents the range between the lower and upper quartiles (25th to 75th percentiles) and the middle line shows the median value.Abbreviations: sST2, soluble suppression of tumorigenicity 2; PCT, procalcitonin.
|
The distribution of serum concentrations of sST2 among the groups categorized according to the cardiovascular subscore of the SOFA score is presented in Table 2. Although the median values of sST2 were significantly different between groups 0 and 4 (81.9 [39.8-182.2] ng/mL vs. 148.6 [95.5-269.2] ng/mL, respectively, P=0.036), there was no apparent close correlation between the concentration of sST2 and the cardiovascular subscore of the SOFA score. However, the concentration of sST2 in groups 3-4 was significantly higher than that in groups 0-2, implying a significant association of sST2 concentration with cardiac dysfunction/failure (83.4 [39.7-188.4] ng/mL vs. 148.6 [73.6-265.1] ng/mL, P=0.0123).
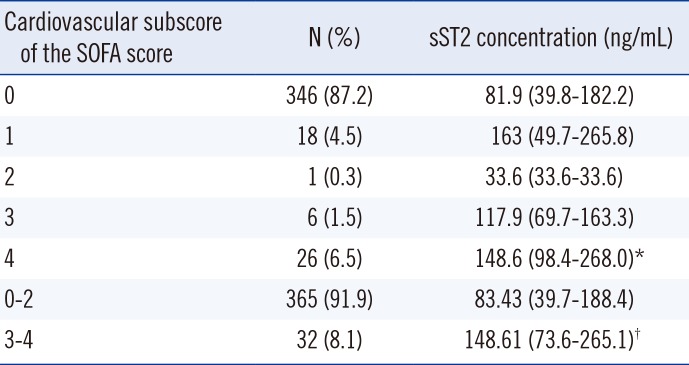
Table 2
Comparison of sST2 concentrations according to the cardiovascular subscore of the SOFA score
![]()
In-hospital mortality was significantly different between the two groups categorized by sST2 concentration (P=0.0213), showing a hazard ratio (HR) of 2.77 (95% confidence interval [CI], 1.47-5.23) (Fig. 2). It was also significantly different between the two groups of PCT concentrations (P=0.0016; HR=2.21 [95% CI, 1.29-3.81]). In the four groups categorized according to sST2 and PCT concentrations, the highest in-hospital mortality was observed when the concentrations of both sST2 and PCT were increased (P=0.0028); the HR (95% CI) of group A vs. D was 3.61 (1.70-7.63), and that of group C vs. D was 2.07 (1.15-3.73). In the patients categorized to group 0 of the cardiovascular subscore of the SOFA score, survival probability was significantly lower when their sST2 concentrations were above 150 ng/mL (P=0.0078, logrank test; HR=2.45 [95% CI, 1.09-5.50]). In the same patients, a significant difference was also observed in 30-day mortality between the groups assigned according to sST2 concentration (P=0.0220, logrank test; HR=2.66 [95% CI, 1.02-7.11]). Regarding PCT, neither the in-hospital mortality nor the 30-day mortality of the patients categorized to group 0 of the cardiovascular subscore of the SOFA score showed significant differences between the groups assigned according to PCT concentration (P=0.0933 and P=0.2536, respectively). Regardless of the cardiac subscore of the SOFA score, in all 397 patients, both sST2 and PCT concentrations were significantly higher in 30-day non-survivors than in 30-day survivors (155.7 [54.5-212.1] ng/mL vs. 82.4 [39.8-186.7] ng/mL, P=0.0114 and 1.2 [0.2-3.7] ng/mL vs. 0.3 [0.1-1.4] ng/mL, P=0.0021, respectively).
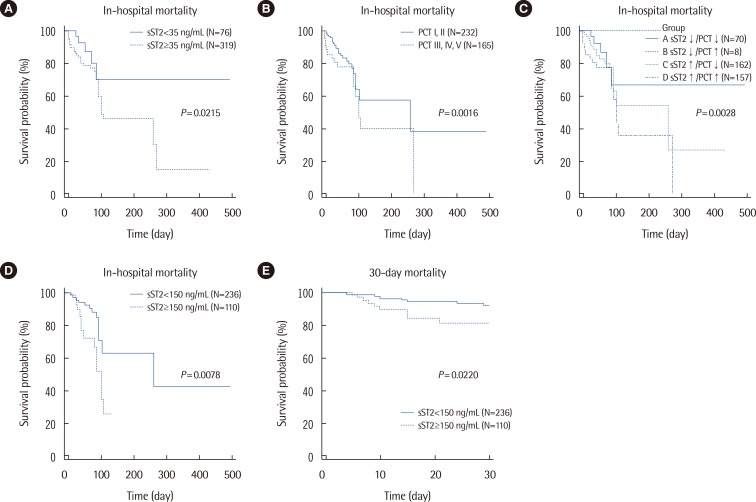 | Fig. 2Kaplan-Meier survival curves according to serum sST2 and PCT concentrations. (A) The 2 groups of sST2 concentrations above and below the cut-off of 35 ng/mL, respectively, significantly differed in their survival probabilities (P=0.0213, logrank test; HR=2.77 [95% CI, 1.47-5.23]). (B) The 2 groups of PCT concentrations above and below the cut-off of 0.5 ng/mL, respectively, significantly differed in their survival probabilities (P=0.0016, logrank test; HR=2.21 [95% CI, 1.29-3.81]). (C) Survival probability was significantly different among the 4 groups categorized according to sST2 and PCT concentrations (P=0.0028, logrank test). The HR (95% CI) of A vs. D was 3.61 (1.70-7.63), and that of C vs. D was 2.07 (1.15-3.73). (D) In the patients with a group 0 cardiovascular subscore of the SOFA score, survival probability was significantly different between subjects with sST2 concentrations above and below the cut-off of 150 ng/mL, respectively (P=0.0078, logrank test; HR=2.45 [95% CI, 1.09-5.50]). (E) In the patients with a group 0 cardiovascular subscore of the SOFA score, 30-day mortality was significantly different between subjects with sST2 concentrations above and below the cut-off of 150 ng/mL, respectively (P=0.0220, logrank test; HR=2.66 [95% CI, 1.02-7.11]).Abbreviations: sST2, soluble suppression of tumorigenicity 2; PCT, procalcitonin; HR, hazard ratio; CI, confidence interval; SOFA, sepsis-related organ failure assessment.
|
When the patients were divided into four groups above and below each cut-off value of sST2 and PCT concentrations, the overall concordance rate for subject categorization was 57.2% (227/397), showing poor agreement between these two serum biomarkers (kappa=0.223; 95% CI, 0.159-0.287). When the cardiovascular subscores of the SOFA score were compared according to sST2 and PCT concentrations, although abnormal (groups 1-4) cardiovascular subscores appeared to be more frequent in the groups with high sST2 concentrations than in the groups with low sST2 concentrations, this difference did not reach statistical significance (6.4% vs. 14.4%) (Fig. 3).
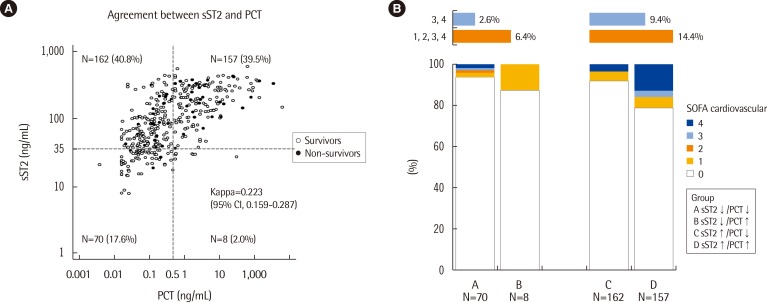 | Fig. 3(A) Agreement between sST2 and PCT and (B) distribution of cardiovascular subscores of the SOFA score in the 4 groups categorized according to serum sST2 and PCT concentrations.Abbreviations: sST2, soluble suppression of tumorigenicity 2; PCT, procalcitonin; SOFA, sepsis-related organ failure assessment.
|
Go to :
DISCUSSION
sST2 is an emerging, novel biomarker related to cardiac fibrosis, and its usefulness as a prognostic marker for heart failure has received growing attention. Binding of sST2 to IL-33 inhibits the beneficial and protective effects of IL-33 on the heart. Activation of the IL-33/transmembrane isoform of ST2 signaling pathway is also known to be involved in other noncardiac diseases such as inflammation. In addition to endogenous danger signals such as myocardial infarction and tissue damage, exogenous danger signals such as microbial pathogens and endotoxins also stimulate inflammatory cytokine secretion, enhance sST2 production, and consequently attenuate immune responses in organs exposed to danger signals [10].
Regarding sepsis, sST2 has been explored in one experimental study and four clinical studies [1112131419]. Increased sST2 concentrations were reported in limited numbers of septic patients (15 patients in each study) [1112], and another study by Hoogerwerf et al. [14] reported that sST2 concentrations were correlated with sepsis severity in 95 patients with severe sepsis. In terms of sST2 measurement, only one study used the highly sensitive Presage ST2 assay, which meets the quality specifications required for the clinical laboratory [12], while the other studies used assay kits intended for research purposes.
In the present study, we analyzed serum sST2 concentrations in combination with PCT concentrations, cardiovascular subscores of the SOFA score, and clinical outcomes to explore the role of sST2 in relation to both heart failure and sepsis severity. In our results, sST2 concentrations differed significantly according to the presence or absence of sepsis as determined based on the serum PCT concentration (Fig. 1). Our data is in line with the previous findings [14] and further clarifies that measuring sST2 would be useful for risk stratification or severity staging in sepsis.
The SOFA scoring system was developed to set some simple but objective criteria to define the degree of organ dysfunction/failure in sepsis, using variables independent of the therapeutic interventions [7]. However, differently from the other subscores of the SOFA score, the assessment of cardiovascular dysfunction/failure in the SOFA scoring system was based on the requirements for adrenergic support, as there was no better, objective way to describe it. Our data demonstrated that the serum sST2 concentration may be related to the cardiovascular subscore of the SOFA score as well as PCT concentration (Table 2). There was no apparent close correlation between the sST2 concentration and the cardiovascular subscore of the SOFA score. However, the sST2 concentration in groups 3-4 of the cardiovascular subscore was significantly higher than that in groups 0-2, implying a significant association of sST2 concentration with cardiac dysfunction/failure (83.4 ng/mL vs. 148.6 ng/mL, respectively, P=0.0123). Considering the limitations of the cardiovascular subscore of the SOFA score, our data suggests that the clinical use of sST2, a novel biomarker of heart failure, has the potential to describe cardiovascular dysfunction/failure more objectively and simply in sepsis.
It was noteworthy that in-hospital mortality was significantly different among the groups categorized on the basis of serum sST2 and PCT concentrations (Fig. 2). In particular, in-hospital mortality was elevated when sST2 concentrations were increased, and the highest in-hospital mortality was observed when both the sST2 and PCT concentrations were increased. The association of PCT with the severity and clinical outcome of sepsis has been investigated in previous studies [161718]. Although sepsis is still a clinical diagnosis, PCT measurements can be used for sepsis diagnosis and to discontinue antibiotic therapy in patients who initially seem septic, but have no subsequent evidence of infection [5]. Of note, even in the patients categorized into group 0 of the cardiovascular subscore of the SOFA score, in-hospital mortality and 30-day mortality were significantly higher when sST2 concentrations were increased; on the contrary, survival probability did not differ according to PCT concentrations in this group. Additionally, regardless of the cardiac subscore of the SOFA score, both sST2 and PCT concentrations were significantly higher in 30-day non-survivors than in 30-day survivors (P=0.0114 and P=0.0021, respectively). The present findings demonstrate that sST2 is a potential prognostic marker of sepsis, and combined use of sST2 and PCT seems to be better than PCT alone to predict clinical outcomes in septic patients.
It is known that sST2 concentrations are increased in heart disease as well as in inflammatory disease [10]. In the present study, sST2 concentrations were related to PCT concentrations as well as cardiovascular subscores of the SOFA score. However, there was a poor agreement among the groups categorized according to sST2 and PCT concentrations (Fig. 3). In addition, the distribution of the cardiovascular subscores of the SOFA score differed according to sST2 concentrations, although this finding did not reach statistical significance. In the critical care setting of sepsis, acute and chronic underlying conditions may be combined and related to mortality. An increased serum sST2 concentration seems to be attributable to both cardiac and inflammatory comorbidities and may reflect the prognosis in sepsis.
Some studies have suggested that sST2 concentrations may differ between men and women, and, therefore, sex-specific cut-off values may be necessary [1221]. In the present study, we adopted a clinical cut-off of 35 ng/mL that was selected by choosing a Presage ST2 Assay concentration value above the 90th and below the 95th percentile of the reference group (245 women and 245 men) [16]. The prognostic performance of sST2 at the 35 ng/mL cut-off was evaluated in the 912 HF-ACTION participants, and using Cox proportional hazards models of sST2, the prognostic utility of the Presage ST2 Assay was not found to be adversely influenced by the common confounders of age, gender, and renal function [15]. In our data, there was no significant difference in the distribution of sST2 concentrations between men and women (data not shown).
This study has several limitations. First, we did not investigate the distribution of sST2 concentrations in relation to the specific bacteriological profile or to the clinical features in detail. Second, because this study was performed on patients with suspected sepsis, the number of critically ill patients with severe sepsis or septic shock was relatively small, leaving room for further studies. Finally, our biomarker analysis was confined to sST2 and PCT, without including other conventional biomarkers (serum C-reactive protein and white blood cell counts) or other potential biomarkers. The potential clinical usefulness of some innovative biomarkers, including natriuretic peptides, cardiac troponin, and neutrophil gelatinase-associated lipocalin, has been discussed in the diagnosis, staging, and monitoring of sepsis, and these biomarker-guided strategies may allow for more refined risk stratification and lead to improved patient care and outcomes [171821222324]. If sST2 is measured alongside these biomarkers, it may increase the usefulness of a multimarker approach in septic conditions.
In conclusion, this is the first study that has explored sST2 in combination with PCT, the cardiovascular subscore of the SOFA score, and clinical outcomes in patients with suspected sepsis. The present findings demonstrate that the serum concentration of sST2 may be related to both cardiac dysfunction/failure and sepsis severity, implying the potential usefulness of sST2 for risk stratification and prognosis prediction in septic patients. The combined use of sST2 and PCT as biomarkers would provide additive value in the management of septic patients. Further studies with follow-up data and serial measurement of sST2 are awaited to support our findings.
Go to :
 XML Download