

 PDF
PDF ePub
ePub Citation
 Print
Print


INTRODUCTION
Mucopolysaccharidosis type I (MPSI) is a lysosomal storage disease caused by deficient or absent activity of the α-L-iduronidase (IDUA; EC 3.2.1.76) enzyme, which catalyzes the degradation of the glycosaminoglycans (GAGs), e.g., dermatan and heparan sulfates [1,2,3]. Mass spectrometry-based analytical methods have been used to screen MPSI by distinct values of IDUA enzyme activity in bloods, i.e., dried blood spot (DBS) samples [4,5,6,7,8]. The amount (mol) of product into which a synthesized/spiked substrate was cleaved during incubation with IDUA, was measured and used to calculate enzyme activity. Early in method development, sample preparation prior to flow injection into a mass spectrometer (not coupled with liquid chromatographic separation) consisted of complex procedures. These included (1) extraction of enzyme from DBS by vortexing for 1 min and shaking for 45 min at 37℃; (2) 20- or 16-hr incubation to allow the reaction between the enzyme and substrate to occur; (3) reaction-quenching with sodium acetate; (4) liquid-liquid extraction (LLE) to eliminate polar interfering substances; and (5) drying under a stream of nitrogen and reconstitution of samples [4, 5].
Spacil et al. [6, 7] simplified sample preparation, i.e., without LLE, by employing mass spectrometric detection coupled with liquid chromatography (LC) to separate the product from potential matrix interferences. In addition, Mechtler et al. [8] shortened the incubation time to 3 hr by applying turbulent flow chromatography (TFC)-ultra high performance liquid chromatography-tandem mass spectrometry (UPLC-MS/MS). The two-dimensional LC was essential to minimize ionization suppression by matrix interference and, at the same time, to detect a smaller amount of product due to a shorter time of reactive incubation (3 hr vs. 16 hr). In the present study, we developed a novel tandem mass spectrometry (MS/MS) method to screen MPSI. The study was approved by the Institutional Ethics Committee of Samsung Medical Center.
METHODS
1. Materials and reagents
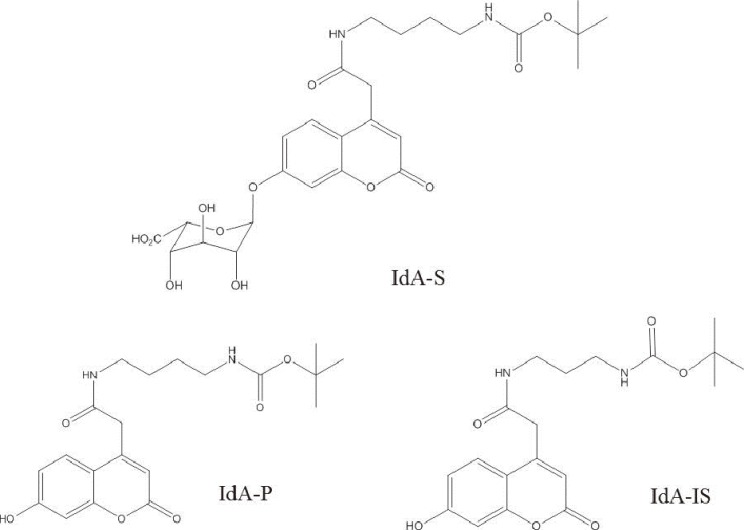
Two mixtures of substrate-internal standard (S-IS, IDUA S & IS Analyte Specific Reagent, REF: BR-05-153, Lot NO: X0635, powder) and product-internal standard (P-IS, 1:1, mol/mol, powder) were provided by the Genzyme Center Corporate Headquarters (Cambridge, MA, USA): the chemical compositions of substrate (IdA-S), product (IdA-P), and internal standard (IdA-IS) of IDUA are C26H34N2O12, C20H26N2O6, and C19H24N2O6, respectively (Fig. 1). Centers for Disease Control and Prevention (CDC) DBS samples at four different levels, (base, low, medium, and high) of IDUA enzyme activity were provided by the CDC (Atlanta, GA, USA). The CDC-reported activity values, i.e., mean activities (range), were 0.08 µmol/hr/L blood (0.00-0.59), 0.39 µmol/hr/L blood (0.00-1.11), 5.54 µmol/hr/L blood (4.22-6.87), and 11.49 µmol/hr/L blood (8.40-14.58) at the base, low, medium, and high levels, respectively.
Acetonitrile, methanol, and water were of HPLC grade and were purchased from Burdick and Jackson (Honeywell International, Morristown, NJ, USA). Analytical reagent grade formic acid was purchased from ProteoChem (Cheyenne, WY, USA). Sodium formate and D-saccharic acid 1,4-lactone monohydrate were used to prepare a cocktail buffer and were purchased from Sigma Aldrich (St. Louis, MO, USA). Well plates (microplate polypropylene, round bottom, chimney style) were purchased from Greiner Bio-One (Monroe, NC, USA), while 1.7-mL microtubes were purchased from Axygen (Union City, CA, USA). A thermo shaker incubator (model: MS-100) was purchased from Hangzhou Allsheng Instruments Co., Ltd. (Hangzhou City, China).
2. Preparation of calibration standard
A P-IS stock solution (both concentrations 1.0 µM) was prepared by adding 150 µL of 0.2% formic acid in methanol to a vial containing P-IS (1:1, mol/mol). A calibration standard of P-IS (both concentrations 2.0 nM) was prepared by a 500-fold dilution of the stock solution with 0.2% formic acid in acetonitrile-water (40:60, v/v). The aliquots (50 µL) were stored at -4℃ prior to usage.
3. Preparation of cocktail buffer and incubation cocktail (S-IS cocktail)
Cocktail and incubation buffers were prepared as previously described [4,5,6,7,8], with some modifications. Briefly, a cocktail buffer (18 mL) was prepared by mixing 17.5 mL of IDUA buffer (0.112 mol/L sodium formate + 0.158 mol/L formic acid, pH 3.6) with 0.5 mL of saccharolactone IDUA inhibitor solution (3.0 mmol/L D-saccharic acid 1,4-lactone monohydrate in water). The solution was stored at 4℃ until use. A S-IS cocktail (S, 1.67 mM, IS, 11.8 µM) was prepared by adding 18 mL of cocktail buffer to a vial, which contained 17 mg substrate and 0.08 mg internal standard. The aliquot solutions were stored at -4℃ until use.
4. Sample preparation
For the 3-hr-reactive incubation, samples were prepared as previously described [5] with modifications. Briefly, 30 µL of S-IS cocktail (S, 50.1 nmol; IS, 0.354 nmol) was added to a punched DBS in 96-well plates with centrifugation for 3 min at 2,000 g, followed by incubation at 37℃ for 3 hr with 250 rpm agitation to allow the reaction between the IDUA enzyme and substrate to occur. Water-acetonitrile (100 µL, 20:80, v/v) was added to quench the reaction. The supernatant aliquot was diluted 500-fold with water-acetonitrile (93:7, v/v) prior to liquid chromatography-tandem mass spectrometry (LC-MS/MS) analysis.
5. Liquid chromatography-tandem mass spectrometry
An AcQuity ultra-performance liquid chromatography (UPLC) system (Waters, Milford, MA, USA) with a cooling autosampler, a column oven with temperature control, a degasser, and a binary pump was used to inject 2 µL of prepared samples onto a reversed-phase analytical column (Kinetex XB-C18, 50 mm length × 2.1 mm i.d., 2.6 µm particle size, 100Å, Phenomenex, Torrance, CA, USA), which was maintained at 37℃. Chromatographic separations of samples were performed using linear gradient elution of mobile phases involving 0.1% formic acid in water (A), and 0.1% formic acid in acetonitrile (B) over 2.8 min of total run time: 0 min (7% B), 0.5 min (7% B), 1.5 min (50% B), 1.7 min (90% B), 2.2 min (90% B), and 2.3 min (7% B) at a 0.5 mL/min flow rate. The strong and weak solutions used to wash the autosampler were 0.1% formic acid in acetonitrile and 0.1% formic acid in water, respectively.
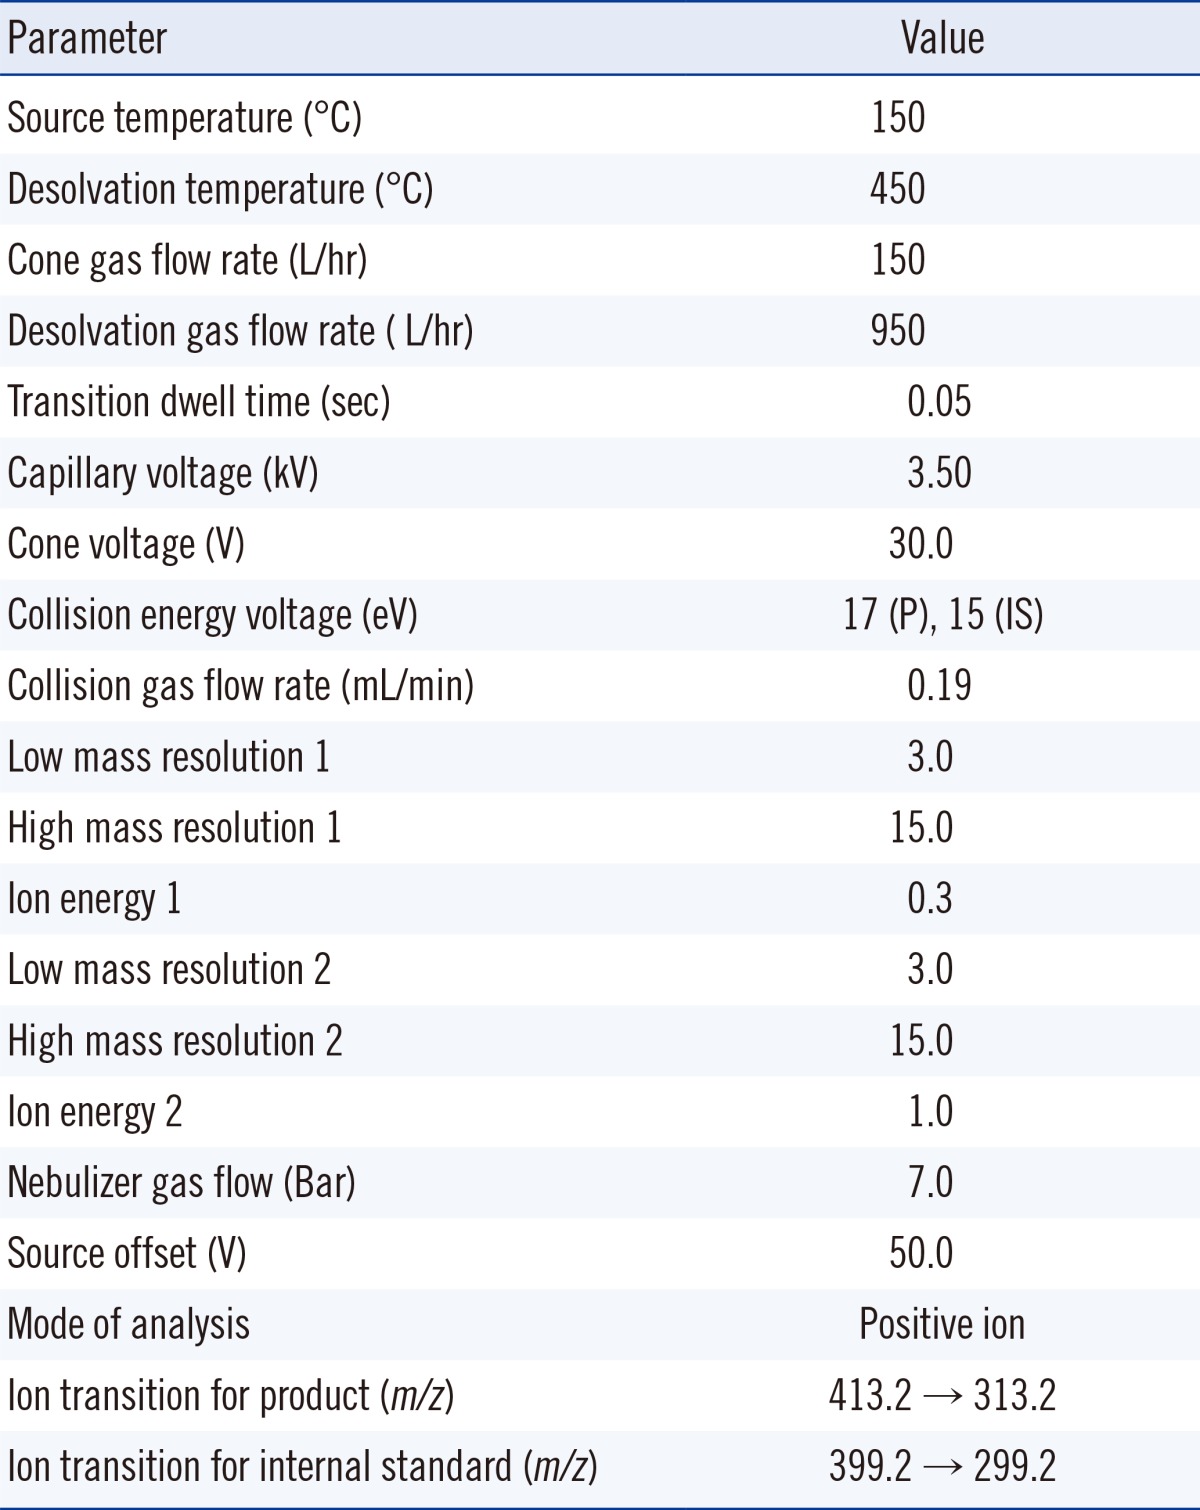
A Xevo TQ-S triple quadrupole mass spectrometer (Waters) equipped with an electrospray ionization (ESI) interface was used to detect product and internal standard in the column effluents. The mass spectrometric conditions for ionization and multiple-reaction monitoring (MRM) of product and internal standard were optimized by injection of product-internal standard solution onto LC-MS/MS. Optimum mass spectrometric conditions are summarized in Table 1. The MRM fragmentation transitions for data acquisition were m/z 413.2-313.2 for product and m/z 399.2-299.2 for internal standard at a cone voltage of 30.0 V and collision energies of 17 eV (for product) and 15 eV (for internal standard) with dwell times of 50 msec for each transition. Data acquisition and analysis were performed using the MassLynx™ NT 4.1 software with Quan-Lynx™ program (Waters).
6. Calculation of enzyme activity by single-point calibration
In previous papers [4,5,6,7,8], the enzyme activity was calculated in µmol/hr/L from the product amount (mol) divided by blood volume (-3.1 µL per 3.2 mm DBS punch), and incubation time, where the product amount was calculated from the response ratio of product-to-internal standard for a sample, multiplied by the amount (mol) of added internal standard as follows:
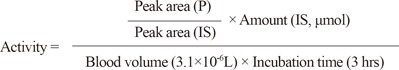
Where the amount of internal standard was calculated from the concentration of IS in a S-IS cocktail added to punched DBS, multiplied by the cocktail volume. On the basis of this calculation, we established a single-point calibration by plotting the response ratio of product to internal standard vs. the nominal activity (38.07 µmol/hr/L) of IDUA enzyme in DBS.
7. Method validation
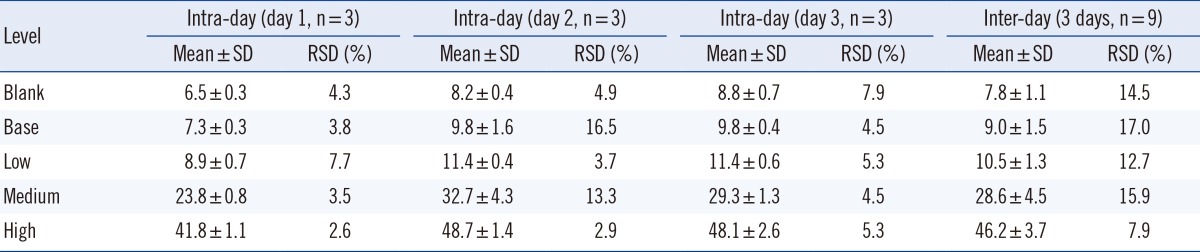
The intra-day precision of this method was evaluated by analyzing a blank sample and four CDC-control samples at base, low, medium, and high levels of IDUA enzyme activities in three replicates (n=3) along with a single-point calibration curve. To evaluate inter-day precision, the run (within a day) was repeated on three consecutive days (total: n=9).
8. Clinical application in controls and patients
We prepared DBS samples from 139 normal controls (119 newborns and 20 healthy adults) and tested IDUA activity. In addition, we obtained DBS from four patients with MPSI at the time of study. All patients were diagnosed with MPSI by biochemical and molecular genetic investigation, and they were subjected to enzyme replacement therapy (ERT). Unfortunately, we could not obtain DBS samples from the patients without treatment.
RESULTS
1. Tandem mass spectrometric conditions
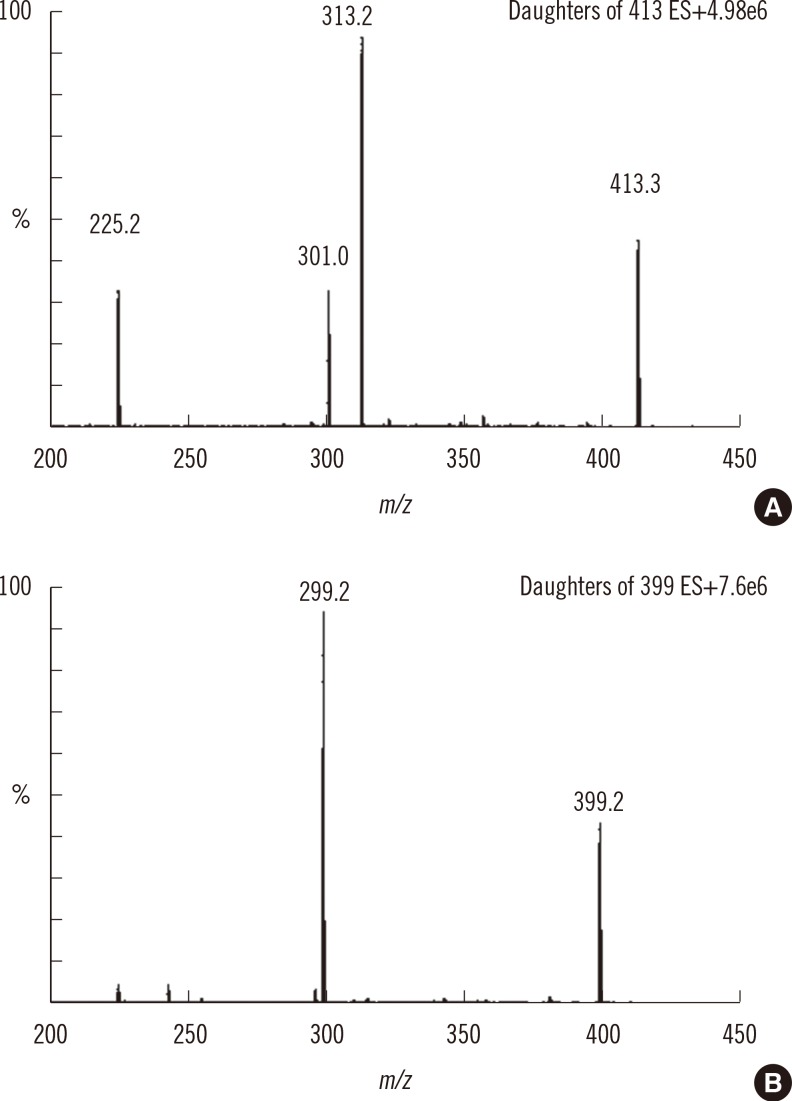
The mass spectrometric conditions were optimized (capillary voltage, cone voltage, collision energy, etc.) for electrospray ionization and MRM of product and internal standards. The positive electrospray ionization mode was selected for the detection of product and internal standard, which were more sensitive in positive mode than negative mode. In the positive ion full scan, the sodium-adducted ions [M+Na]+ were abundantly generated at m/z 413.2 and 399.2 for product and internal standard, respectively. More fragments were generated with increasing collision energy. The prominent stable product ion for product was obtained at m/z 313.2, with collision energy of 17 eV, and the internal standard was monitored by the most abundant product ion at m/z 299.2 with collision energy of 15 eV (Fig. 2).
2. Liquid chromatographic conditions and dilution of sample residue
Conditions were optimized to obtain peaks of product and internal standard with high intensity, good shape, and a stable response that was not affected by endogenous substances derived from matrices. We applied conventional, reversed-phase, and liquid chromatography-for example, using a C18 column-on which product and internal standard were well retained and separated because of their relative non-polarity. Under a gradient-mobile phase condition of water-acetonitrile-0.1% formic acid, several C18 columns have been tested: core-shell-type columns such as Phenomenex Kinetex XB-C18 (50×2.1 mm i.d., 2.6 µm) and Agilent Poroshell 120 EC-C18 (50×3.0 mm i.d., 2.7 µm), and a porous-type UPLC column such as a Waters BEH (50×2.1 mm i.d., 1.7 µm). There were no noticeable differences between the columns in terms of peak shape (tailing and symmetry) and peak height. However, the Waters BEH column showed much higher pressure than other columns, -5,000 psi at 0.5 mL/min. In addition, the Agilent Poroshell column gave later elution of product and internal standard than other columns: ~1.4-1.8-fold elution time, depending on the initial conditions of the gradient mobile phase. Finally, a Kinetex XB-C18 column was chosen for liquid chromatographic separation of product and internal standard considering the lower pressure of the column and the shorter elution time.
3. Method Validation
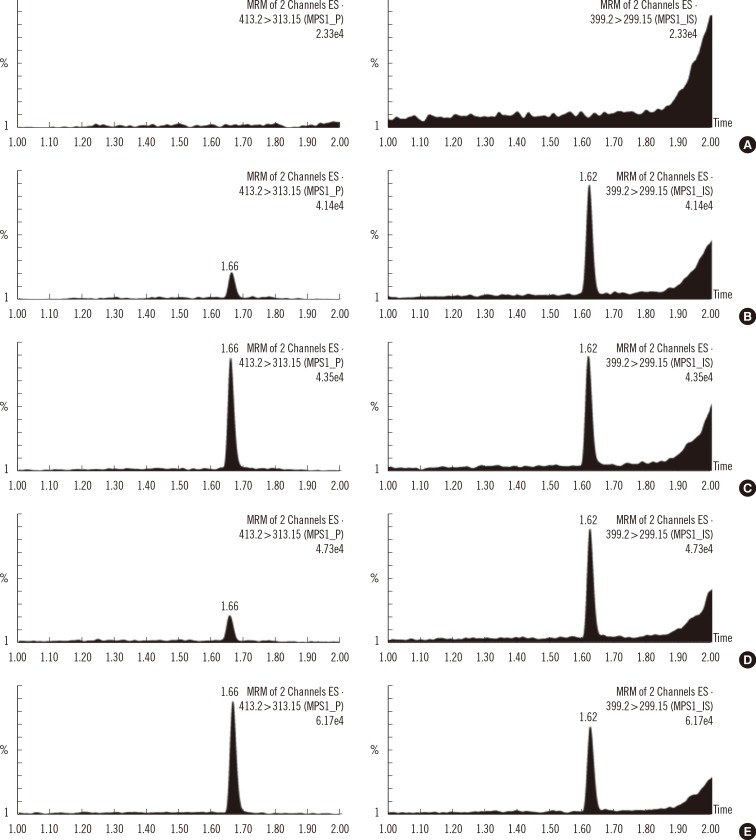
The suitability of this system was tested by repeated injection of a P-IS standard mixture solution throughout the method validation. The response ratio of product-to-internal standard (P/IS) was precise within a batch; the relative standard deviation (RSD) was 4.48-11.49%. The retention times of the product and internal standard were constant at 1.66 min and 1.62 min, respectively. The peak shapes of the product and internal standard were reproducible in terms of symmetry and width. By comparing the MRM chromatograms between the calibration standard and double-blank sample (free of substrate, product, and internal standard), no obvious peak significantly affected the response of P and IS around each retention time, indicating the absence of interfering substances during the sample preparation (Fig. 3 A vs. C).
Although no product was spiked into the blank sample (spiked with substrate and internal standard), a noticeable peak of product was observed, as shown in Fig. 3 B. We suggest that this product came from the S-IS standard mixture because it was also found in the standard, which was analyzed without any treatment before LC-MS/MS. In addition, we hypothesized that product was formed through a cleavage reaction of substrate, even without IDUA enzyme under 3-hr incubation at 37℃, because the response ratios P/IS in the blank samples (incubated S-IS standard solution) were approximately 4-5 fold higher than response ratios P/IS in the S-IS solution (results not shown).
The intra-day and inter-day precision results are presented in Table 2. The analytical method developed in this study was precise because the intra- and inter-day precision ranged between 2.6-16.5% and 7.9-17.0%, respectively, across all levels of a blank and four controls.
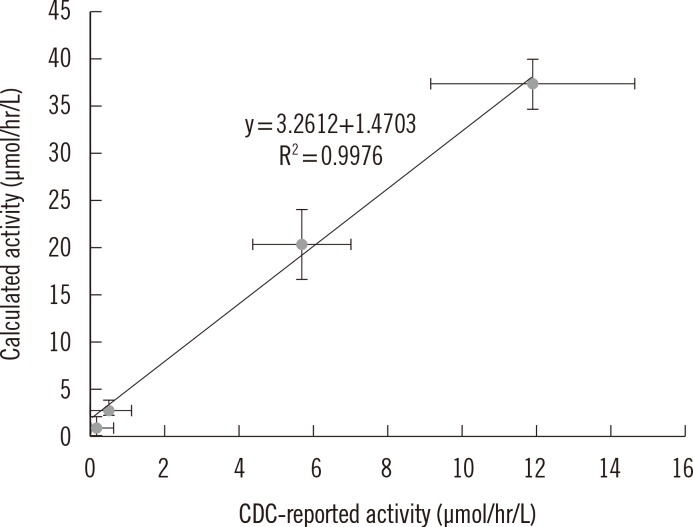
A correlative regression study on IDUA activity in CDC-control samples was performed to assess the validity of the developed method (Fig. 4).The calculated values were obtained by subtracting activity values in the blank sample from activity values in control samples within a batch, as was previously reported [5]. A highly significant linear association (r2=0.9976) was found between the calculated and CDC-reported values. In addition, the values of mean and standard deviation indicated that the calculated activities in the four level-control samples were distinct from each other. Therefore, this method was found to be reliable and applicable to MPSI screening to differentiate between affected patients and normal individuals.
4. Evaluation of IDUA activity in healthy individuals and affected patients
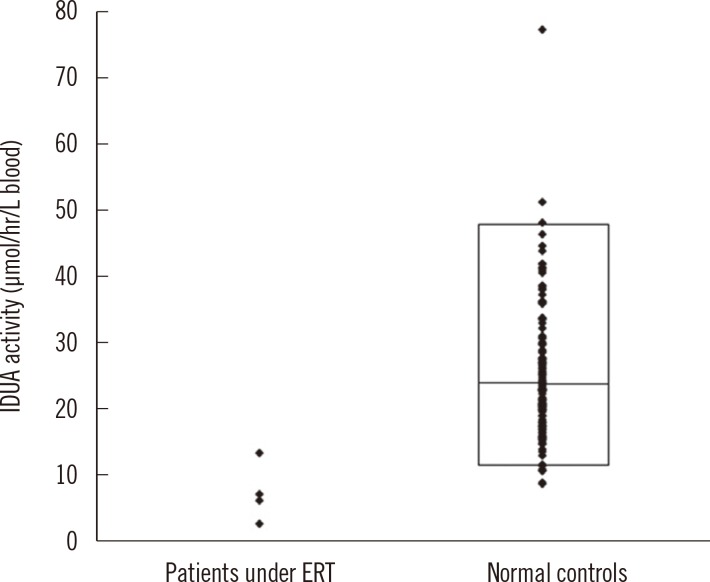
The median activity of IDUA from healthy individuals was 23.2 µmol/hr/L (2.5th-97.5th percentile, 11.0-47.7 µmol/hr/L). Among the four DBS samples obtained from each patient under ERT, one sample gave an enzyme activity value (IDUA activity, 3.04 µmol/hr/L) well below the activity range in normal samples, two other samples gave values (6.38 and 7.42 µmol/hr/L) lower than the lowest activity (8.98 µmol/hr/L), and the other sample gave a value (13.57 µmol/hr/L) between the lowest and 25% activity values (Fig. 5). We confirmed that the MPSI patients under ERT had appropriate IDUA activity.
DISCUSSION
In comparison with the most advanced method previously reported on two-dimensional chromatography techniques spectrometry [8], the method described herein achieved a distinct improvement: simple and conventional one-dimensional liquid chromatography was enough to reliably measure the products from significant matrix effects after a simple one-step extraction and 3-hr incubation without further purification, e.g., LLE. The LC-MS/MS method yielded acceptable results in terms of intra- and inter-day precisions and correlation between our evaluated activities and CDC-reported activities.
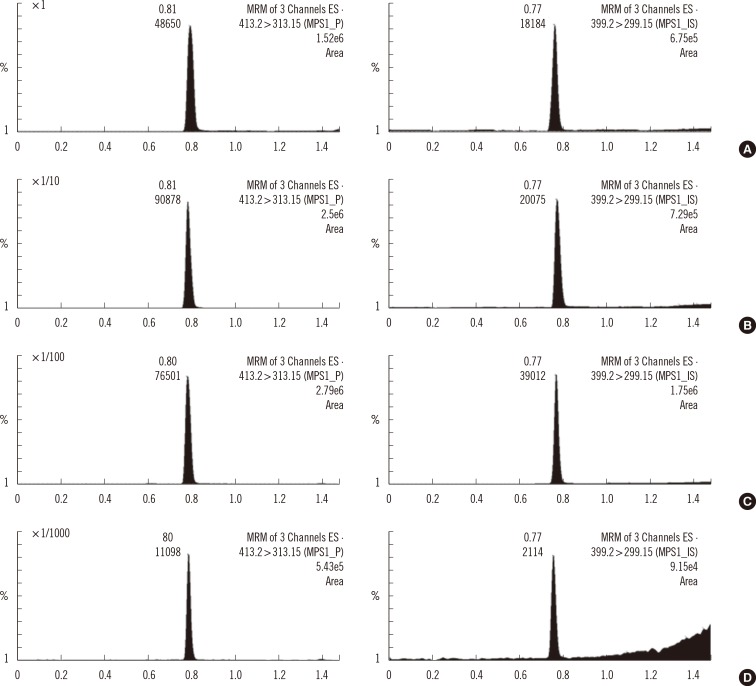
In previous studies, a clean-up procedure, (e.g., LLE, prior to mass spectrometric detection) was essential to reduce the matrix effect by removing endogenous polar substances [4, 5]. The simplified sample preparation procedures, with LLE excluded, were enabled by the application of liquid chromatographic separation after 16-hr incubation [6, 7], or two-dimensional liquid chromatographic clean-up, i.e., TurboFlow® chromatography-UHPLC, after 3-hr incubation [8]. Mechtler et al. [8] performed two-dimensional LC to remove contaminating materials and, at the same time, detect a smaller amount of products generated by a 3-hr incubation in a time frame less than 16 hr. In this study, we significantly reduced the matrix effect-induced ionization suppression by simply diluting the sample residue after 3-hr incubation with aqueous solution prior to LC-MS/MS (Fig. 6). Despite the fact that serial dilution of sample residue decreased the concentrations of product and internal standard, the sensitivities of product and internal standard inversely increased to about 100-fold dilution. Finally, the sample residue was diluted 500-fold with water-acetonitrile (93:7, v/v) prior to LC-MS/MS analysis to make it roughly equal to responses of IS in the calibration standard. Moreover, holding mobile phase B (0.1% formic acid in acetonitrile) 7% for 0.5 min before the start of its gradient elution demonstrated higher stability and reproducibility of product and internal standard responses, because polar interference was eluted early and had less effect on ionization suppression.
The negative difference in the calculated value between the CDC-report and calculated activities, i.e., CDC-method (used to report CDC-activity values) and our method (developed in this study), was inversely proportional to the response ratio (P/IS) with a correlation value of 0.9961 (r2). From the logarithmic curve, we assumed that the CDC-method might provide dramatically more ionization suppression with a lower amount of product in comparison with our method. Unlike the CDC-reported values of medium and high CDC-control samples, however, the reported values of negative SD for the base and low CDC-control samples were the same as each mean activity value (µmol/hr/L) and lower than each positive SD: 0.08, +0.51/-0.08 and 0.39, +0.72/-0.39 (mean, +/-SD), respectively. Negative activities were frequently obtained from a lower response ratio (P/IS) in the base- and low-level samples than in blank samples (incubated S-IS standard) by a matrix effect. Thus, our developed method reduced ionization suppression (by matrix effect) relative to the CDC-method.
The analytical method developed in this study was simple, fast, robust and reproducible for measurement of IDUA activity in DBS with LC-MS/MS. Compared to previous studies, this method has advantages in terms of sample preparation and liquid chromatography. Therefore, injection of sample residue, simple 500-fold dilution after short-term incubation, and the use of conventional LC required no further sample preparation or complex liquid chromatographic separation to decrease matrix effect-induced ionization suppression. The developed method was verified to give acceptable reproducibility, reliability considering precision, and correlation between the calculated and the CDC-reported activities. Furthermore, we showed that this method is applicable to MPSI (Hurler) screening.
 XML Download