Abstract
Background
This study describes a novel analytical method for simultaneously determining sarpogrelate and its metabolite (M-1) in human plasma, using liquid chromatography coupled with tandem mass spectrometry, with electrospray ionization in the positive ion mode.
Methods
Sarpogrelate, M-1, and labeled internal standard (d3-sarpogrelate) were extracted from 50 µL of human plasma by simple protein precipitation. Chromatographic separation was performed by using a linear gradient elution of a mobile phase involving water-formic acid (99.9:0.1, v/v) and acetonitrile-formic acid (99.9:0.1, v/v) over 4 min of run time on a column, with a core-shell-type stationary phase (Kinetex C18, 50 mm×2.1 mm i.d., 2.6-µm particle size, Phenomenex, USA). Detection of the column effluent was performed by using a triple-quadruple mass spectrometer in the multiple-reaction monitoring mode.
Results
The developed method was validated in human plasma, with lower limits of quantification of 10 ng/mL for sarpogrelate and 2 ng/mL for M-1. The calibration curves of sarpogrelate and M-1 were linear over the concentration ranges of 10-2,000 and 2-400 ng/mL, respectively (R2>0.99). The carry-over effect, precision, accuracy, and stability of the method met the criteria for acceptance.
Sarpogrelate was developed as a 5-hydroxytryptamine (5-HT) 2A-receptor antagonist [1, 2] and is used for the treatment of peripheral arterial disease. Its metabolite, M-1, produced by hydrolysis, is also a potent 5-HT2A-receptor antagonist [3, 4]. While sarpogrelate has antiplatelet, antithrombotic, antimitogenic, and antiatherosclerotic properties [5], its therapeutic concentration range remains unclear. Sarpogrelate also inhibits platelet aggregation dose-dependently in patients with ischemic stroke [6], and both sarpogrelate and M-1 inhibit the 5-HT2A receptor. Thus, measurement of the sarpogrelate and M-1 plasma concentrations may facilitate evaluation of clinical efficacy of this agent in patients.
Sarpogrelate levels have been determined in human and rat plasma with liquid chromatography-tandem mass spectrometry (LC-MS/MS)-based methods [7,8,9], which have several disadvantages: chromatographic elution with ion-pairing buffer agents, time-consuming solid-phase extraction, and high plasma sample volume requirement, increasing the cost and complexity of the method. Moreover, simultaneous determination of sarpogrelate and M-1 in human plasma using LC-MS/MS has not been reported. Since the concentrations of M-1 are about 7-fold lower than those of sarpogrelate in human plasma, determination of sarpogrelate and M-1 is typically performed separately using different sample preparation methods and LC-MS/MS conditions [10].
This study aimed to develop and validate a novel LC-MS/MS method for clinical application in the investigation of pharmacokinetics of sarpogrelate and M-1.
Sarpogrelate hydrochloride (purity 98.9%), its active metabolite (M-1, purity 99.6%), and internal standard (IS, d3-sarpogrelate HCl, purity 98.1%) were purchased from TLC PharmaChem, Inc. (Ontario, Canada). Methanol, acetonitrile, and water were of HPLC grade (Burdick and Jackson; Muskegon, MI, USA). Analytical reagent grade formic acid was purchased from ProteoChem (Denver, CO, USA). All other chemicals were of analytical grade.
Stock solutions of sarpogrelate (1,000 µg/mL), M-1 (400 µg/mL), and IS (500 µg/mL) were separately prepared in methanol-water (50:50, v/v) and stored at -70℃. Aliquots of sarpogrelate and M-1 stock solutions were diluted and mixed with methanol-water (50:50, v/v) to prepare working solutions of 200 and 40 µg/mL, respectively. A working solution of the IS (250 ng/mL) was prepared by dilution in acetonitrile. All working solutions were stored at 4℃.
A calibration curve sample at the highest concentration (upper limit of quantification, ULOQ) was prepared at 2,000 and 400 ng/mL for sarpogrelate and M-1, respectively, by spiking 10 µL of the working solution into 990 µL of blank human plasma. The ULOQ sample was diluted with blank plasma to yield calibration curve samples in the range of 10-2,000 ng/mL for sarpogrelate and 2-400 ng/mL for M-1. To prepare four quality control (QC) samples, i.e., lower limit of quantification (LLOQ), low, medium, and high QC samples (LQC, MQC, and HQC), at the respective concentration levels of 10, 30, 250, and 1,500 ng/mL for sarpogrelate and 2, 6, 50, and 300 ng/mL for M-1, working solution standards were independently prepared, and then spiked into blank plasma. The calibration and QC bulk samples were divided into aliquots in microcentrifuge tubes and stored at -70℃ until required for analysis.
Frozen samples were thawed at room temperature and then vortex-homogenized. Proteins were precipitated to extract sarpogrelate, M-1, and the IS from human plasma. IS working solution (200 µL) was added to 50 µL of plasma in an Eppendorf tube, which was then vortex-mixed for 1 min before centrifugation at 16,000 g for 3 min. The supernatant (50 µL) was diluted with 500 µL of 1.0% formic acid in a clean tube, vortex-mixed for 30 sec, and then transferred into an autosampler vial prior to LC-MS/MS analysis.
An Agilent 1260 Infinity HPLC system (Agilent Technologies, Santa Clara, CA, USA) with a column oven capable of controlling temperature, a degasser, a binary pump, and CTC-PAL autosampler (Agilent Technologies) was used to inject 2.0 µL of prepared samples onto a reversed-phase analytical column (Kinetex C18, 50 mm×2.1 mm i.d., 2.6-µm particle size, Phenomenex, Torrance, CA, USA), which was maintained at 35℃. Samples were chromatographically separated by linear gradient elution with mobile phases of 0.1% formic acid in water (A) and 0.1% formic acid in acetonitrile (B) over a 4 min total run time: 0 min (3% B); 1.5 min (95% B); 2.5 min (95% B); 2.6 min (3% B), at a flow rate of 0.5 mL/min. The strong and weak solutions used to wash the autosampler were 90% isopropanol in water and 70% acetonitrile in water, respectively.
An Agilent 6490 triple-quadrupole mass spectrometer (Agilent Technologies), equipped with an iFunnel Technology source and controlled with MassHunter Workstation software (version B.04.01, Agilent Technologies), was used to analyze column effluents. The MS conditions for ionization and multiple-reaction monitoring (MRM) of analytes and the IS were optimized by injection of standard solutions of analytes and IS onto the LC-MS/MS. The conditions for MS in the positive electrospray ionization (ESI) mode were: 4,000 V of capillary voltage, 0 V of nozzle voltage, 50 psi of nebulizer gas, 14 L/min and 300℃ of drying gas, and 11 L/min and 400℃ of sheath gas. The MRM fragmentation transitions for data acquisition were m/z 430.0→58.0 for sarpogrelate, m/z 330.0→102.0 for M-1, and m/z 433.2→58.0 for IS at a fragmenter voltage of 380 V and collision energies of 25 (sarpogrelate and M-1) and 37 eV (IS), with a dwell-time of 100 msec for each transition.
We validated the developed method in accordance with the United States Food and Drug Administration guidelines, to confirm reliability and reproducibility [11]. To evaluate the specificity and selectivity of the method, double-blank plasma (free of analytes and IS), blank plasma spiked with IS, and blank plasma spiked with analytes and IS at an LLOQ concentration were prepared from six different batches of blank plasma. We compared the chromatograms between batches to investigate potential interference around the chromatographic retention times of sarpogrelate, M-1, and IS. The carry-over effect was evaluated by consecutive analysis of an LLOQ sample, ULOQ sample, and double-blank sample, in five replicates. The responses of analytes and IS in the double-blank sample should be <20% and <5%, respectively, in comparison with those in the LLOQ sample.
For the evaluation of linearity, eight calibration curve samples were prepared over a range of 10-2,000 ng/mL for sarpogrelate and 2-400 ng/mL for M-1 in plasma. The linearity of the calibration curve, which was established by plotting peak-area ratios of analyte to IS vs. the nominal concentrations of the analyte, was determined by using weighted (1/χ2) linear least-squares regression analysis by which the regression parameters of intercept, slope, and correlation coefficient were calculated. The LLOQ was determined as the lowest concentration of the analyte with a precision <20% and an accuracy within ±20% on the calibration curve. The precision values were obtained by calculating percentage RSD, and the accuracy values were derived by calculating the percentage RE.
The intra-day precision and accuracy were evaluated in five replicates (n=5) of QC samples at the four concentration levels (LLOQ, LQC, MQC, and HQC) within a day. To evaluate the inter-day precision and accuracy, the run (within a day) was repeated on five consecutive days (total n=25). The acceptable limit of RSD and RE were <15% and within ±15%, respectively, for three QC samples, and was <20% and within±20%, respectively, for the LLOQ sample. The stabilities of sarpogrelate and M-1 in post-extracted (processed) samples were evaluated by analyzing extracted QC samples at four concentration levels after 27 hr of storage in an autosampler at 7.0℃.
A clinical study for the pharmacokinetics of sarpogrelate and M-1 was performed in male volunteers, who were judged to be healthy by physical examination, vital signs, and routine laboratory tests. This protocol was approved by Institutional Review Board of Samsung Medical Center, Seoul, Korea, and all subjects gave written informed consent prior to participation in the study. Twenty subjects were enrolled, and nineteen completed the study.
Subjects were admitted to the Clinical Trial Center of the Samsung Medical Center at 10:00 pm the night before the clinical study and fasted for 10 hr. Subjects were administered 100 mg sarpogrelate in the form of immediate-release reference formulation (Yuhan Corp., Seoul, Korea) with 240 mL of water. Blood samples (8 mL each) were collected before and at 1, 2, 4, 6, and 10 hr after dosing and were frozen at -80℃ until analysis. The following pharmacokinetic parameters of sarpogrelate and M-1 were estimated: area under the concentration-time curve until the last measurable time point (AUC), maximum plasma concentration (Cmax), time required to reach Cmax (tmax), and metabolic ratio (M-1 AUC divided by sarpogrelate AUC). Non-compartmental analysis was performed by using Phoenix WinNonlin (version 6.2, Pharsight Corp., Mountain View, CA, USA).
Chromatographic conditions for obtaining analyte and IS peaks with high intensities, good shape, and stable responses were developed. We applied conventional reversed-phase liquid chromatography on a C18 column, on which the analytes and IS were retained and separated well owing to its relatively non-polar properties. Several C18 columns were tested by using diverse mobile phase conditions, i.e., methanol and acetonitrile in water with acidic and ammonium buffers. Compared to fully porous-type stationary phase columns, we chose a core-shell-type stationary phase column (Phenomenex Kinetex C18) for liquid chromatography of sarpogrelate, M-1, and the IS, because of its faster elution, higher sensitivity, and better reproducibility in retention, peak shapes, and responses of the analytes and IS, without interference from endogenous substances derived from plasma matrices.
Various mobile phase modifiers, such as formic acid and ammonium buffers, under gradient elution of acetonitrile in water were investigated, for optimization of mobile phase conditions. Addition of 0.1% formic acid, as an acidic modifier, to the mobile phase, rather than ammonium formate buffer, yielded an excellent response in positive ion electro-spray. A higher percentage (1.0%) of formic acid in the diluting solution, added to the extracted sample before LC-MS/MS analysis, improved separation of the analytes from unknown interfering substances, and minimized peak tailing (Fig. 1).
Finally, a reproducible chromatograph of sarpogrelate and M-1 with high responses and good peak shapes was achieved by introduction of samples prepared in acidic diluents onto a core-shell-type and reversed stationary phase column (Phenomenex Kinetex C18) with a gradient elution of water-formic acid (99.9:0.1, v/v) and acetonitrile-formic acid (99.9:0.1, v/v) as mobile phases. This allowed fast separation of analytes and IS from interfering endogenous plasma substances, with sufficient robustness for high-throughput analysis of real samples.
We optimized the MS conditions (capillary voltage, nozzle voltage, nebulizer gas, drying gas, sheath gas, fragmenter voltage, collision energy) for electro-spray ionization and MRM of analytes and the IS. The positive electro-spray ionization mode was selected, since it was more sensitive than the negative mode. In the positive ion full scan, protonated molecule ions [M+H]+ were abundantly generated at m/z 430.0 for sarpogrelate, m/z 330.0 for M-1, and m/z 433.2 for the IS. More fragments were generated with increasing collision energy. The prominent stable product ion for sarpogrelate and M-1 was obtained at m/z 58.0 and 102.0, respectively, with a collision energy of 14 eV, and that of the IS at m/z 58.0, with a collision energy of 14 eV.
Fig. 1A, B, and C show the representative chromatograms of double-blank plasma, blank plasma spiked with the IS, and blank plasma spiked with analytes and the IS at the LLOQ concentration. The retention times of sarpogrelate, M-1, and IS were 1.47, 1.45, and 1.47 min, respectively. No obvious interference was found at these retention times in double-blank plasma samples from six different individuals. The responses of the analytes and IS in LLOQ samples were not affected considerably, demonstrating the chromatographic separation from endogenous substances in blank plasma. When blank plasma spiked with sarpogrelate was analyzed to investigate potentially chromatographic interference with M-1 and the IS (d3-sarpogrelate), no interfering peaks were observed (data not shown).
The precision (RSD) and accuracy (RE) of sarpogrelate in the LLOQ sample that was injected after consecutive injections of the highest concentration of calibration sample and double-blank sample (a cleaner) during the method validation were 5.2 and 10.6% (n=4), respectively. Likewise, the precision and accuracy of M-1 were 3.7 and 5.9% (n=4), respectively. This demonstrated that the quantification of sarpogrelate and M-1 was not influenced by carry-over throughout the analysis.
Each calibration curve exhibited good linearity, with correlation coefficients (r2) above 0.99, and met the acceptance criteria, because each back-calculated standard concentration from a calibration equation was within ±15% of the nominal value (results not shown). As indicated in Supplemental Data Table S1, the accuracy and precision of the mean concentrations of sarpogrelate in calibration samples in the range of 10-2,000 ng/mL exhibited RE of -3.01 to 2.33% and RSD within 3.92%. Moreover, the precision and accuracy of M-1 in the range of 2-400 ng/mL exhibited RSD <3.94% and RE values of -2.19 to 1.67%, respectively. The correlation coefficient was precise, with RE of 0.009 and 0.027% for sarpogrelate and M-1, respectively. The precision of the curve slopes were and 6.9 and 17.7% for sarpogrelate and M-1, respectively, on three consecutive days. Therefore, the calibration curves applied during method validation demonstrated reliable linearity and reproducibility over the standard concentrations across the calibration range. The LLOQ was determined as 10 ng/mL for sarpogrelate and 2 ng/mL for M-1, because the intra- and inter-day precision and accuracy of the calculated concentration did not exceed acceptable limits, viz., 20% and±20%, respectively.
The intra- and inter-day precision and accuracy of the method were determined by analyzing four QC samples ranging between 10 and 1,500 ng/mL for sarpogrelate and 2 and 300 ng/mL for M-1, in three replicates, along with one calibration curve on each of three runs (Table 1). The precision of sarpogrelate and M-1 were <8.56 and <5.56%, respectively. The accuracy of sarpogrelate and M-1 ranged from -4.09 to 12.43% and from -2.72 to 3.83%, respectively. Thus, the method was accurate and precise owing to the RSD and RE values falling within the acceptance criteria.
The stabilities of sarpogrelate and M-1 in post-extracted (processed) samples are summarized in Table 2. Since the precision and accuracy of analyte concentration in plasma were < 6.50% and between -2.51 and 4.00%, respectively, sarpogrelate and M-1 in plasma samples were stable, without any noticeable degradation during storage and handling of samples under the conditions prior to LC-MS/MS analysis (Table 2).
The representative chromatograms of real samples are shown in Fig. 1D. No chromatographic interference caused by endogenous substances in real samples, similar to those of spiked samples, was found at the retention times of sarpogrelate, M-1, and the IS. We prepared and analyzed two sets of three QC samples (LQC, MQC, and HQC), between which real samples were analyzed in each batch run, to assess the performance of the method. The accuracy of the analyte concentrations in the QC samples was evaluated to determine the integrity and validity of the real sample analysis data: no concentration exceeded ±15% in comparison with the nominal samples (results not shown). We also evaluated the reproducibility of calibration and QC samples throughout the analysis of real samples. As indicated in Supplemental Data Table S2, the precision and accuracy of sarpogrelate concentrations in calibration and QC samples exhibited RSD <7.26% and RE values of -3.13 to 2.10%, respectively, and those of M-1 exhibited RSD <7.81% and RE values of -4.67 to 2.61%, respectively. The calibration curves applied to real sample analyses demonstrated good linearity and precision with mean correlation coefficients of 0.9981 (sarpogrelate) and 0.9976 (M-1) and RSD of 0.06% (sarpogrelate) and 0.13% (M-1) (n=8). The response ratio of sarpogrelate and M-1 to the IS over all calibration curves was reproducible, with the precision value of curve slopes of 9.35 and 10.24% of the RSD, respectively (n=8). The consistency in peak areas of the IS over the complete analyses of all samples, including calibration, QC, and real plasma samples, was assessed with a precision value of 21.7% (n=375).
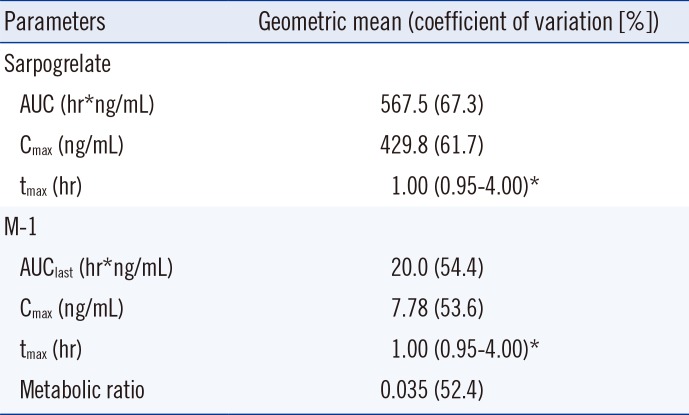
Sarpogrelate demonstrated fast absorption (median tmax approximately 1 hr), and plasma levels of sarpogrelate were below the LLOQ within 6 hr after oral administration. Moreover, sarpogrelate was rapidly converted to M-1, which was measurable for 6 hr. The mean plasma concentration-time profile is shown in Fig. 2. Considerable interindividual variability was observed for the pharmacokinetic parameters of sarpogrelate and M-1, with coefficients of variation >50%. The pharmacokinetic parameters are summarized in Table 3. Under fasting conditions, the mean AUC of sarpogrelate determined here was comparable with those previously reported [9, 10]. The imprecise Cmax and the tmax are most likely due to infrequent sampling.
We developed a simple, reproducible, fast, and robust LC-MS/MS method that allows for simultaneous quantification of sarpogrelate and its metabolite, M-1, in human plasma for the first time. This novel method exhibited excellent performance in terms of simultaneous LC-MS/MS analysis and the simplicity of sample preparation. The method employed simple protein precipitation and fast liquid chromatographic separation of sarpogrelate and M-1, while protein precipitation, solid-phase extraction, and LC-MS/MS were previously used for sarpogrelate only [7,8,9] or used separately for sarpogrelate and M-1 [10].
Unlike previous methods using ammonium formate or ammonium acetate as an additive to the mobile phase [5,6,7,8], the simple composition of our chromatographic mobile phase (water-acetonitrile-0.1% formic acid) reduced contamination of the mass spectrometer and elevated the sensitivity, by minimization of band broadening and tailing, by employing a column with a core-shell-type stationary phase. Additionally, only small aliquots (50 µL) of plasma were needed for quantification of the sarpogrelate and M-1 at an LLOQ of 10 ng/mL and 2 ng/mL, respecrespectively, with a plasma dilution factor of 55, and a 2-µL injection volume. Previous methods required 500 µL for determination of sarpogrelate [7] and 120 µL for M-1 [10], despite solid-phase extraction. Therefore, optimization of sensitive LC-MS/MS conditions allowed for simple and rapid sample preparation, during which the analytes and IS were extracted from human plasma by protein precipitation. Core-shell-type stationary phase chromatography, used for stable retention and high sensitivity, yielded acceptable validation results, without any significant interference from endogenous substances in plasma matrices.
A carry-over effect was present: the responses of analytes and the IS exceeded 20% and 5%, respectively, in a double-blank sample, which was analyzed immediately after the ULOQ sample, in comparison with those in the LLOQ sample. Optimization of washing conditions for strong and weak solutions used in the autosampler had limited effects on this phenomenon. However, injection of a processed double-blank plasma sample as a cleaner between sample injections was superior to the injection of organic solvent (methanol or acetonitrile) and eliminated the carry-over effect, because few responses of analytes and IS were observed in the double-blank sample that was analyzed after consecutive injections of the highest concentration of calibration sample and cleaner.
The developed method was successfully applied to high-throughput analysis of real samples and was then used in a clinical study of the pharmacokinetics of sarpogrelate and M-1.
Acknowledgments
This study was supported by a grant of the Korean Health technology R&D Project, Ministry for Health & Welfare, Republic of Korea (HI13C0871). We would like to thank to Heejae Sang for assistance in blood sample collection for the clinical study.
References
1. Muntasir HA, Bhuiyan MA, Ishiguro M, Ozaki M, Nagatomo T. Inverse agonist activity of sarpogrelate, a selective 5-HT2A-receptor antagonist, at the constitutively active human 5-HT2A receptor. J Pharmacol Sci. 2006; 102:189–195. PMID: 17031071.

2. Ogawa T, Sugidachi A, Tanaka N, Fujimoto K, Asai F. Pharmacological profiles of R-96544, the active form of a novel 5-HT2A receptor antagonist R-102444. Eur J Pharmacol. 2002; 457:107–114. PMID: 12464356.

3. Israilova M, Suzuki F, Tanaka T, Nagatomo T, Taniguchi T, Muramatsu I. Binding and functional affinity of sarpogrelate, its metabolite m-1 and ketanserin for human recombinant alpha-1-adrenoceptor subtypes. Pharmacology. 2002; 65:69–73. PMID: 11937776.

4. Orlandini E, Rapposelli S, Nencetti S, Giannaccini G, Betti L, Balsamo A. Synthesis and 5-HT2A, 5-HT1A and alpha1-binding affinities of 2-[2-Hydroxy-3-(pyridin-3-yl-methyl)amino]-, 2-[2-hydroxy-3-(2-pyridin-2-yl-ethyl)amino]- and 2-[2-hydroxy-3-(4-N-methyl-piperazin-1-yl)-amino]propoxybenzaldehyde-O-(substituted) benzyl oximes. Arch Pharm (Weinheim). 2007; 340:135–139. PMID: 17335104.
5. Saini HK, Takeda N, Goyal RK, Kumamoto H, Arneja AS, Dhalla NS. Therapeutic potentials of sarpogrelate in cardiovascular disease. Cardiovasc Drug Rev. 2004; 22:27–54. PMID: 14978517.

6. Uchiyama S, Ozaki Y, Satoh K, Kondo K, Nishimaru K. Effect of sarpogrelate, a 5-HT(2A) antagonist, on platelet aggregation in patients with ischemic stroke: clinical-pharmacological dose-response study. Cerebrovasc Dis. 2007; 24:264–270. PMID: 17622759.
7. Patankar S, Pudage A, Joshi SS, Vaidya VV, Gomes NA. Rapid and sensitive LC-MS-MS method for the determination of sarpogrelate in human plasma. Chromatographia. 2009; 69:671–676.

8. Nirogi R, Kandikere V, Mudigonda K, Ajjala D, Suraneni R, Thoddi P. Liquid chromatography tandem mass spectrometry method for the quantification of sarpogrelate, a selective 5-HT2A receptor antagonist, in plasma: application to a pre-clinical pharmacokinetic study. Biomed Chromatogr. 2010; 24:1159–1167. PMID: 20954206.
9. Zhang C, Wang L, Yang Y, Sun Y, Zhang J, Li G, et al. Validated LC-MS/MS method for the determination of sarpogrelate in human plasma: application to a pharmacokinetic and bioequivalence study in Chinese volunteers. J Pharm Biomed Anal. 2010; 53:546–551. PMID: 20399588.

10. Kim TE, Kim JR, Jung JA, Kim SR, Lee JW, Jun H, et al. Comparison of pharmacokinetics between sarpogrelate hydrochloride immediate-release formulation and controlled-release formulation. Int J Clin Pharmacol Ther. 2013; 51:114–119. PMID: 23073143.

11. US Food and Drug Administration. Guidance for industry: Bioanalytical method validation. Updated on Sep 2013. Available from: http://www.fda.gov/downloads/Drugs/GuidanceComplianceRegulatoryInformation/Guidances/UCM368107.pdf.
Supplementary Material
alm-35-391-s001.pdf
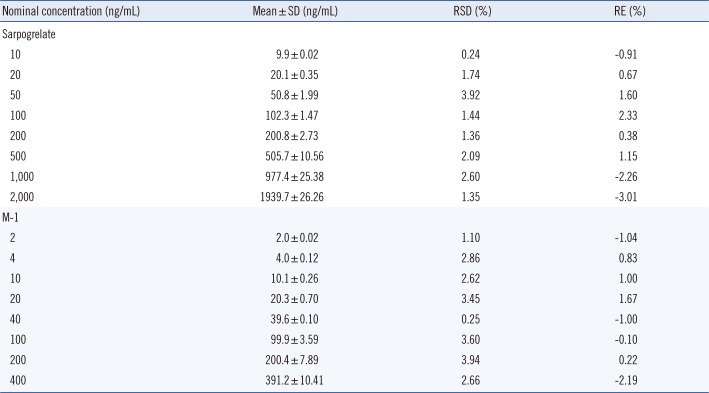
Supplemental Data Table S1
Precision and accuracy of sarpogrelate and its metabolite (M-1) in calibration curve samples (N=3)

alm-35-391-s002.pdf
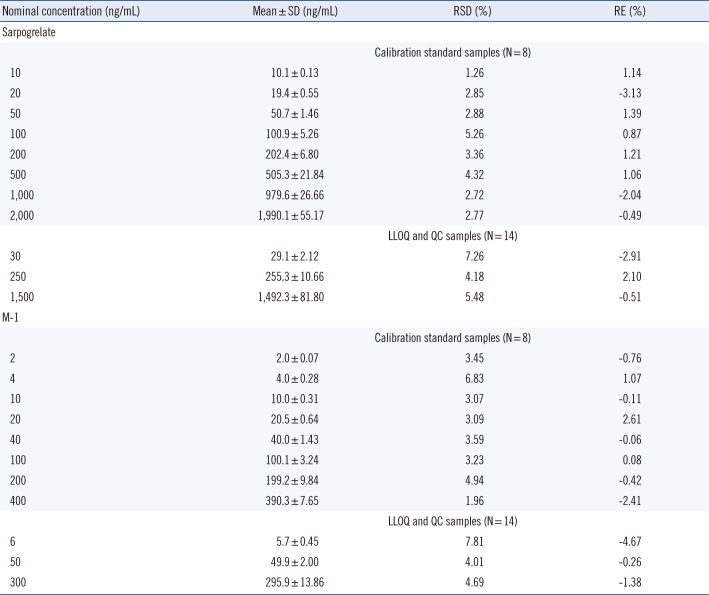
Supplemental Data Table S2
Precision and accuracy of sarpogrelate and its metabolite (M-1) in calibration standard, LLOQ, and QC samples used for determination of real plasma samples

Fig. 1
Representative multiple reaction monitoring chromatograms of sarpogrelate (left panel), its metabolite (M-1; middle panel), and internal standard (IS; right panel) in (A) double-blank plasma, (B) blank plasma spiked with IS, (C) blank plasma spiked with sarpogrelate and M-1 at lower limit of quantification (LLOQ; 10.0 and 2.0 ng/mL, respectively) and IS, and (D) real plasma sample spiked with IS.
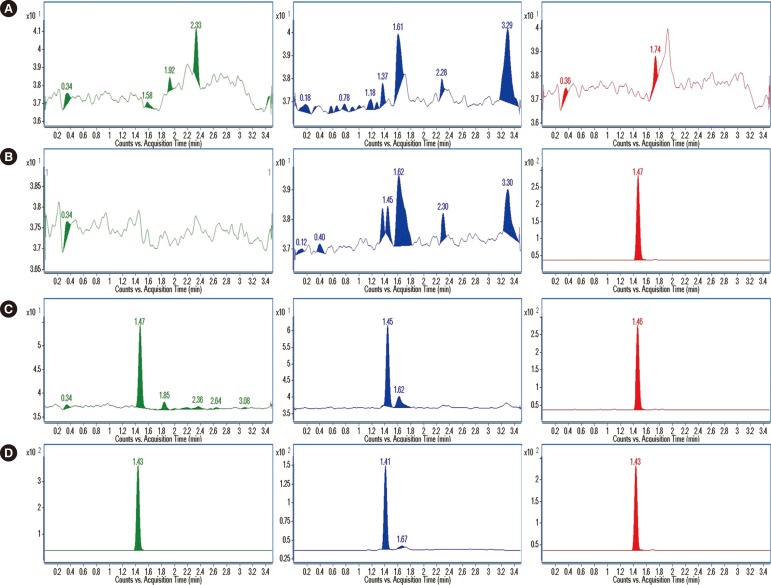
Fig. 2
Mean plasma concentrations of (A) sarpogrelate and (B) its metabolite (M-1) after a single oral administration of 100 mg sarpogrelate in 19 healthy male subjects. Bars represent standard errors.

Table 1
Intra-day and inter-day precision and accuracy of the method for determination of sarpogrelate and its metabolite (M-1) in human plasma (N=3 runs, five replicates per run)
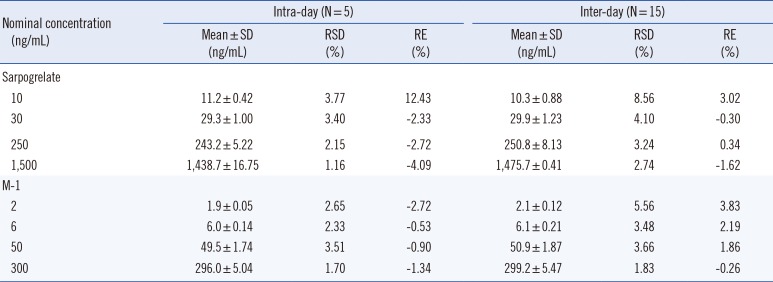
Table 2
Stability of sarpogrelate and its metabolite (M-1) in plasma sample at 7℃ for 27 hr in an autosampler (N=5)
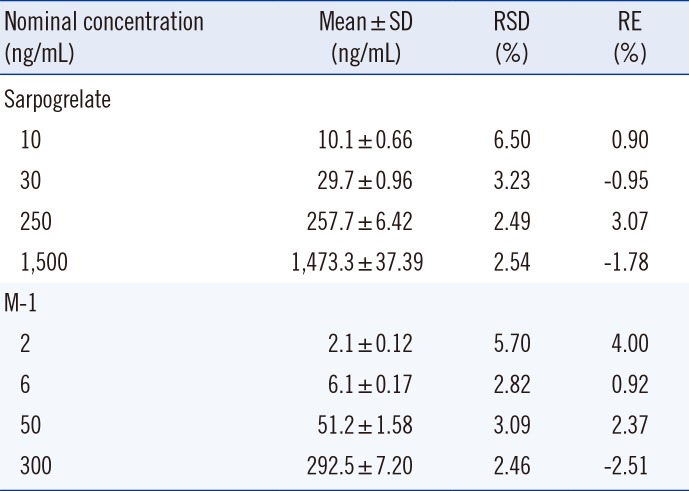
Table 3
Pharmacokinetic parameters of sarpogrelate and its metabolite (M-1) after a single oral administration of 100 mg sarpogrelate in 19 healthy male subjects


 PDF
PDF ePub
ePub Citation
 Print
Print


 XML Download