

 PDF
PDF ePub
ePub Citation
 Print
Print


INTRODUCTION
Differential counting of white blood cells (WBCs) in peripheral blood is frequently ordered by clinicians for diagnosis of various diseases. In most clinical laboratories, it is performed by using automated hematology analyzers, and the results are superior to manual differential counts for mature cells [1, 2]. However, automated hematology analyzers are relatively ineffective in properly recognizing abnormal cells, including blasts, and frequently provide "flag" messages when such cells are present in the blood [3, 4, 5, 6]. Such "flags" are common in hospital laboratories and are insufficient for identifying cases for further microscopic evaluation [3, 4, 7, 8]. Manual WBC differential count by microscopic examination remains the gold standard for this reason, but there are several pitfalls to manual slide review [3, 4]. For example, the statistical precision of manual differential count based on 400 cells for rare cell populations such as blasts or immature granulocytes (IGs) is poor; this was described by Rümke [9] and recently emphasized by the International Council for Standardization in Hematology Working Group on Flow WBC Differential Method [10]. In addition, it is likely that fewer cells can be counted than required, and this method is a labor-intensive and time-consuming process. Another important point is that manual slide review requires expert technicians, and recruitment of qualified personnel has increasingly become a challenge.
The presence and number of blasts in the blood is important for the diagnosis of hematologic diseases and prognosis of patients, especially for the diagnosis of MDS or acute leukemia and monitoring after treatment. The blast count and WBC count in the peripheral blood decrease after treatment. When only a few blasts are present, especially in leukopenic samples, it is difficult and time-consuming to provide an accurate differential count. Sometimes the cells are not evenly distributed throughout the fields, and the morphology can be markedly changed by chemotherapy, so it can be even more difficult to count blasts in such samples. The number of such samples has increased in hospital laboratories in recent years, largely due to an increase in the number of patients undergoing chemotherapy and transplantation [11, 12]. As a result, manual WBC differential count shows variable reproducibility in leukopenic samples [13].
Recently, a new flow cytometric differential counting method, called the CytoDiff method, was introduced (Beckman Coulter, Miami, FL, USA). This method uses a 5-color/6-antibody reagent cocktail (CytoDiff reagent; Beckman Coulter) with an auto-gating algorithm [14] and reports 18 WBC populations, including blast, IGs, and lymphocyte subsets, that are not reported with automatic hematology analyzers or manual differential counts. This method counts approximately 20,000 WBCs and therefore has better precision than manual differential counting methods [9]. CytoDiff counts have been studied in conditions such as leukopenia, sepsis, or lymphocyte subsets in patients with metastatic cancer [15, 16, 17]. However, the performance including rapidity of the CytoDiff method in detecting and counting blasts, the most significant abnormal cells in the peripheral blood, has not been well evaluated.
The objective of this study was to evaluate the performance of the CytoDiff differential counting method in challenging samples with blasts.
METHODS
1. Patients and samples
In total, 815 EDTA-anticoagulated blood samples were analyzed from 475 patients (male 276, female 199) with the median age of 34 yr. Each diagnosis, and the number of patients (n) diagnosed with it, followed by the number of samples (s) were as follows (n, s): acute lymphocytic leukemia (80, 123), acute myeloid leukemia (60, 224), acute promyelocytic leukemia (3, 7), chronic myelogenous leukemia (14, 33), multiple myeloma (26, 34), lymphoma (69, 125), myelodysplastic syndromes (31, 64), chronic lymphocytic leukemia (2, 3), other hematologic and nonhematologic diseases (190, 202). Samples flagged as "blasts" or "variant lymphocytes" were selected. To determine the sensitivity of blast detection with the CytoDiff method, samples with <10% blasts by manual counts were included (0.5% blasts in 16 cases, 1% blasts in 46 cases, 1.5% to 2% blasts in 35 cases, 3% to 9% blasts in 79 cases). A total of 322 samples showed blasts on manual counts, ranging from 0.5% to 99%. Thirty-one control samples with normal complete blood cell counts were also included. This study was approved by the institutional review board of the Catholic Medical Center.
2. Differential count
1) Manual differential count
Manual WBC differential count of 200 cells was performed by 2 trained hematology technicians; one had more than 10 yr of experience in manual slide review, and the other had approximately 3 yr of experience in the same field at our diagnostic hematology laboratory. If blasts were not found on examination of 200 cells and the CytoDiff method showed a characteristic blast population, the slides were reviewed by another technician and a hematopathologist. When there were not enough cells on a slide, we did not count 200 cells and sum all the countable cells; instead, we measured the average analysis time for the manual count of each case.
2) CytoDiff differential count
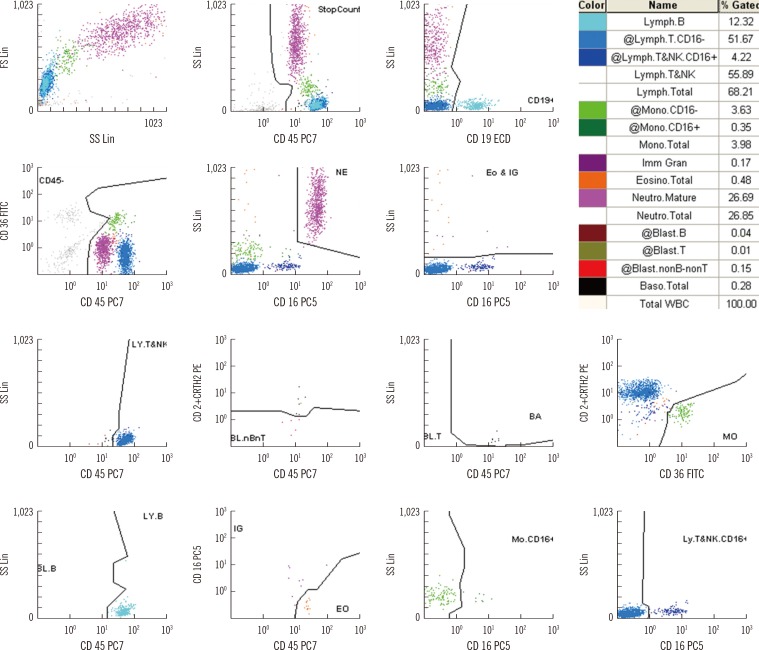
CytoDiff differential count was performed by flow cytometry (FC500; Beckman Coulter) with a pre-mixed CytoDiff reagent and analyzing software (CytoDiff CXP 2.0; Beckman Coulter, Miami, FL, USA). The CytoDiff cocktail included CD36-FITC, CD2-PE, CD294 (CRTH2)-PE, CD19-ECD, CD16-PC5, and CD45-PC7 antibodies. Leukocytes were differentiated into 18 cell populations: B lymphocytes, CD16- T lymphocytes, CD16+ T lymphocytes, T and natural killer lymphocytes, total lymphocytes, CD16- monocytes, CD16+ monocytes, total monocytes, IGs, total eosinophils, mature neutrophils, total neutrophils, B blasts (Xb), T blasts (Xt), monoblasts (Xm), myeloblasts (Xn), total basophils, and total WBCs (Fig. 1). All analysis procedures were performed following the manufacturer's instructions. In brief, 100 µL of whole blood was mixed with 10 µL of the CytoDiff reagent and incubated for 20 min at room temperature. Red blood cells were broken down with lysing solution (VersaLyse solution; Beckman Coulter) for 15 min. Without washing, approximately 20,000 cells were analyzed by using a flow cytometer (FC500) and a 32-tube carousel. The flow cytometer was set according to the manufacturer's instructions, using FlowSet (Beckman Coulter) when the lot was changed. Results were analyzed automatically by the auto-gating analysis software, which separates populations by an in-built automatic logic pathway (Fig. 1). We measured the average analysis time for each test.
The CytoDiff flow cytometric system reported 4 types of blast counts in all samples, including normal samples, although the blast count for each type of blast was <1% in the normal samples. A blast count of ≥1% in the peripheral blood is important for patients. Because the blasts in the peripheral blood are clonal, they should be counted as one type of blast. Therefore, the blast counts by CytoDiff were used separately to find blast-positive cases, not the sum of 4 types of blasts (Xb, Xt, Xm, and Xn), to rule out false-positive cases by background noise of each blast population. If the blast counts of all 4 types were <1%, the case was regarded as a CytoDiff blast-negative case; if at least 1 type of blast count was >1%, it was regarded as a CytoDiff blast-positive case. If more than 2 types of blast counts were >1%, we used the sum of these counts as the blast counts.
3. Statistical analysis
The correlation coefficient and the SE between results from each method were calculated for leukocyte subpopulations by using the Pearson correlation test. We used MedCalc version 11.2 (Mariakerke, Belgium) for the statistical analysis. To show the results of comparison between manual counts and CytoDiff counts, binomial graphs were prepared by using the work (Rümke) table. Envelopes representing 95% confidence bands derived from the formula for aSE of a proportion were superimposed on the graphs. The sensitivity, specificity, positive predictive value, and negative predictive value of CytoDiff blast counts at 1% were calculated.
RESULTS
1. Analysis time and gate adjustment
The manual counting time for each case was 1 to 5 min; it took longer when only a few blasts were found on the smears or when leukopenic samples were involved. The average time required for manual count was approximately 60 min for 20 samples.
The average time required for analysis of 20 samples (20,000 events) by the CytoDiff method was approximately 60 min, including incubation and reading time, and the hands-on time was 15 min. When in need of gate adjustment, an extra 2 min was required per case. With the CytoDiff method, gates were adjusted in 116 of 848 tests (13.7%) due to incorrect gating caused by low side scatter (SS) and/or low fluorescent intensity.
2. Correlations between differential counts using CytoDiff and manual counts
1) Neutrophils, lymphocytes, monocytes, and IGs
The correlations between differential counts using CytoDiff and manual counts of neutrophils, lymphocytes, monocytes, and IGs are shown in Fig. 2. The correlations were good for neutrophils (r=0.8839) and lymphocytes (r=0.8455), but poor for monocytes (r=0.7161), eosinophils (r=0.5059), basophils (r=0.5854), and IGs (r=0.5836). The eosinophil counts obtained by using the DxH 800 showed better correlation to manual counts (r=0.8202) than those using CytoDiff to manual counts. Other cell populations showed a poor correlation to manual counts.
2) Blasts
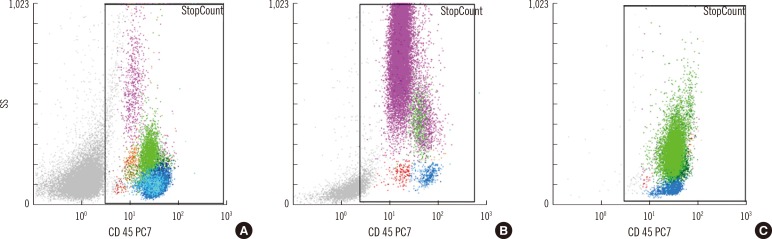
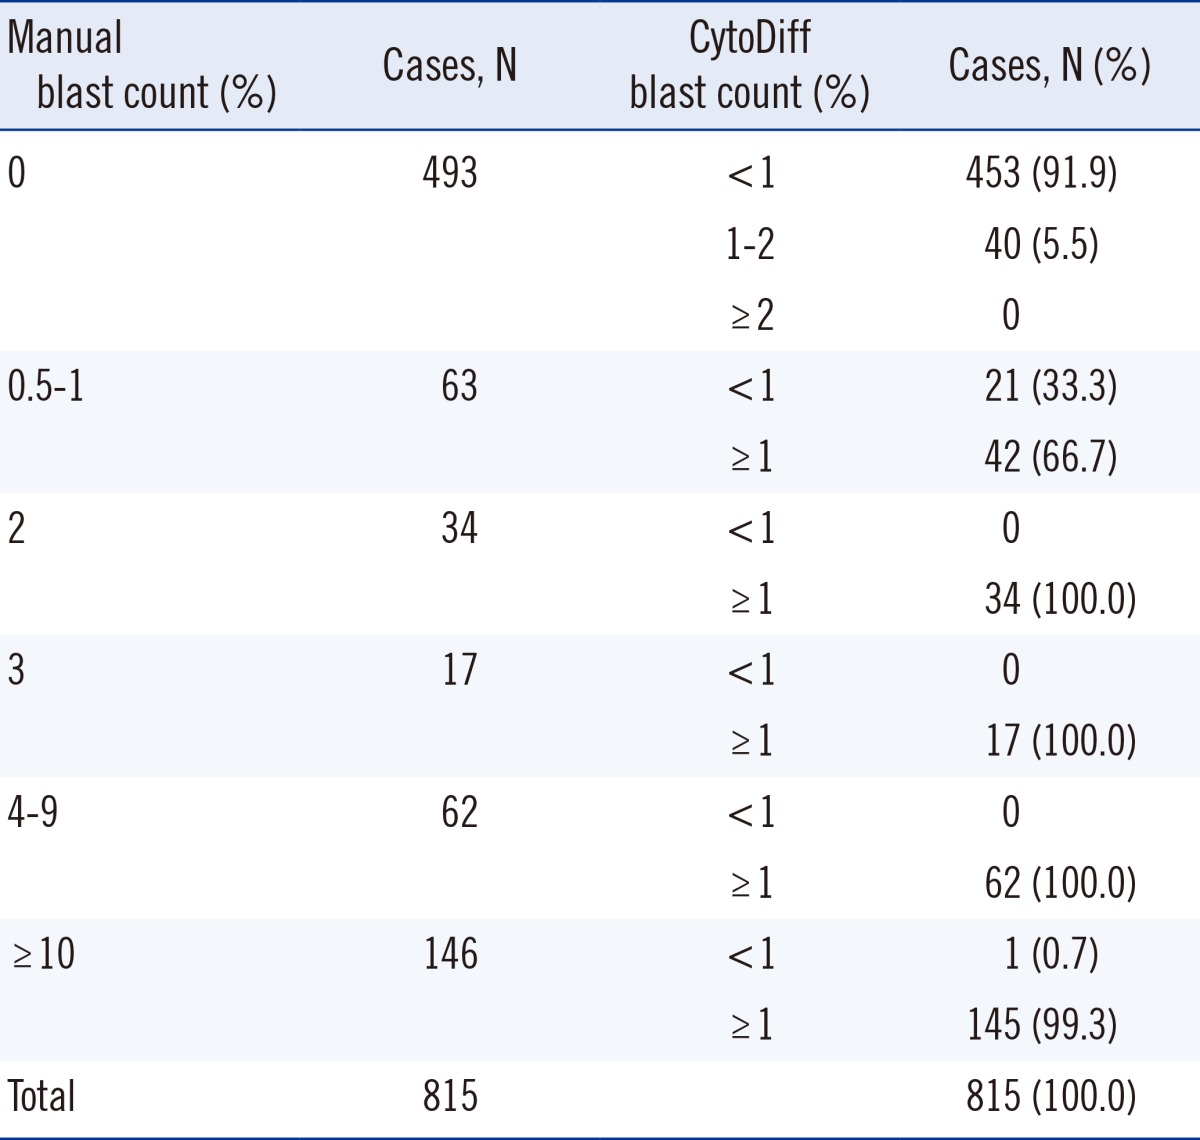
In total, 322 of 815 cases (39.5%) showed blasts on manual counts, and CytoDiff detected >1% blasts in 304 cases (sensitivity of 94.4% with 95% CI of 91.2-96.6) among them. The remaining 18 cases were CytoDiff blast-negative cases; the manual blast counts were 0.5% in 12 cases, 1% in 4 cases, 1.5% in 1 case, and 12% in another case (Table 1). Four of these 18 cases showed characteristic blast populations on CD45/SS plots (Fig. 3A and B). The manual blast count of another case was 12% and showed that these cells were mainly leukemic promonocytes, not blasts (Fig. 3C). A characteristic blast population was not found on CD45/SS plots in the remaining 13 cases. Of the 322 manual blast count-positive cases, 309 were determined to be blast positive (sensitivity of 96.0% with 95% CI of 93.0-97.7) when a 1% cutoff value for CytoDiff blast count was used along with examination of the characteristic blast population on CD45/SS plots.
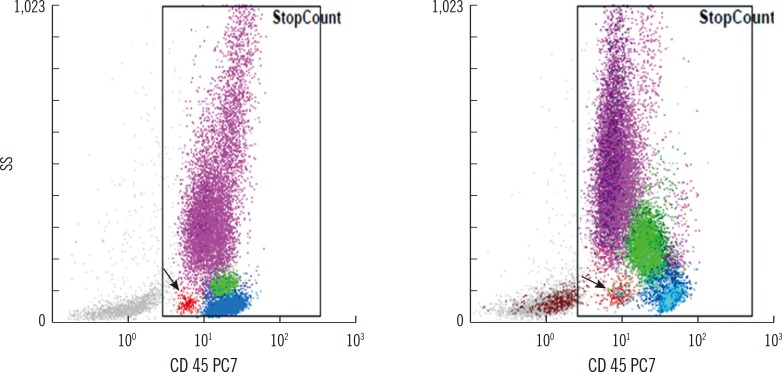
A total of 493 cases showed no blasts on manual counts, and CytoDiff blast counts were also negative in 453 of these cases (specificity of 91.9% with 95% CI of 89.0-94.1). The remaining 40 cases showed 1% to 2% blasts (Xn in 32 cases and other blasts in the remaining 8 cases) on the CytoDiff counts. There was no characteristic blast population on CD45/SS plots in 32 of these 40 cases (80%), and 8 cases showed a similar population to blasts on CD45/SS plots, but SS was too low in these cases. Of the 493 manual blast count-negative cases, 485 were determined to be blast negative (specificity of 98.4% with 95% CI of 96.7-99.2) when a 1% cutoff value for CytoDiff blast count was used along with examination of the characteristic blast population on CD45/SS plots. Eight cases showing no manual blasts on the first count but 0.5% on the second count showed >1% CytoDiff blast counts and the characteristic blast population on CD45/SS plot (Fig. 4). No cases showed ≥2% blasts on the CytoDiff counts. The positive predictive value was 88.4% (304/344 cases), and negative predictive value was 96.2% (453/471 cases). All cases showing >2% blasts on the CytoDiff counts had a characteristic blast population with weak CD45 and low SS on CD45/SS plot. The CytoDiff blast counts correlated well to the manual counts (r=0.9223).
DISCUSSION
It is widely known that manual slide review takes much longer to perform than CytoDiff counts (60 vs. 15 min for 20 samples, as in our study), especially when leukopenic samples are involved. Moreover, manual review demands a high level of expertise and experience compared with CytoDiff counts, which may require gate adjustment.
In this study, we adjusted gates in more than 10% of the samples to accommodate incorrect gating. For correct performance of CytoDiff software, routine control should include a daily check using FlowSet and follow-up of the position of X mean for each fluorescent channel. Another useful daily QC method is to run one normal control sample every day before running patient samples to confirm the accuracy of the instrument setting, reagent, and software. If daily QC were performed as described, gate adjustment would not be necessary.
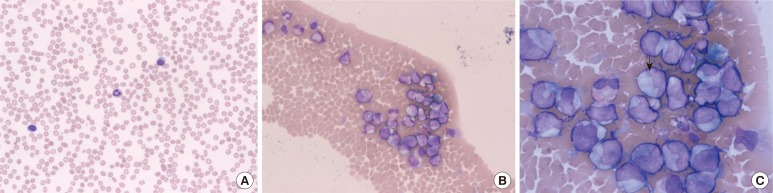
The phenomenon of varying correlations between differential counts using CytoDiff and manual counts of different cell types may be attributed to the large number of patients with leukemia in this study. Most of these patients were treated with chemotherapy; the samples were leukopenic, and the morphology of the leukocytes was distorted. As a result, manual counts could be difficult. A manual differential count is conducted in the ideal zone of a slide. However, there could be some large cells, especially after chemotherapy, distributed at the end of a slide, and that could contribute to differences between the manual count and flow cytometric count. One case of AML had a 16% manual IG count but a 54.98% CytoDiff IG count and showed numerous IGs at the end of the smear (Fig. 5). This suggests that CytoDiff counts could be more accurate than manual counts.
The CytoDiff blast counts were used separately, not the sum of 4 types of blasts (Xb, Xt, Xm, and Xn). The leukemic blasts express not only 1 cell lineage antigen but also frequently antigens of other cell lineages. Therefore, blast classification using such a small number of antibodies is not possible. However, all samples containing blasts are abnormal and would be clonal in most cases. Therefore, we do not have to add all types of blasts; rather, each type of blast count is important. The CytoDiff blast counts correlated well to the manual counts (r=0.9223). If all 4 types of blast counts were <1%, the case was regarded as a CytoDiff blast-negative case; if at least 1 type of blast count was >1%, it was regarded as a CytoDiff blast-positive case. The sensitivity of the CytoDiff blast count was 94.4%, and it was 96.0% if a 1% cutoff value of CytoDiff blast count were used along with examination of the characteristic blast population on CD45/SS plots. This is a good result, although it needs to be confirmed by experts. In the routine practice of a clinical laboratory, all results are confirmed by experts in that laboratory; therefore, it would not be a problem to view the plot and confirm the results prior to report. Using a characteristic blast population on CD45/SS along with the CytoDiff blast count provides a high specificity of CytoDiff blast counts, ranging from 91.9% to 98.4% in our study. There were no cases without blasts on manual count and ≥2% blasts on CytoDiff count. All cases with >2% blasts on CytoDiff blast count had a characteristic blast population with weak CD45 and low SS on CD45/SS plot. A case with a 12% manual blast count due to leukemic promonocytes did not show a blast population on CytoDiff blast count. Because promonocytes in acute myelomonocytic leukemia and acute monocytic leukemia as well as promyelocytes in AML with maturation should be included in the blast count, there could be differences between the manual blast count and CytoDiff blast count.
In summary, the CytoDiff method is a specific, sensitive, and rapid method for counting blasts. A cutoff value of 1% of at least 1 type of blast is recommended for positive CytoDiff blast counts.

 XML Download