

 PDF
PDF ePub
ePub Citation
 Print
Print


Hypertension is one of the most common causes of cardiovascular disease and often results from excessive sodium intake [1]. Therefore, reduced sodium intake is widely recommended for the control of hypertension [2, 3]. To evaluate daily salt intake, researchers typically employ either a diet survey using a questionnaire or direct measurement of 24 hr urine sodium excretion. Diet surveys rely on the memories of patients and are, therefore, difficult to evaluate objectively. Moreover, a professional nutritionist is required to perform the analysis. Direct measurement of sodium excretion in 24 hr urine samples is considered the most accurate method to date. However, this method is limited by the difficulty of urine collection and high error rate in specimen collection [4]. Therefore, there is a clear need to identify and validate indicators that can be used to assess salt intake in random urine samples. Possible candidates include the sodium/creatinine (Na+/Cr) ratio or the sodium/specific gravity unit (Na+/SGU) ratio, where SGU is calculated as (specific gravity-1)×100 [5]. However, sufficient verification of the accuracy of these markers as indicators of daily salt intake is required, before they can be employed in general clinical practice.
In this study, we performed a head-to-head comparison between 24 hr urine sodium excretion and the random urine Na+/Cr ratio or the random urine Na+/SGU ratio to evaluate whether random urine markers could be used as alternative markers for daily sodium intake. In addition, we analyzed the correlations between both the potassium/creatinine (K+/Cr) and potassium/SGU (K+/SGU) ratios of random urine samples and potassium excretion levels in 24 hr urine samples. The correlation between the sodium/potassium (Na+/K+) ratios of random and 24 hr urine samples was also examined [6, 7].
This study was approved by the institutional review board of Severance Hospital (No. 4-2013-0252). We analyzed leftover 24 hr and random urine assay samples, which were collected on the same day from 250 patients visiting Severance Hospital between March and May 2013. Twenty-two patient samples whose total 24 hr creatinine mass <500 mg were excluded from the study, because these samples possibly resulted from insufficient collection [8]. In addition, we also excluded 24 patients who were on diuretic medication at the time of the experiment [9]. Therefore, a total of 204 patients were evaluated. The sodium, potassium, and creatinine levels in random and 24 hr urine were measured by using an AU680 Chemistry Analyzer (Beckman Coulter, Brea, CA, USA). We used Spearman correlation analysis to evaluate the correlations between spot urine and 24 hr urine markers, and all analyses were performed by using Analyse-it software (Analyse-It Software, Leeds, UK).
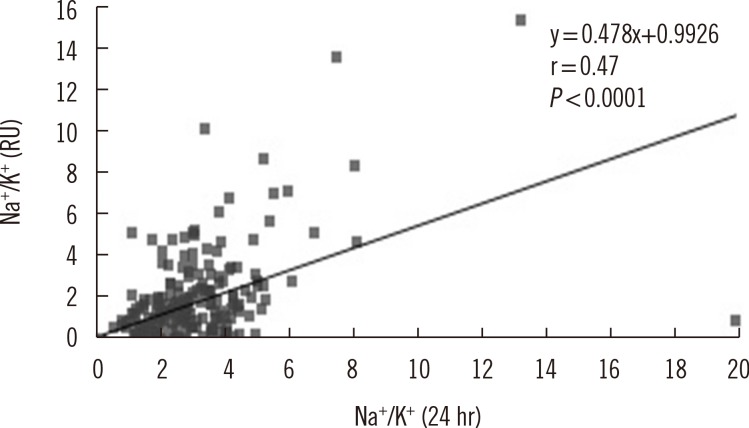
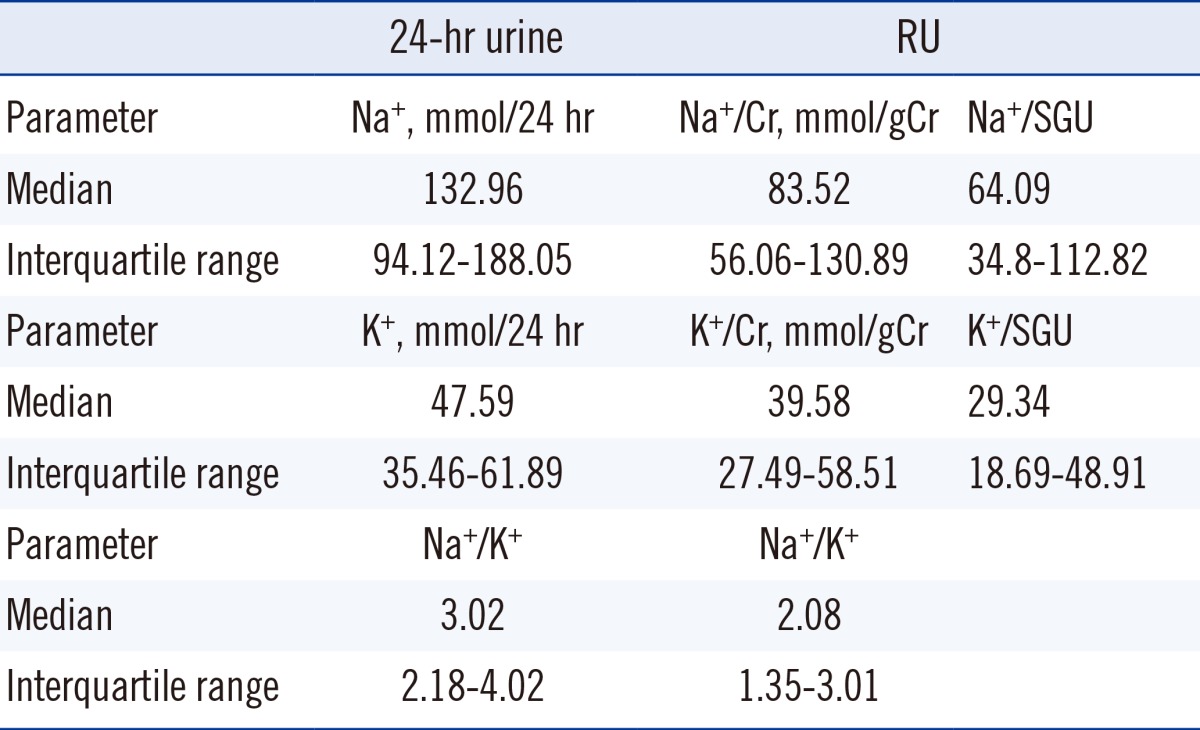
The median and interquartile ranges of measured values are presented in Table 1. We observed significant, though weak, correlations between 24 hr urine sodium excretion (mmol/day) and both the random urine Na+/Cr (mmol/gCr) (r=0.34, P<0.0001) and Na+/SGU ratios (r=0.19, P=0.0070) (Fig. 1). Similarly, we observed slightly better correlations between 24 hr urine potassium excretion (mmol/day) and both the random urine K+/Cr (mmol/gCr) (r=0.47, P<0.0001) and K+/SGU ratios (r=0.28, P<0.0001) (Fig. 1). In addition, we found that the 24 hr urine Na+/K+ ratio correlated with that of random urine samples (r=0.47, P<0.0001) (Fig. 2).
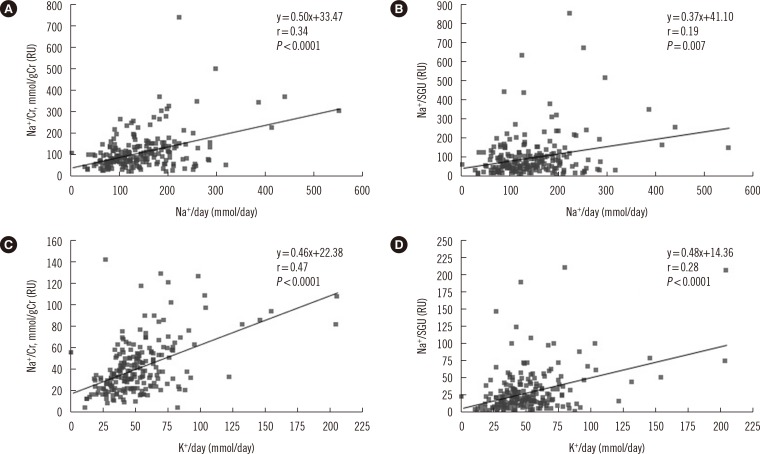 | Fig. 1Correlations between 24 hr urine sodium or potassium excretion and random urine markers. Significant correlations exist between 24 hr urine sodium excretion and both the (A) Na+/Cr ratio (r=0.34, P<0.0001) and the (B) Na+/SGU ratio (r=0.19, P=0.007), as well as between 24-hr urine potassium excretion and both the (C) random urine K+/Cr ratio (r=0.47, P<0.0001) and the (D) random urine K+/SGU ratio (r=0.28, P<0.0001).
Abbreviations: RU, random urine; Na+/Cr, sodium/creatinine ratio; K+/Cr, potassium/creatinine ratio; r, spearman's rank correlation coefficient; SGU, specific gravity unit, SGU is calculated as "(specific gravity-1)×100".
|
Although some studies have reported that the Na+/Cr ratio is correlated to blood pressure [10, 11, 12, 13], few studies have shown head-to-head comparisons between 24 hr sodium excretion and spot urine sample markers. Mann and Gerber reported that 24 hr sodium excretion could be predicted either from the spot urine Na+/Cr ratio (r=0.67, n=45, P<0.01) or from the spot urine Na+ (mEq/L)/Cr (mg/L) ratio and 24 hr creatinine excretion (mg) (r=0.86, n=45, P<0.01) [9]. Tanaka et al. [14] reported a correlation between measured 24 hr urine sodium or potassium excretion and expected 24 hr urine sodium or potassium excretion, which could be calculated by using spot urine sodium or potassium, age, body weight, and height. The expected 24 hr urine sodium or potassium were calculated by using the following formulae: 21.98×[Na+ (mEq/L)/Cr (mg/L)× (-2.04×age+14.89×body weight (kg)+16.14×height (cm) -2,244.45)]0.392 for sodium, and 7.59×[K+ (mEq/L)/Cr (mg/L)× (-2.04×age+14.89×body weight (kg)+16.14×height (cm)-2,244.45)]0.431 for potassium. The correlation coefficient between measured value and expected value was 0.53 for sodium and 0.54 for potassium. In addition, Kawano et al. [4] reported that the correlation coefficient between use of a questionnaire and 24 hr urinary sodium excretion for 467 outpatients was 0.35, which was similar to our result. The Working Group for Dietary Salt Reduction of the Japanese Society of Hypertension (JSH) proposed guidelines for the evaluation of salt intake for the management of hypertension [4]. The guidelines stated that salt intake could be estimated from random urine Na+/Cr ratios in general medical facilities, as it is easy and practical to assess. However, such estimates have shown limited reliability.
Our study provides evidence that weak but significant correlations exist between both 24 hr sodium and potassium excretion levels and spot urine sample levels, and, in turn, supports the use of spot urine markers as possible alternative markers to monitor daily sodium intake or potassium intake. However, our study had a few limitations. One of these was that our correlation coefficients for the results were relatively low. In a previous study regarding the correlation between 24 hr albumin excretion and the spot urine albumin/Cr ratio, the correlation coefficient was 0.81 (n=2579, P<0.001) [15]. The relatively weak correlation we observe using electrolytes may be due to a larger intra-individual biological variation of urine electrolytes compared to that of albumin [16]. Second, owing to circadian variation of sodium and potassium, late morning urine specimens or early evening urine specimens would generally be recommended for evaluation of spot urine biomarkers [9, 17]. However, because our study was a retrospective one, controlling the timing of random urine collection was not possible. Finally, of the 204 patients enrolled in this study, 120 (58.8%) had undergone kidney transplant surgery, and another 32 (15.7%) had chronic kidney disease, and these kidney disorders are known to significantly affect sodium, potassium, and creatinine excretion levels in the urine. For this reason, the Na+/Cr and K+/Cr ratio results were significantly different from nationally representative results reported by the Korean National Health and Nutrition Examination Survey [18], which included only small fractionof patients with chronic kidney disease.
Our results show that significant correlations exist between the markers of daily sodium and potassium intake in random urine samples and those from 24 hr urine samples. However, further study is required to effectively utilize these random urine markers for clinical monitoring. Furthermore, the threshold salt levels required to prevent hypertension need to be determined in order to help patients effectively track their daily sodium and potassium intake. A simple and objective test could motivate patients to reduce their salt intake and increase their potassium intake. Therefore, daily sodium and potassium intake monitoring within random urine samples could help patients improve their dietary habits and decrease their blood pressure.
 XML Download