

 PDF
PDF ePub
ePub Citation
 Print
Print


INTRODUCTION
Discovery of the release of growth factors from platelets has triggered an interest in using platelet-rich plasma (PRP) for wound healing and tissue regeneration [1-4]. Recently, platelet lysates (PL) derived from PRP have been studied for their potential advantages as a replacement for using fetal bovine serum (FBS) in cell cultures [5-11]. Studies have shown that cells cultured in the presence of FBS or fetal calf serum (FCS), when injected into the human body, produce an immune response due to the animal nature of the sera used for cultures [12]. In addition, FBS could potentially contain prions, and therefore may potentially transmit infectious diseases from animals. Platelet concentrates (PC) have the advantage of being relatively inexpensive since they are by-products of blood preparation.
Most of the studies on using PL as an FBS replacement were focused on in vitro culture and expansion of transplantable mesenchymal stromal cells for cell therapy [5-10]. PLs have also been used for culturing adipose tissue-derived stem cells, fibroblasts, and osteoblasts [13-15]. However, there are no standards for the PL used during cell cultivation, and each research has different methods of usage and production of PRP. Accordingly, it is difficult to find the best way to prepare PL in the laboratory. As the methods of producing PL involving the release of growth factors from platelet granules, PRP is activated either by adding the platelet agonists of thrombin and calcium chloride, or by repeating the freeze-thaw (FT) process. Although the former method is more effective to secrete granule from platelets than the latter method, the latter method is cost-effective, and the lysate can be conveniently stored. PL is also safe for use in humans since it is free from animal products. Although PL has been used for culturing diverse cell types, including adult stem cells, a lack of standard protocols for preparing PL has prevented its widespread use as a replacement for animal sera [5-10, 16]. Therefore, we sought to optimize the conditions for preparing PL as a substitute for FBS in cell culture.
Go to : 
METHODS
1. Preparation of platelet lysates
The study protocol was approved by the institutional review board of the Hanmaum Blood Center. PC that were discarded due to high ALT levels (>65 IU/L) were obtained from the Hanmaum Blood Center.
The PC were prepared from whole blood by double centrifugation with citrate phosphate dextrose adenine-1 (CPDA-1; GCMS, Yongin, Korea) as an anticoagulant. PL was prepared by using the methods reported by Schallmoser et al. [5] and Lim et al. [17] with minor modifications. To eliminate the specific effect of individual PC in each experiment, three to fourteen concentrates of identical ABO blood types generated by pooling were used. The PC were prepared within two days of collecting blood and were stored in a platelet agitator at 22℃. After thoroughly mixing the pooled concentrates, platelet and white blood cell (WBC) counts were measured using an LH analyzer (Beckman Coulter, Fullerton, CA, USA). The pooled concentrates were then centrifuged at 2,500 g for 10 min at room temperature, the supernatant (platelet-poor plasma, PPP) was removed, and the final platelet counts were set at 1×10¹²/L and 2×10¹²/L, respectively. Three milliliters of each PPP was inoculated into Bactec PEDS PLUS (BD; Baltimore, MD, USA), and was analyzed for bacterial contamination for 5 days. Cell culture media and culture supernatants (spent media) were tested for Mycoplasma pneumonia by PCR with a commercial kit (Seegene; Seoul, Korea) following the manufacturer's instructions. Two sets of each of the pooled PPP and PRP with adjusted platelet counts were stored at -70℃ for less than one month for duplicate experiments. For preparing PL, frozen PRP was first left at room temperature for 10 min. Then, PRP was incubated at 37℃ for two hours in a water bath. The resulting lysate was centrifuged at 4,000 g for 15 min to remove platelet fragments, and the supernatant was filtered through a 0.22-µm filter. Heparin solution (0.002 U/L) (Sigma-Aldrich; St. Louis, MO, USA) was added to the supernatant before cell culture to prevent gel formation resulting from platelet activation.
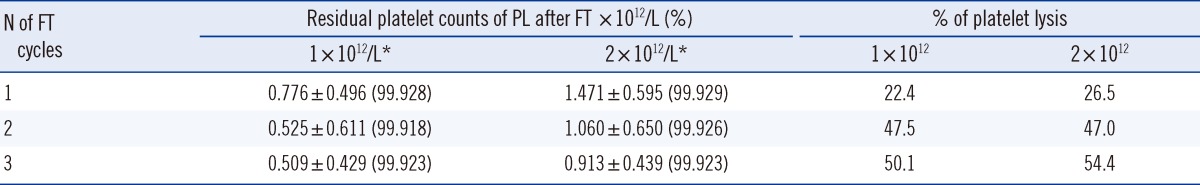
The number of FT cycles was set to vary from 1 to 3. Platelet and WBC of thawed PL were counted to determine the extent of lysis caused by FT cycles. Lysed platelet counts were calculated by subtracting the platelet counts after FT from the basic platelet counts before FT. Platelet lysis was expressed as a percentage of the lysed platelets to the basic platelet count.
2. HaCaT cell culture
The human immortal keratinocyte cell line, HaCaT, was cultured in DMEM (Lonza; Walkersville, MD, USA) supplemented with 10% FBS and 2 mM L-glutamine in a humidified incubator at 37℃ and 5% CO2. In cultures using media supplemented with PL, the final concentration was adjusted to 5% or 10%. In the PL groups, cells were plated at a density of 2×10⁸ cells/L in a 35-mm dish using serum-free DMEM. PLs that had been subjected to 1, 2, or 3 FT cycles were used for cell culture. Cells were passaged using 5% PL that had undergone one repetition of FT; cells were plated at a density of 2×10⁸ cells/L to reach 70% to 80% confluence in two days.
3. Measurement of HaCaT cell proliferation
The HaCaT cell proliferation rate was estimated by using Cell Counting Kit-8 (CCK-8; Dojindo Laboratories, Kumamoto, Japan) following the manufacturer's instructions. Optical density (OD) at 450 nm (formation of formazan) was measured using VERSA Max microplate reader (MDS Analytical Technologies; Sunnyvale, CA, USA) with SoftMaxPro software. Cell counts were indirectly estimated from a standard curve generated using solutions of known cell counts: 0, 1×10⁴, 1×10⁵, 5×10⁵, and 1×10⁶ cells per well. The CCK-8 ratio of HaCaT cells according to the passage number was defined as the ratio of OD450 in 5% PL at 1×10¹²/L to that in 5% FBS.
4. Concentration of growth factors
Concentrations of transforming growth factor-alpha (TGF-α), vascular endothelial growth factor (VEGF), platelet-derived growth factor-AB/BB (PDGF-AB/BB), PDGF-AA, and epidermal growth factor (EGF) present in PL supernatants corresponding to cell densities of 1×10¹²/L and 2×10¹²/L prepared by using 1, 2, or 3 FT cycles of PC were measured. FBS and three PPPs that had each been subjected to 1, 2, or 3 FT cycles were used as the controls. Concentrations of growth factors were determined using human growth factor/Chemokine Panel I reagent (Millipore Co., Billerica, MA, USA) and Luminex 200 system (Luminex Co., Austin, TX, USA).
5. Statistical Analysis
Statistical analysis was performed using Microsoft Excel 2007 (Microsoft, Redmond, WA, USA) and SPSS 12.0 for Windows (SPSS Inc., Chicago, IL, USA). Experiments were conducted in duplicate and the data were expressed as the average with standard deviations. P<0.05 was considered statistically significant.
The normal distribution of data was confirmed by using the One-Sample Kolmogorov-Smirnov test. Although the number of PL samples was small, parametric statistics were used to enforce statistical power. The storage time of PC belonging to each blood type was analyzed using ANOVA with Tukey HSD as a post-hoc multiple comparison test. The effect of FT cycles on the individual PL samples was analyzed by using repeated measures ANOVA. A paired Student t-test was conducted to determine the difference between the 1×10¹²/L PL and 2×10¹²/L PL groups, as well as the difference between the 5% PL and 10% PL groups for the same PL samples. The independent Student t-test was used to determine the difference between the PPP and PL groups. Pearson's correlations were used in the correlation analysis of the concentration of growth factors and HaCaT cells.
Go to :
RESULTS
There were three blood groups in the pooled PL samples: 10 units of blood type A, 14 units of blood type B, and 3 units of blood type O. The average time spent between whole blood collection at the blood center and the preparation of PLs before freezing was 44.6 hr. There was no significant difference in this parameter among the three pooled PL samples (43.9 hr for blood type A, 46.1 hr for blood type B, and 42.1 hr for blood type O). The average WBC count in the 2×10¹²/L PL group was 0.26×10⁹/L. This count was significantly higher than that of the 1×10¹²/L PL group (0.14×10⁹/L) (P=0.013). There was no significant difference in the WBC count in relation to the frequency of FT (1, 2, or 3 cycles). The blood samples were negative for M. pneumoniae and bacterial growth for five days of culture.
1. Effects of FT cycles on platelet counts
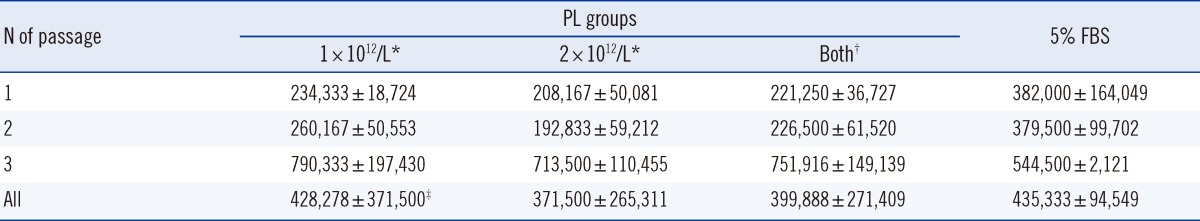
Compared to the counts before FT, 25% of the platelets were lysed after one FT cycle, 47% were lysed after two cycles, and 53% were lysed after three cycles. The difference in residual platelet counts in PLs prepared by varying the number of FT cycles was statistically significant (P<0.001) (Table 1).
2. Effects of varying the numbers of FT cycles and different PL concentrations on HaCaT cell proliferation
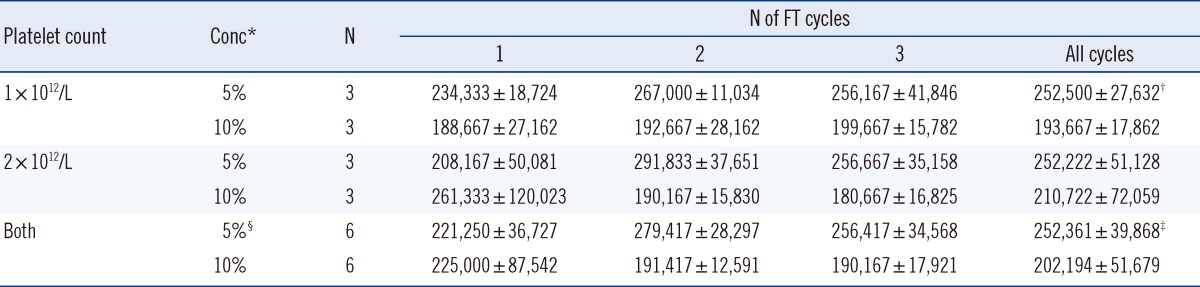
Only the 5% PL group showed a significant difference in HaCaT cell proliferation with respect to the change in the number of FT cycles (P=0.037). There was no significant difference in HaCaT cell proliferation between the 1×10¹²/L PL and 2×10¹²/L PL groups. However, the mean HaCaT cell count per well in the 5% PL group (252,361 cells/well) was significantly higher than that in the 10% PL group (202,194 cells/well) (P=0.003), and this difference was more pronounced in the 1×10¹²/L PL group (P<0.001) (Table 2). The HaCaT cell count in media supplemented with 5% or 10% FBS was approximately 360,000 cells/well and 470,000 cells/well, respectively. Thus, HaCaT cells proliferated at a much slower rate in PL-supplemented media than in media containing FBS.
3. Effect of passaging on HaCaT cell proliferation
The difference between the observed rates of proliferation of HaCaT cells cultured in PL- or FBS-supplemented media became more pronounced as the passage number increased (Fig. 1). The CCK-8 ratios were 0.88-1.02 for the first passage, 0.48-1.15 for the second, and 0.47-1.0 for the third. There were no obvious morphological differences between HaCaT cells cultured in 5% FBS and 5% PL or between cells from different passages (Fig. 2).
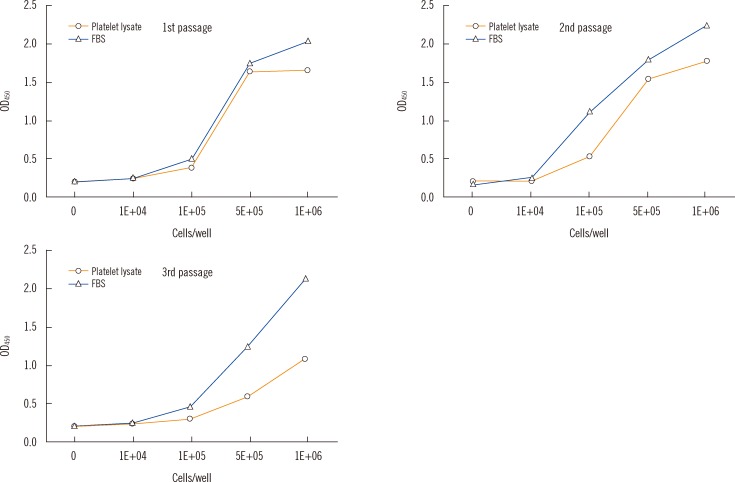 | Fig. 1Standard curves of Cell Counting Kit-8 (CCK-8; Dojindo Laboratories, Kumamoto, Japan) for HaCaT cell proliferation according to the frequency of passage in the 5% PL and 5% FBS groups. Optical density (OD) means the amount of formazan dye generated by the activity of dehydrogenases in living cells.
Abbreviation: FBS, fetal bovine serum.
|
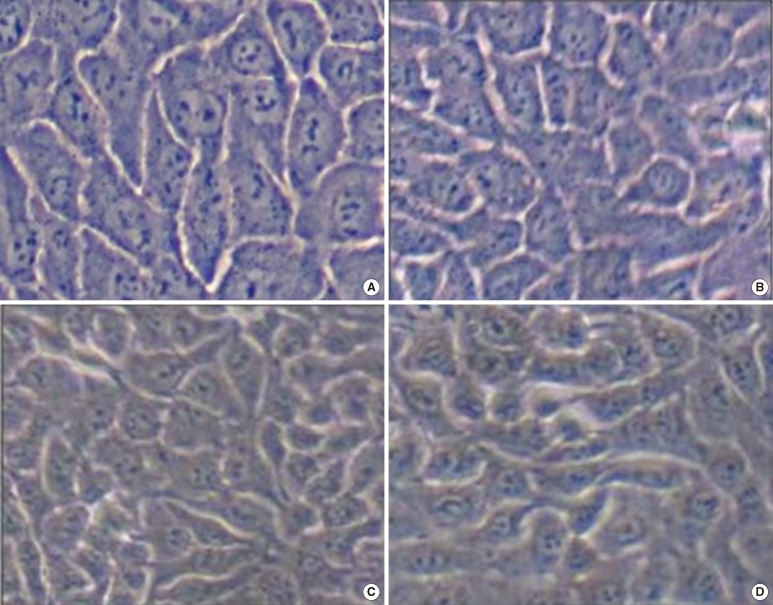 | Fig. 2HaCaT cell morphology according to the frequency of passage. There were no obvious morphological differences between HaCaT cells cultured in 5% fetal bovine serum (FBS) and 5% platelet lysate (PL) or between cells from different passages; (A) The first passage of 5% FBS. (B) The first passage of 5% PL with 1×10⁹/mL. (C) The third passage of 5% FBS. (D) The third passage of 5% PL with 1×10⁹/mL.
|
Within any group, the HaCaT cell proliferation rate changed significantly with increasing passage (P=0.005 for 1×10¹²/L PL; P=0.002 for 2×10¹²/L PL; P<0.001 for both). In particular, the HaCaT cell count after three passages was higher than that estimated after one and two passages, and the counts were also higher than that of the 5% FBS group (n=6; Table 3). The average HaCaT cell count of the 5% PL group was significantly higher in the 1×10¹² cells/L treatment than that in the 2×10¹² cells/L treatment (P=0.01), irrespective of the passage frequency.
4. Concentrations of growth factors
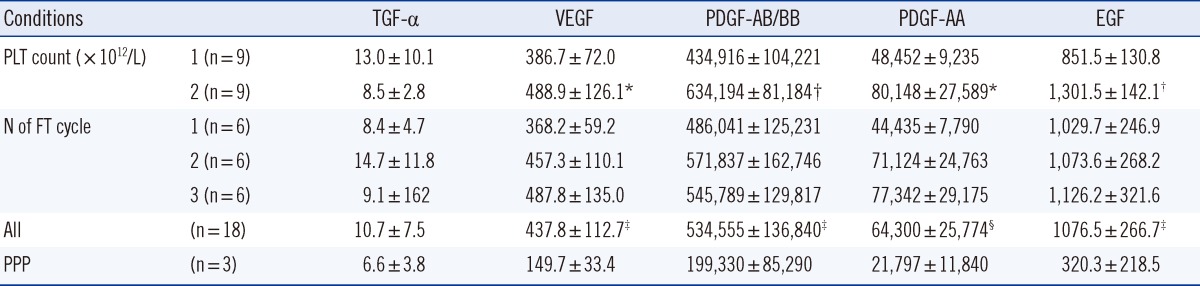
Among the growth factors analyzed, only TGF-α (3.4±1.9 mg/L, n=3) was detected in FBS. The concentrations of VEGF (P<0.001), PDGF-AB/BB (P<0.001), PDGF-AA (P=0.01), and EGF (P<0.001) in PL were significantly higher than those found in PPP. The concentrations of VEGF (P<0.001), PDGF-AB/BB (P<0.001), PDGF-AA (P=0.01), and EGF (P<0.001) in the 2×10¹² cells/L PL group were significantly higher than those in the 1×10¹² cells/L PL group (Table 4). The concentrations of VEGF (P=0.002), PDGF-AA (P=0.001), and EGF (P=0.049) positively correlated with the number of FT cycles. However, only the VEGF (r=0.485, P=0.04) and PDGF-AA (r=0.470, P=0.048) concentrations were positively correlated with the HaCaT cell count (Fig. 3).
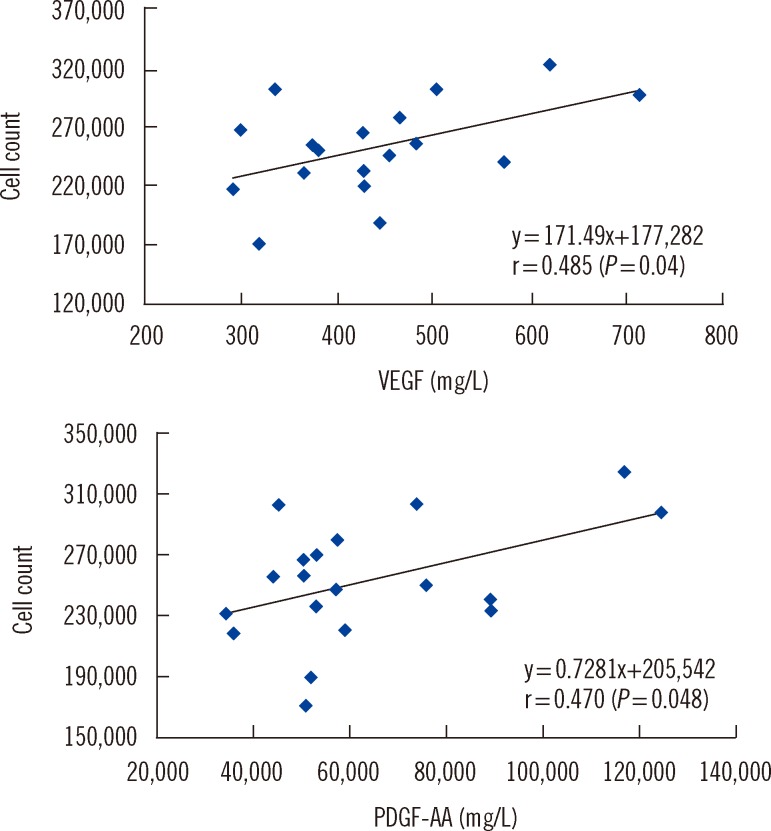 | Fig. 3Pearson's correlations between HaCaT cell count and vascular endothelial growth factor (VEGF) or platelet-derive growth factor-AA (PDGF-AA).
|
Table 4
Relationship among the growth factor concentration (mg/L), the platelet count, and the number of freeze-thaw (FT) cycles in platelet lysate, platelet-poor plasma (PPP)
*P<0.01 and †P<0.001 vs. 1×10¹²/L by paired t test; ‡P<0.001 or §P=0.01 vs. PPP by independent t-test; the concentrations of VEGF (P=0.002), PDGF-AA (P=0.001), and EGF (P=0.049) showed significant differences at different numbers of FT cycles.
Abbreviations: PLT, platelet; TGF-α, transforming growth factor alpha; VEGF, vascular endothelial growth factor; PDGF, platelet-derived growth factor-AB/BB; PDGF, platelet-derived growth factor-AA; EGF, epidermal growth factor.
![]()
There were significant correlations among the concentrations of growth factors: VEGF and PDGF-AB/BB (r=0.582, P=0.011), VEGF and PDGF-AA (r=0.841, P<0.001), PDGF-AB/BB and PDGF-AA (r=0.675, P=0.002), PDGF-AA and EGF (r=0.588, P=0.011), and PDGF-AB/BB and EGF (r=0.778, P<0.001).
Go to :
DISCUSSION
PC contain high levels of growth factors, including PDGF, TGF, insulin like growth factor (IGF), EGF, and VEGF [4]. In our study, PLs were analyzed for the presence of five growth factors. The results revealed that only the VEGF and PDGF-AA concentrations were correlated with HaCaT cell proliferation. Positive correlations between VEGF levels, endothelial cell division, and bone formation have been reported previously [16]. Therefore, conditions that can increase the concentrations of VEGF and PDGF-AA in media supplements may augment the rate of HaCaT cell proliferation.
The concentrations of VEGF, PDGF-AB/BB, PDGF-AA, and EGF were higher in PL than in PPP. Furthermore, their concentrations were higher in the 2×10¹² cells/L PL than in the 1×10¹² cells/L PL. This finding indicates that a higher platelets cell density increases the concentration of VEGF and PDGF-AA in PL. Repeated FT induces the degranulation of platelet granules, thereby releasing VEGF, PDGF-AA, and EGF. Therefore, it was expected that an increase in the number of FT cycles could result in elevated concentrations of VEGF and PDGF-AA in PL. However, previous studies have shown that PL prepared from PCs with a higher platelet count was not necessarily more effective with respect to cell proliferation [8, 18]. Furthermore, this report showed that HaCaT cell proliferation did not vary with platelet count or the number of FT cycles employed for preparing PL (Table 2). In contrast, as shown in Table 3, we observed higher HaCaT cell counts in the 1×10¹² cells/L PL group than in the 2×10¹² cells/L PL group for all passages. In addition, HaCaT cell proliferation in the 5% PL group was faster than that in the 10% PL group. Therefore, our results demonstrate that the concentrations of PL and growth factors in culture media determine the rate of cell proliferation.
Previous studies have shown that that 10% PL is more favorable for cell culture than 5% PL [19, 20]. However, the platelet counts used in these studies, respectively 1×10¹¹ cells/L [19] and 3×10⁹/L [20], were lower than that used in our experiments (1×10¹² cells/L). Kakudo et al. [13] found that adipose tissue-derived stem cells and human dermal fibroblasts proliferated at a higher rate in the presence of 5% activated PRP (aPRP) than in 1% aPRP. Consistent with our findings, the authors reported that the cell proliferation rate declined when aPRP (platelet cell density=1.3×10¹² cells/L) concentrations in cultures were increased to 10% and 20% [13]. Another study found that the rate of cell proliferation was higher in 1.5×10¹² cells/L than in 1×10¹² cells/L when 5% PL was used [8]. However, this study found no differences between the cell proliferation rates at 5% and 10% PL (prepared from PC with a cell density of 2×10¹² cells/L). Together with these reports, our results reveal that when the platelet concentration is lower than 1×10¹² cells/L, cells tend to proliferate faster in 10% PL than in 5% PL. However, when the platelet concentration is greater than 1×10¹² cells/L, a reverse trend in cell proliferation is observed. Consistent with our results, Doucet et al. [10], who used 1×10¹² cells/L PL, selected 5% PL for mesenchymal stem cell cultures.
Since the cell proliferation rate was highest in 5% PL prepared by using two FT cycles from concentrates with a platelet count of 1×10¹² cells/L, we conclude that under these conditions, PL serves as an effective substitute for FBS for cell cultures.
PL was reported to be more suitable for increasing cell count than FBS or FCS in bone marrow mesenchymal stem cell cultures [5, 6, 10, 19]. However, we found that proliferation of HaCaT cells belonging to the first passage was lower in PL than in media supplemented with similar concentrations of FBS. However, cells in the third passage proliferated faster in 5% PL than in 5% FBS. One study found that only human dermal fibroblasts exhibited comparable growth characteristics in the presence of FBS and serum derived from PRP, and that the proliferation of human adipose tissue stem cells was lower in PRP-derived sera than in FBS [20]. Mazzocca et al. [18] also reported that different methods for PRP separations are needed for effective proliferation of different kinds of cells, such as human muscle, bone, and tendon cells. These results demonstrated that the effect of PL on cell proliferation was cell type specific.
The method we used for the assessment of cell proliferation rate assumes that cellular dehydrogenase activity is proportional to the number of cells in cultures. This leads to the possibility that a change in the metabolic status of cell type under investigation, induced by factors present in PL or FBS, could affect the estimated rate of cell proliferation.
Various studies have used thrombin, calcium chloride [14, 21], hypotonic solution, or other platelet agonists for preparing PL. The method for preparing PL reported here is simple, economic, and safe, since only the FT process was employed for the release of growth factors from platelets. In our study, platelets were pooled and counts were set at 1×10¹²/L and 2×10¹²/L prior to freezing, thus enabling accurate assessment of the effects of platelet counts. Since platelets were frozen before counting, such an accurate assessment could not be made in previous studies [5-7].
This study has several limitations. First, we used only HaCaT cells for testing PL. Therefore it is not known whether these results can be extended to other cell types. Second, since WBC filters were not used for preparing the PRP, there was an average of 0.14×10⁹/L (0.26×10⁹/L) WBC in the 1×10¹²/L (2×10¹²/L) PL. Therefore, the differences between the two PL groups may have originated not only from the platelet counts but also from the WBC counts. In addition, WBC may exert a powerful influence on the release of growth factors, particularly TGF-β1 [22].
In summary, the concentrations of VEGF, PDGF-AA and EGF in PL tended to increase as platelet counts and number of FT cycles increased. However, only VEGF and PDGF-AA concentrations were correlated with HaCaT cell proliferation. There was no significant difference in the HaCaT cell proliferation between 1×10¹²/L PL and 2×10¹²/L PL, but the proliferation was greater in the 5% PL group than in the 10% PL group. Cell proliferation rate was the highest in PL that underwent two FT cycles, and we considered this condition the most favorable for preparation of PL to be used as FBS replacement in cell culture media.
Go to :
 XML Download