

 PDF
PDF ePub
ePub Citation
 Print
Print


Customer satisfaction with clinical laboratory services is one of the most important quality indicators in laboratory medicine. Measuring and improving customer satisfaction with clinical laboratory services are essential aspects of laboratory medicine management [1].
There are two major agencies that give accreditation to clinical laboratories, namely, the Joint Commission on Accreditation of Healthcare Organizations and the College of American Pathologists (CAP). The Joint Commission on Accreditation of Healthcare Organizations requires data to be collected on the needs, expectations, and satisfaction of individuals and organizations [2]. The CAP also requires that physician and patient satisfaction with laboratory services being measured every 2 yr [3].
In this study, we designed a study procedure, defined a study population, and developed a questionnaire for customer satisfaction survey at a tertiary care unit level to evaluate our clinical laboratory and phlebotomy services. We will share our findings regarding customer satisfaction surveys for clinical laboratory and phlebotomy services.
Satisfaction surveys for clinical laboratory and phlebotomy services were conducted at the department of laboratory medicine of Pusan National University Hospital from January to June 2012. Board members of department of our clinical laboratory medicine designed two kinds of customer satisfaction surveys with the help of marketing research specialists after referring to a published survey tool from the CAP Q-Probes program [4]. One was a satisfaction survey for clinical laboratory services with physicians and nurses, and the other was a satisfaction survey for phlebotomy services with outpatients.
We randomly selected 370 physicians and 125 nurses from 25 clinics at Pusan National University Hospital. We also randomly selected 347 outpatients who received phlebotomy services after visiting one of the 25 clinics. We excluded pediatric and adolescent patients (<20 yr) as well as psychiatric patients.
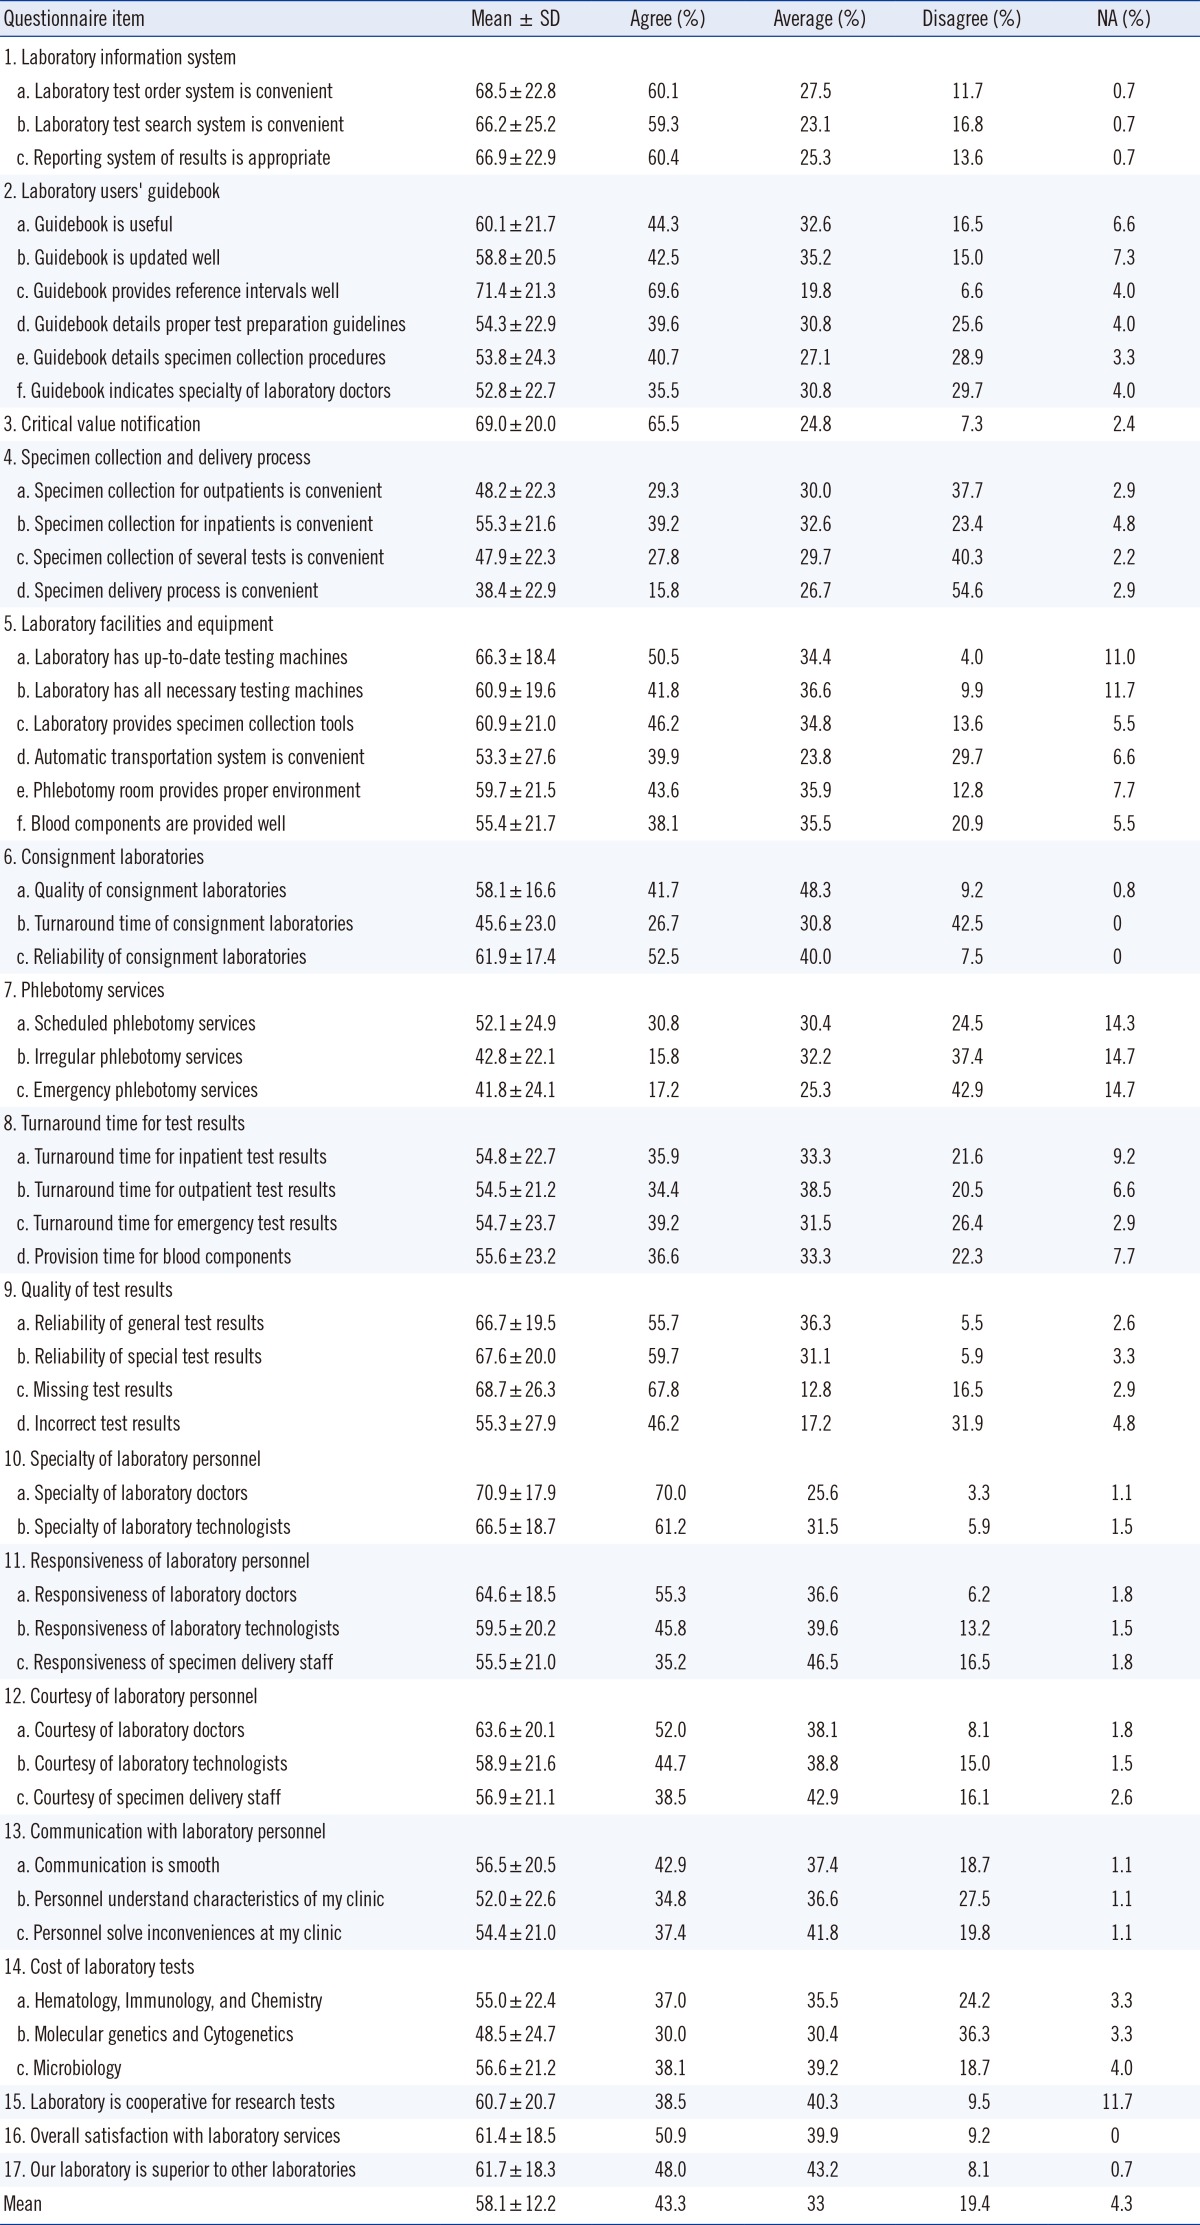
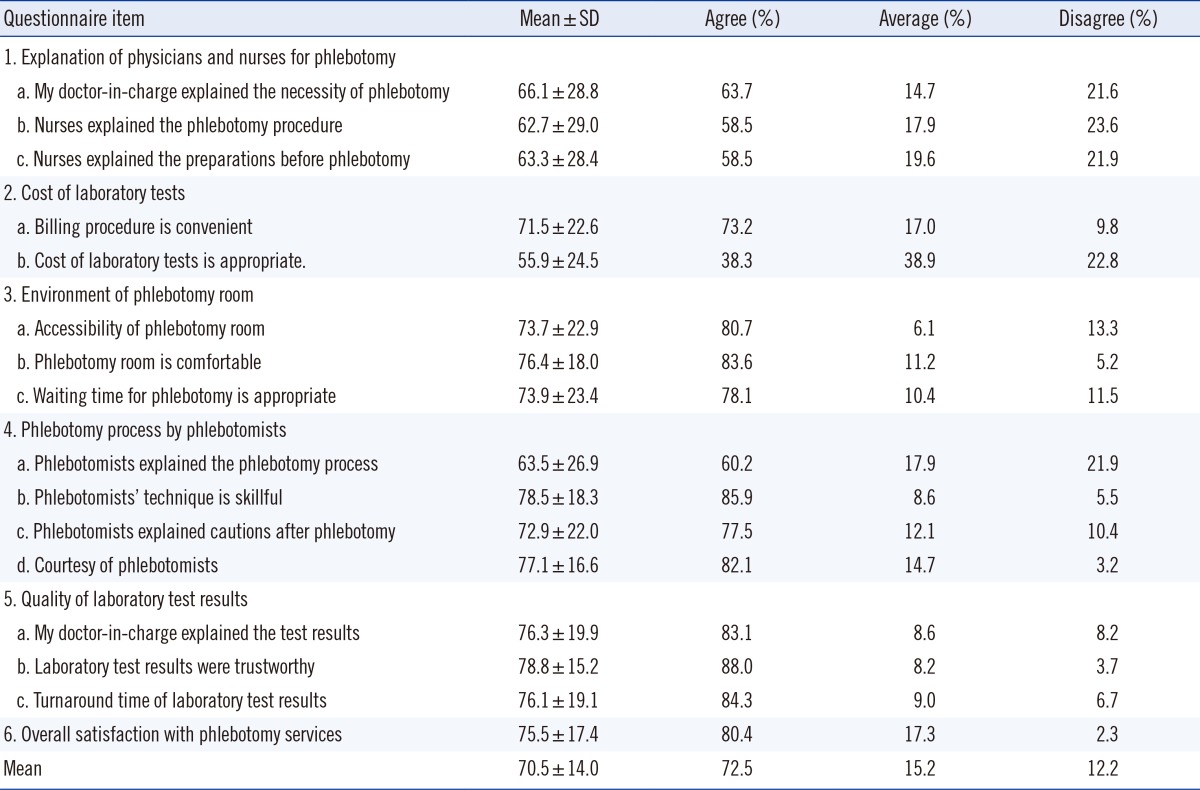
The clinical laboratory services questionnaire for physicians and nurses consisted of 17 categories and 51 statements covering a comprehensive range of clinical laboratory services (Table 1). The phlebotomy service questionnaire for outpatients consisted of six categories with 16 statements covering a comprehensive range of phlebotomy services as (Table 2). We developed these questionnaires using a 7-point Likert scale to prevent respondents' scores from clustering near the average.
We sent online questionnaires to 370 physicians by e-mail. They responded to the questionnaire by linking to a uniform resource locator. We sent paper questionnaires to 125 nurses. They responded to the questionnaire by writing directly on the paper. We performed a satisfaction survey for phlebotomy services using computer-aided interviews with outpatients who had received phlebotomy services. We conducted face-to-face interviews with every tenth patient per hour for 5 days. They responded to the computer-based web questionnaire using a 7-point Likert scale.
All data were analyzed by using SPSS 13.0 (SPSS Inc., Chicago, IL, USA). Responses were given numerical ratings from 0 to 100 as follows: 0, strongly disagree; 16.6, disagree; 33.3, slightly disagree; 50, average; 66.6, slightly agree; 83.3, agree; and 100, strongly agree. Results were analyzed by using a t-test for two-group analyses and a one-way ANOVA for more than three groups. A P value <0.05 was considered statistically significant.
The total number of respondents was 273. Of 370 physicians, 151 (40.8%) returned their responses to the online questionnaire. Of 125 nurses, 122 (97.6%) returned their responses by paper questionnaire. The overall response rate for physicians and nurses was 55.2%.
Physician and nurse satisfaction scores and the percentage distributions for each questionnaire are shown in Table 1. The overall mean satisfaction score was 58.1 (range, 38.4-71.4) out of 100. Among all questionnaire items, providing reference intervals and specialties of the laboratory doctors had means of >70. Specimen collection and the delivery process, turnaround time for consignment tests, phlebotomy services, and cost of genetic tests had means <50. The >50-yr age group had a significantly higher mean score than that of other age groups using multiple comparison analysis among the 20-, 30-, 40-, and >50-yr age group (P=0.0001). The nurse group had a significantly higher score than the physician group (P=0.021). The direct or group had a significantly higher score than the other physician groups (P=0.0058). Respondents with >20 yr of employment at the hospital had significantly higher scores than those with <20 yr of experience (P=0.0312).
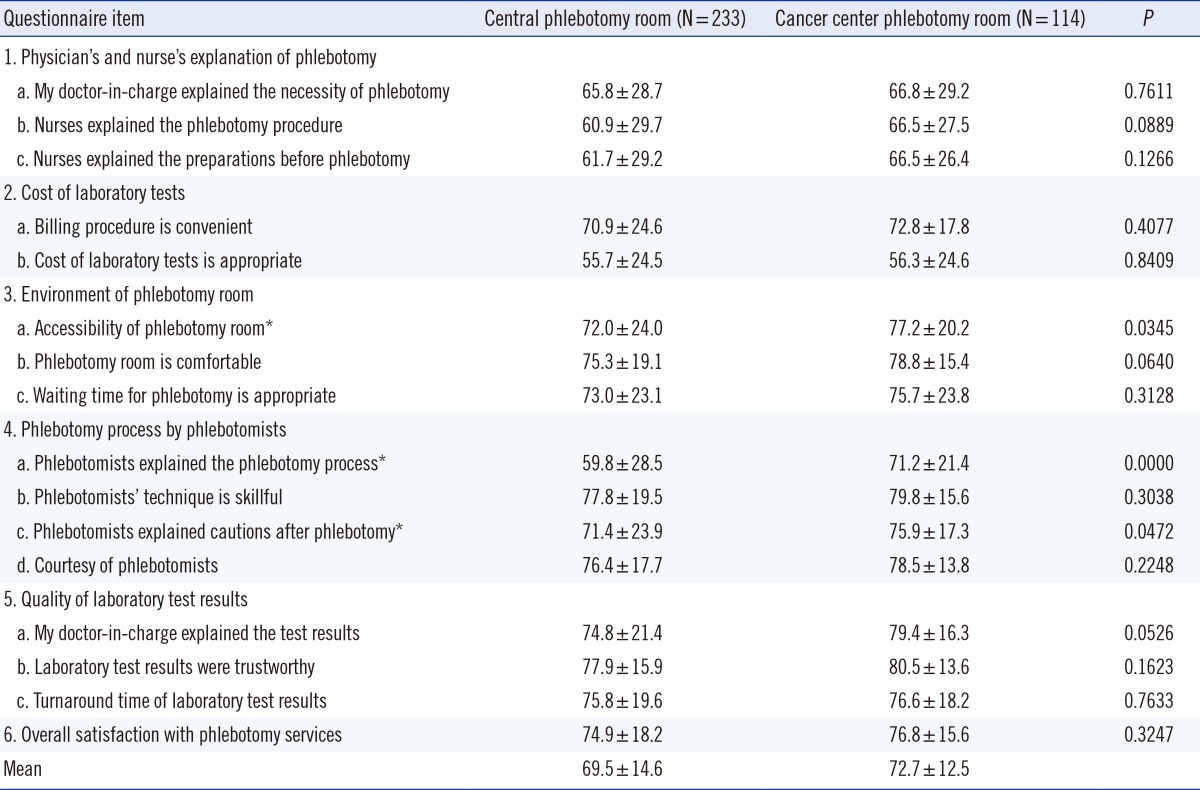
There were 347 total outpatient respondents; 233 were interviewed in the central phlebotomy room and 114 in the cancer center phlebotomy room. The overall mean satisfaction score was 70.5 (range, 55.9-78.8). The means and SDs of the overall satisfaction scores for each questionnaire item are presented in Table 2. Among all questionnaire items, the phlebotomist's technique and reliability of the test results received the highest score, whereas the costs of laboratory tests received the lowest score. Scores for the cancer center phlebotomy room regarding accessibility of the phlebotomy room, the phlebotomist's explanation of the phlebotomy process, and cautions after phlebotomy were significantly higher than the satisfaction scores for the central phlebotomy room (Table 3).
The importance of customer satisfaction in driving quality improvement has been increasing in laboratory medicine. Patients are the ultimate customers of laboratory medicine, but physicians and nurses are considered preferred internal customers. Therefore, their opinions are essential to improve laboratory management [4].
In 1999, 2002, and 2007, CAP Q-Probes studies at multiple institutions performed satisfaction surveys for laboratory services with physicians [4,5,6]. Participating institutions provided their survey results rated on a scale of 1 (poor) to 5 (excellent). The mean overall satisfaction scores for all institutions were 4.0 (range, 3.1-4.7), 4.0 (range, 3.0-4.6), and 4.1 (range, 2.9-5.0), respectively. In 2004, CAP Q-Probes studies at multiple institutions performed a satisfaction survey for laboratory services with nurses [7]. The mean overall satisfaction score for all institutions was 3.9 (range, 2.5-4.6). In 1990, 1994, and 1995, CAP Q-Probes studies at multiple institutions performed patient satisfaction surveys regarding phlebotomy services [8,9,10]. The mean overall satisfaction scores for all institutions were 98.6, 99.2, and 98.9 out of 100, respectively.
The mean satisfaction score in our study was lower than that of the CAP Q-Probes study, but it was within range of its participating institutions. We detected several dissatisfactions with our laboratory and phlebotomy services using these surveys.
First, physicians and nurses were most dissatisfied with the specimen collection and delivery process. The specimen rejection rates reported in the CAP Q-Probes studies were 0.45% for complete blood cell count specimens in 1995, and 0.35% for chemistry specimens in 1997 and 0.3% in 2002 [11,12,13]. In all three studies, hemolysis, clotting, and insufficient specimen quantity were the most common reasons for specimen rejection. In our study, satisfaction scores from unskilled or training physicians and nurses were lower than those from trained physicians and nurses. We should provide a regularly updated laboratory user's guidebook and a laboratory information searching system regarding the specimen collection and delivery process.
Second, physicians and nurses were dissatisfied with phlebotomy services. In our hospital, phlebotomists only work as regular-scheduled phlebotomists and do not serve emergency phlebotomies. In 2006, Oja et al. [14] reported that re-scheduling phlebotomy rounds resulted in a very significant increase in customer satisfaction rate. Thus, we have a plan to re-schedule and modify phlebotomy services to employ more phlebotomists or nurses for phlebotomy and to educate interns and nurses about appropriate phlebotomy techniques.
Third, molecular genetic and cytogenetic tests were more expensive than other tests. In our study, approximately 55% of physicians responded that they restricted their orders for molecular genetic and cytogenetic tests because of high costs. The lowest outpatient satisfaction item was also laboratory costs. In 1994, Lee's study [15] showed that the high cost of laboratory tests was one of the most significant negative factors for patient satisfaction.
This study has two limitations. First, we did not use open-ended questions. Second, we did not collect data about patient waiting time, number of needle sticks, or bruise size in our phlebotomy service survey.
However, this study describes the first survey that provides a survey procedure and questionnaire items to assess customer satisfaction with clinical laboratory and phlebotomy services at a tertiary care unit level. We will make an effort to reduce the dissatisfactions in our laboratory and phlebotomy services by taking corrective actions. Our laboratory will continue the customer satisfaction surveys to meet the CAP requirement.
 XML Download