

 PDF
PDF ePub
ePub Citation
 Print
Print


Accreditation is a tool for medical laboratories to demonstrate their competence and to ensure the delivery of accurate and reliable results. More than 70 accreditation bodies are recognized by the international laboratory accreditation cooperation (www.ilac.org). Accreditation for clinical reference laboratories can be voluntary like in Finland and Canada or mandatory like in France and Korea [1, 2, 3, 4, 5]. Clinical laboratories can be accredited by International Standards Organization (ISO) 17025 or IS0 15189. ISO 15189 specifies the requirements of the quality management system for medical laboratories. Validation or verification of each test method is one of the requirements for accreditation (ISO 15189 section 5.5.2) [1].
This manuscript compared various international recommendations to propose a validation protocol for in-house methods. This methodology was applied to quantify lead in whole blood samples by electrothermal atomic absorption spectrometry (ETAAS) [6, 7, 8, 9, 10, 11].
The validation was performed on an M series electrothermal atomic absorption spectrometer (Thermo Scientific, Marietta, OH, USA).The temperature program consisted of four stages: drying (95℃, 10 sec and then 110℃, 25 sec), pyrolysis (700℃, 30 sec), atomization (1,200℃, 4 sec), and cleaning (2,500℃, 4 sec). The equipment used a graphite tube with integrated L'VOV platform. The radiation source was a mono-elementary hollow cathode lamp (λ=283 nm). The Zeeman effect was used for background correction. Argon was used as the purge gas. All the chemicals used were of analytical reagent grade. Atomic absorption spectrometry standard solutions for lead (titrisol grades from Merck; Fontenay-sous-Bois, France) were used to build the calibration curves. They were prepared from a stock solution of 1 g/L by successive dilutions with reverse-osmosis purified water (Merck-millipore, Fontenay-sous-Bois, France).
Each sample was ten-fold diluted in a matrix modifier (2.5 g/L of NH4H2PO4 prepared in 0.5% Triton X-100 [v/v], 0.065% HNO3 [v/v]). Matrix-spiked calibration was performed. Quantification was performed by the integration of absorbance over the time of the transient absorption signal. Internal control samples used were the ones that were commercially available at the Quebec National Public Health Department (INSPQ). Our laboratory participated in inter-laboratory comparison program organized by INSPQ. This program had 6 cycles per year.
The fundamental parameters tested were selectivity, calibration model, precision, accuracy (and uncertainty of measurement), contamination, stability, reference interval, analytical sensitivity, and specificity. The latter two parameters were expressed as the detection limit and interference, respectively [6, 7, 8, 9].
The acceptance or rejection criteria were set prior to validation according to published data, specific legislative and regulatory requirements, and professional judgment. To be validated, each parameter had to meet the acceptance criteria. Results and statistical analysis are detailed in Tables 1 and 2.
To test selectivity, at least six blank samples were analyzed to ensure that there was no interference [7]. The wavelength used was specific to lead and allowed the user to distinguish between it and other components in the sample prior to quantification. No interference was noted.
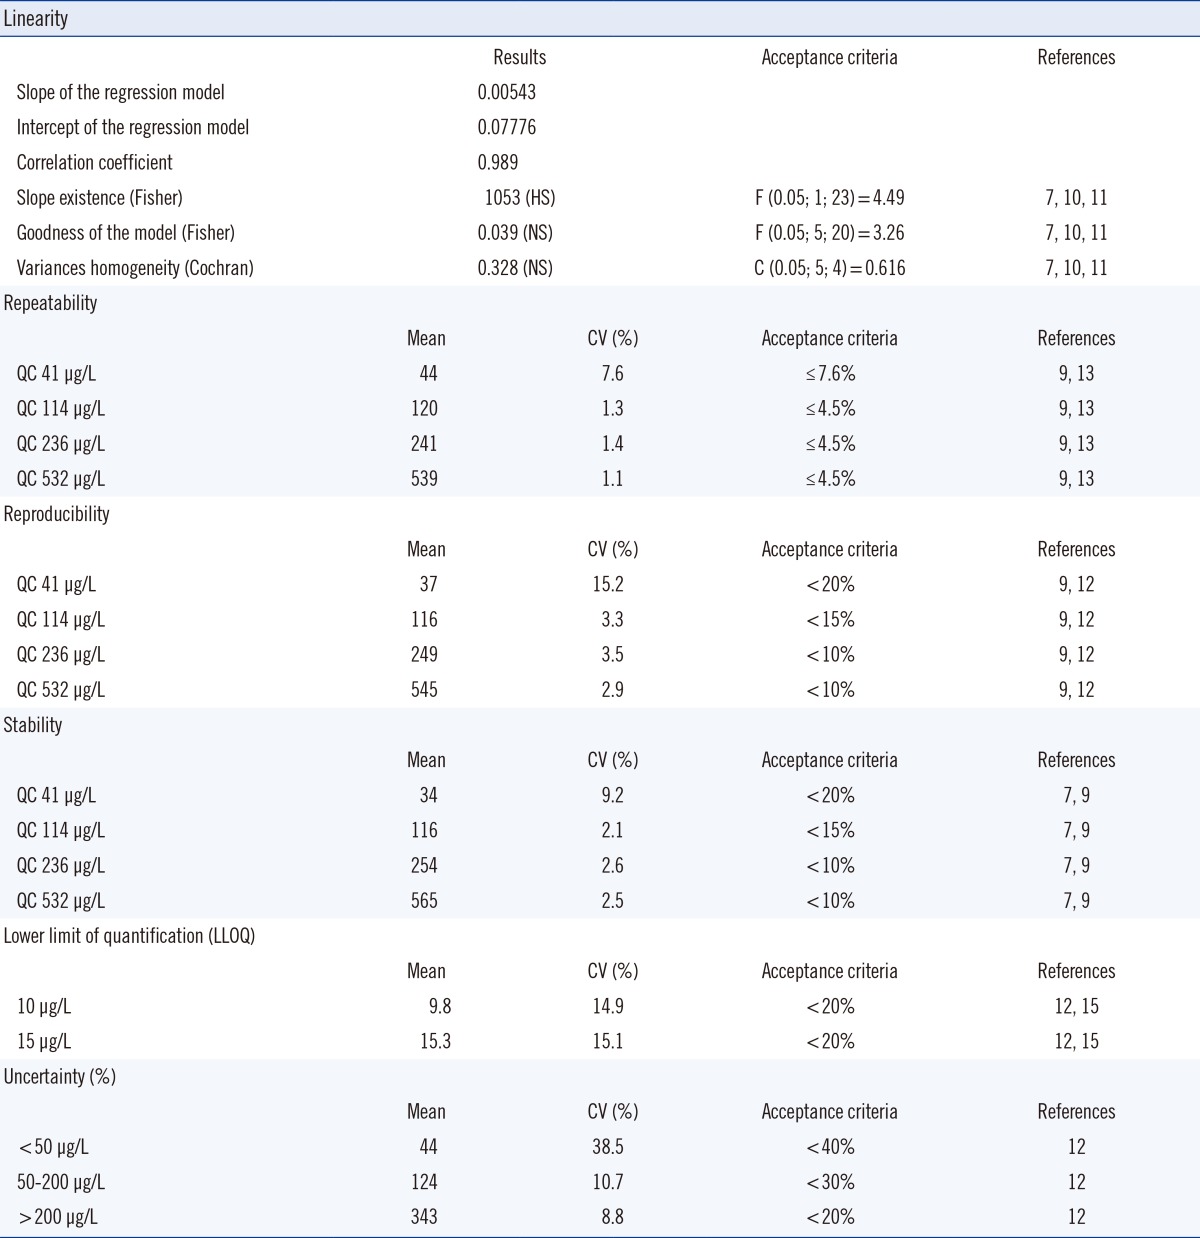
The calibration range was between 10 and 1,000 µg/L. To assess the relationship between concentration and response, five calibration standards were run in duplicate, as recommended by the Australian national association of testing authorities (NATA), US food and drug administration (FDA), French Normalization Association (AFNOR), and Feinberg [7, 8, 9, 10, 11]. Five rounds of calibration were performed [10, 11]. The model was found to be linear.
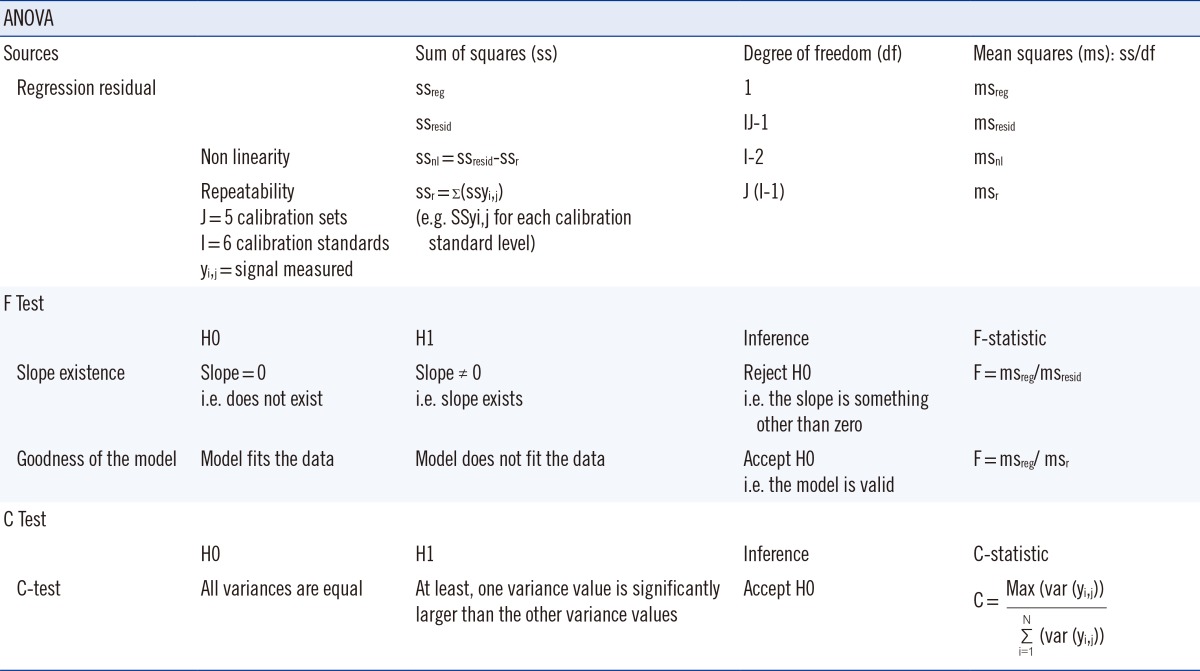
The least squares regression method was used to establish the relationship between the analyte concentration (x) and instrument response (y), and to assess the validity of the calibration model. Slope, intercept, and coefficient of determination of the regression model were calculated. Since a high coefficient of determination did not guarantee that the model fit the data, the existence of a slope and the goodness of the model were tested. These tests were based on a Fisher's statistical test, which compared the variance of two different set of values. In order to evaluate each hypothesis, a research hypothesis (H1) and a null hypothesis (H0) were framed. The null hypothesis was rejected if the F-distribution calculated from the data was greater than the critical value of the F-distribution for the desired false-rejection probability (0.05).
The hypothesis and Formula are shown in Table 1. Two sources of variation were identified and used: regression error (ssreg) and residual error (ssresid), which was composed of non-linearity error and repeatability error (Table 1). Variances in homogeneity of the five curves were evaluated by using Cochran's C Test, which was a one-sided upper limit variance outlier test (Table 1). As described previously, the null hypothesis, H0 was tested against an alternative hypothesis, H1 (Table 1). The upper limit critical value (Ctheo) was chosen according to the desired significance level (α), the number of data series considered (N), and the number of data points (n) per data series. If C exceeded Ctheo, H0 was rejected, i.e variances were not equal (Table 1). These statistical tests confirmed the existence of a slope, the goodness of the model, and the homogeneity of the five calibrations curves. The deviation of standards from nominal concentration was also calculated and it did not exceed 15%. Hence, the model was acceptable.
The lower limit of quantification (LLOQ) was fixed at 10 µg/L. According to published data, a LLOQ between 10 and 15 µg/L was considered normal [12, 13, 14, 15].
It was established using five samples independent of standards. Precision was within 20% of the coefficient variation. Precision included within-batch run or repeatability and between-batch run or reproducibility.
Analyte recovery lied within 80 and 120%, which was in the acceptable range. To assess repeatability, 4 controls (QC1=41 µg/L, QC2=114 µg/L, QC3=236 µg/L, and QC4=532 µg/L) were measured 30 times during a single analytical run. Reproducibility was studied for 20 days with 30 determinations per concentration of the same controls with a maximum of two runs per day. Intra-assay and inter-assay imprecision were evaluated as requested by French regulation authorities, and were less than 10% [12]. It was also possible to compare the performances of the method to published data or proficiency test results [13, 14, 15]. On the contrary, biological imprecision criteria published by Vassault et al. [16] and Minchinela et al. [17] could not be used, as exogenous substances like lead were not included in their databases.
Contamination was assessed using the protocol described in SH GTA 04 by the French Committee for accreditation (COFRAC) [11]. A high-level quality control (QCH 532 µg/L) was analyzed in triplicate (QCH1, QCH2, and QCH3) and a low-level quality control (QCL 12 µg/L) was also analyzed in triplicate (QCL1, QCL2, and QCL3). Five replicates were performed and the percentage of contamination was calculated using the formula (mean [QCH/QCL3-QCL1]×100). It was less than 1% and within the acceptable range.
The stability was evaluated on eight aliquots of each QC maintained at the routine storage conditions (4℃) and during the intended storage period (14 days). The results were compared to the mean of the back-calculated values for the standards at the appropriate concentrations from the first day of long-term stability testing [7, 8, 9]. The mean values of analyte concentration were within ±10% of the nominal value and the CV did not exceed the acceptance criteria [9].
Uncertainty of the method was estimated via the ISO guides to the expression of uncertainty in measurement (GUM) approach based on modeling the measurement and evaluating all sources of uncertainty [18, 19]. The uncertainty in patient result included both pre-analytical and analytical variations. Sources of pre-analytical uncertainty such as sample collection, handling, transport, and storage were difficult to estimate. When standardized procedures, such as guidelines for sample collection were followed, pre-analytical variations might be minimized [20]. Hence, to estimate uncertainty, we mainly considered the analytical variations. Two components were identified as standard sources of uncertainty: long-term precision (intra-laboratory reproducibility) and uncertainty of the calibration (estimated using bias). All identified sources were combined by "error-propagation" formulas to yield the standard uncertainty of the measurement results, which was multiplied by a factor of 2 to obtain the uncertainty. Estimates of measurement uncertainty showed results that were acceptable by COFRAC standards [12] (Table 2). Reference interval for acceptable levels in human body was not verified since the acceptable levels were defined by various national authorities.
To conclude, all the parameters tested satisfied our acceptance criteria. The validity of this method was established. This protocol seemed appropriate to guide laboratories in performing in-house methods validation like ETAAS. Validation allowed ensuring the appropriateness of test results. After initial validation, quality standards had to be maintained. ISO 15189 recommended the development of a quality control system to verify the intended quality of results. Medical laboratories have to develop continuous monitoring of assay performances [1, 6, 7, 8, 9]. The laboratory should not get out-of-range results and our results were acceptable. It could also include, for instance, an internal control system, preventive maintenance of equipment, staff education and training, and internal audits [2, 3, 6].
 XML Download