

 PDF
PDF ePub
ePub Citation
 Print
Print


INTRODUCTION
Hemolysis, icterus, and lipemia (HIL) in patient specimens may interfere with the accurate measurement of various analytes. Identification of specimens with HIL helps laboratories to reduce or eliminate these preanalytical interferents. In the past decade, the most common method for detecting and reporting HIL interference was inspecting individual specimens by laboratory personnel [1]. More recently, sophisticated chemical analyzers have automatically detected the HIL status and have reported HIL index values [2]. The HIL alert index (also known as the threshold level) is defined as the lowest concentration of HIL that interferes with chemical analyses, yielding a bias >10% [2]. However, the methods of reporting HIL status, such as value and index, differ depending on the specific chemical analyzers. For laboratories using multiple chemical analyzers with different HIL reporting systems, it is desirable to report HIL status using a standardized scale. Moreover, the HIL status and comments should be reported as a summary for the rapid and accurate determination of HIL effects on each analyte. HIL flags and comments should be added to the results only when the HIL index value of each analyte is above the corresponding HIL alert index. Therefore, laboratory application of HIL status verifying the clinically significant HIL index may help reduce laboratory turnaround time, re-tests, and specimen re-collection.
In this study, we developed an integrated reporting system to verify HIL status in order to identify the effects of HIL interference on clinical chemistry results.
METHODS
1. Program design
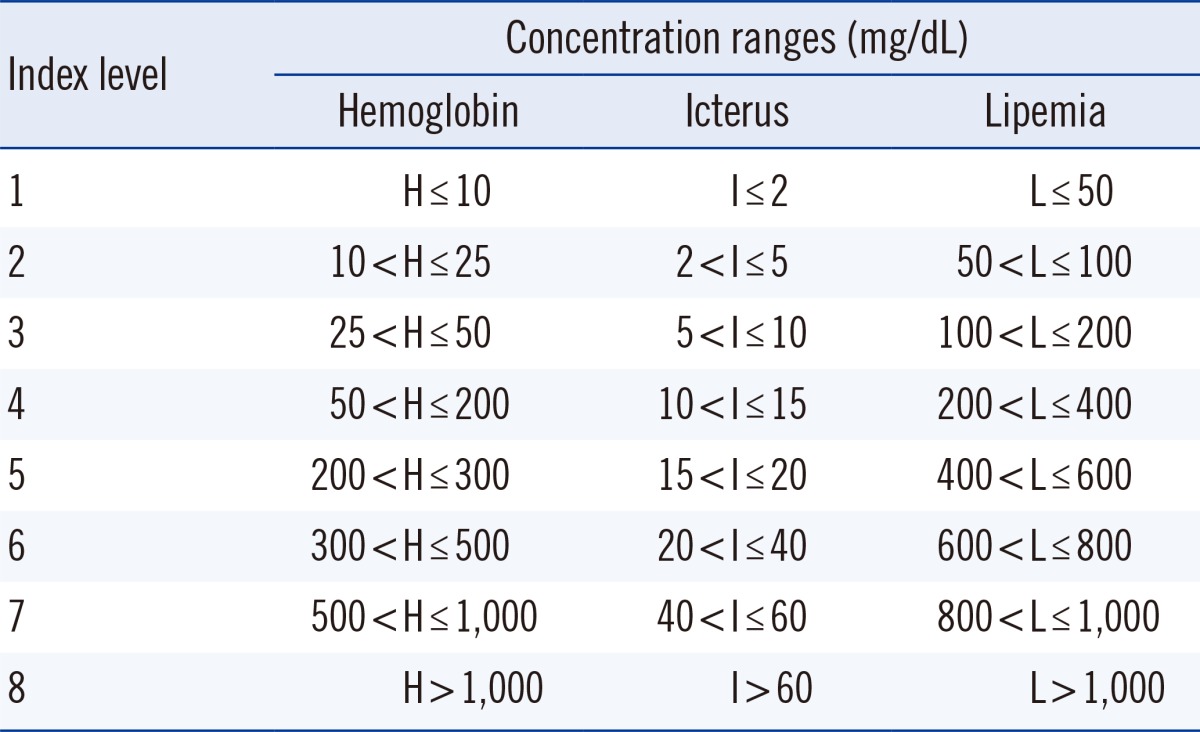
The system was setup in May 2012 at a tertiary-care university hospital in Wonju, Korea. HIL interference data from 30 chemical analytes were provided by the manufacturers of the Vista 1500 system (Siemens Healthcare Diagnostics, Sacramento, CA, USA), Advia 2400 system (Siemens Healthcare Diagnostics), and Modular DPE system (Roche Diagnostics, Bazel, Switzerland) [3, 4, 5]. These data were used to generate a tolerance table that defined the extent of the bias at specific index values (alert index values). The HIL index table was then added to the existing hospital database, which consisted of an order communication system database, laboratory information system (LIS) database, and hospital information system database. Each HIL index record was composed of an HIL alert index and interference effects. HIL results generated by the Vista 1500 system (Siemens Healthcare Diagnostics), Advia 2400 system (Siemens Healthcare Diagnostics), and the Modular DPE system (Roche Diagnostics) were used to generate HIL index criteria (Table 1) recommended by the Clinical Laboratory and Standards Institute [2]. These criteria were then transmitted to a computer by an interface program and were saved in the database. Finally, the HIL data were displayed on physicians' personal computers. The HIL concentrations and index values were displayed in a column next to the chemical test results for easy comparison. When an HIL index value is above the HIL alert index, a warning comment is displayed on the physician's monitor along with the flagged result. However, if two or more HIL index values were above the HIL alert index, a sum of each flag replaced the up or down marks (Fig. 1).
2. Data analysis
In August 2012, three HIL index results were analyzed according to patient-admission type, age, sex, and proportion of HIL alert indices. The HIL data obtained from the Advia 2400 system (Siemens Healthcare Diagnostics) were combined with those from the Modular DPE system (Roche Diagnostics), because the analytes were measured in the Advia 2400 system (Siemens Healthcare Diagnostics) using Roche reagents.
3. Statistical analysis
Data were analyzed using IBM SPSS Statistics version 20 (SPSS Inc., Chicago, IL, USA). Statistical significance of the difference in the frequency of normal HIL index according to patient groups (ward, outpatient department, and emergency room) was determined by the χ2 test. The P value was determined at the 0.05 level of a two-tailed test.
RESULTS
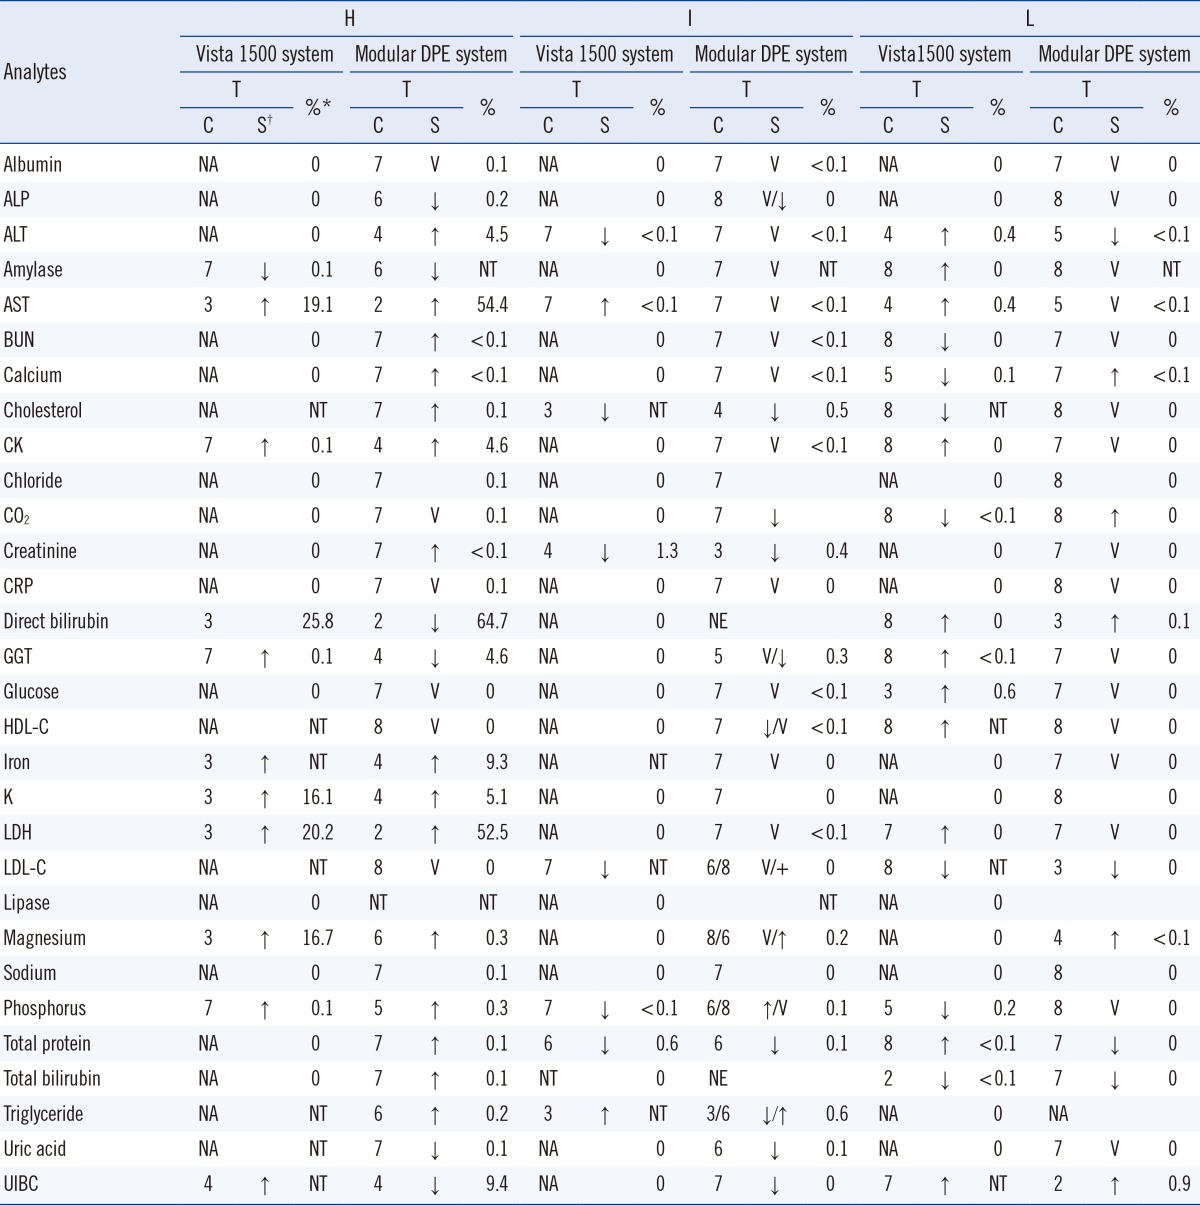
The proportions of specimens exceeding the hemolysis alert index for each analyte as shown by the Vista 1500 system (Siemens Healthcare Diagnostics) were, in decreasing order, direct bilirubin (25.8%), lactate dehydrogenase (LDH, 20.2%), AST (19.1%), magnesium (16.7%), potassium (16.1%), and other components (≤0.1%). The proportions of specimens exceeding the hemolysis alert index as shown using the Modular DPE system (Roche Diagnostics) were direct bilirubin (64.7%), AST (54.4%), LDH (52.5%), unsaturated iron binding capacity (UIBC, 9.4%), iron (9.3%), creatine kinase (4.6%), gamma-glutamyl transferase (GGT, 4.6%), ALT (4.5%), and other components (≤0.3%).
The proportions of the specimens that exceeded the icterus alert index as shown by the Vista 1500 system (Siemens Healthcare Diagnostics) were, in decreasing order, creatinine (1.3%), total protein (0.6%), and other components (<0.1%). The proportions of the specimens that exceeded the icterus alert index as shown by the Modular DPE system (Roche Diagnostics) were triglyceride (0.6%), cholesterol (0.5%), creatinine (0.4%), GGT (0.3%), and other components (≤0.2%). The proportions of specimens exceeding the lipemia alert index as shown by the Vista 1500 system (Siemens Healthcare Diagnostics) were, in decreasing order, glucose (0.6%), AST (0.4%), ALT (0.4%), and other components (≤0.2%). The proportions of specimens exceeding the lipemia alert index as shown by the Modular DPE system (Roche Diagnostics) were UIBC (0.9%) and other components (≤0.1%). These data are summarized in Table 2.
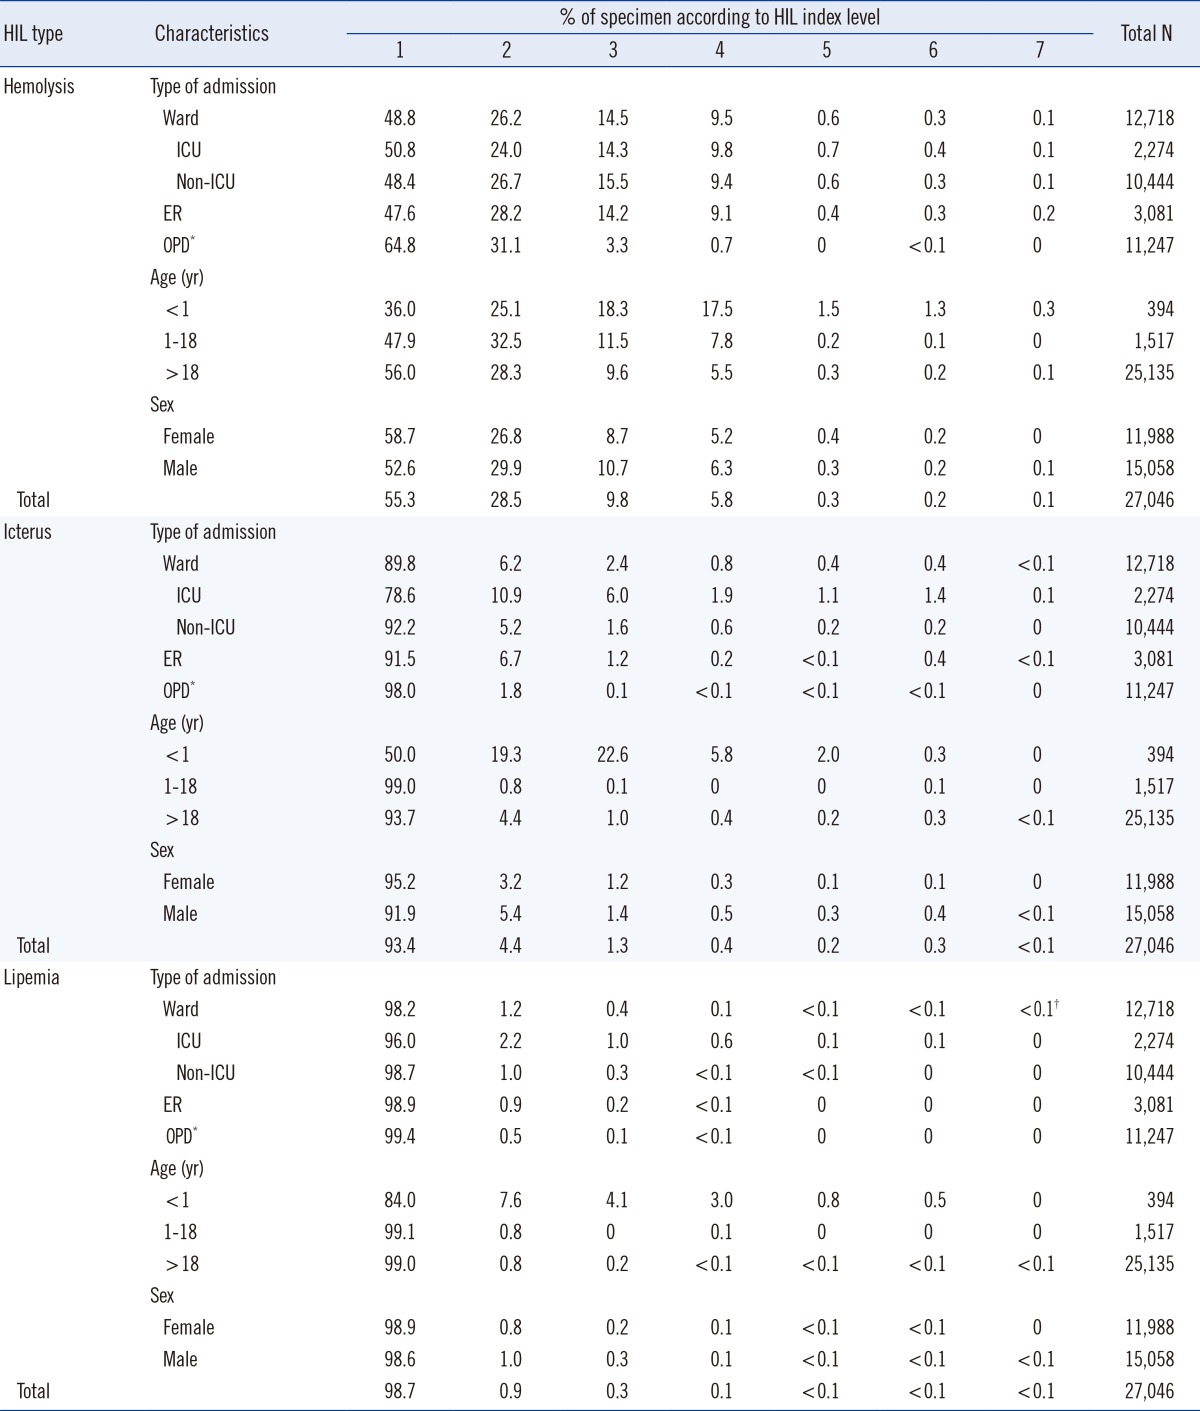
The frequency of the normal HIL index values of specimens obtained from the outpatient department (OPD) was higher than that of specimens obtained from the general ward or emergency room (ER) (P<0.001, Table 3). Only 0.8% of specimens obtained from the outpatient department had hemolysis indices >3, whereas 10.0-11.0% of specimens from the general ward, intensive care unit (ICU), and ER had hemolysis indices >3. According to age group, 20.5% of patients <1 yr, 16.2% of patients 1-18 yr, and 6.0% of patients >18 yr had specimens with hemolysis indices greater than 3. According to the area of admission, the percentages of specimens with icterus indices >2 were as follows: ICU (21.4%), ER (8.5%), general ward (7.8%), and OPD (2.0%). According to age group, the percentages of specimens with icterus indices greater than 2 were: <1 yr (50.0%), >18 yr (6.3%), and 1-18 yr (1.0%). According to sex, the percentages of specimens with icterus indices greater than 2 were as follows: males (8.1%) and females (4.8%). The percentages of samples with lipemia indices of 1, 2, and ≥3 were 98.7%, 0.9%, and 0.4%, respectively. Patients <1 yr of age had the highest percentage of specimens with a lipemia index >1 (16.0%). These data are summarized in Table 3.
DISCUSSION
Endogenous substances that interfere with chemical analyzers pose a significant source of error in clinical laboratory measurements. These altered results lead to repeated phlebotomy and tests, thus incurring additional costs. Moreover, incorrect interpretation of test results may lead to incorrect diagnoses, unnecessary disputes between the laboratory staff and the primary physicians, and ultimately, a delay in decision-making for the patients. Thus, it is essential to develop effective processes for systematically identifying unsuitable specimens [6, 7].
The HIL alert index specifies the concentration range that may cause interference. In event of HIL interference in a particular method, the recommended HIL alert indices are automatically displayed on the monitor of the chemical analyzer. However, these values are also shown on the physician's personal computer after their customization using a software interface that communicates with the hospital LIS. Our laboratory used three types of chemical analyzers: the Modular DPE system (Roche Diagnostics) and Advia 2400 system (Siemens Healthcare Diagnostics) were used for specimens obtained from the OPD and general ward, and two Vista 1500 systems (Siemens Healthcare Diagnostics) were used for specimens obtained from the ER. The HIL alert index of the Modular DPE system (Roche Diagnostics) for each analyte must be set up on the basis of HIL concentration, because the system does not report the HIL index value [4]. The Vista 1500 system (Siemens Healthcare Diagnostics) reports the HIL status as both, the HIL index and the HIL value, and its HIL alert index for an analyte value is based on the HIL index [5]. To standardize the HIL indices across the three chemical analyzers, each with a different HIL reporting method, we established an integrated management system for the HIL reporting system. In this system, the HIL warning comments were automatically compiled by user-defined command sentences and displayed when any of the measured HIL index values were ≥ the corresponding alert index value.
Before instituting this reporting system, our laboratory personnel detected hemolysis by visual inspection of the individual specimens. The medical staff was then notified of the results by phone. After instituting the reporting system, the HIL interference comment was as follows: "Test performed on requested specimen may cause under-recovery or over-recovery more than 10% of initial concentration. Please submit re-collected specimen within 2 hr if a potential interferent is clinically significant." The maximum effect of a potential interferent may be complex and vary depending on both the concentration and the particular analyte present. The laboratory's individual patient population should be considered when determining the clinical significance of a potential interference.
Although chemical analyzers and their reagents have been improved to minimize HIL interferences, none has provided satisfying results to date. Typically, a sample should be rejected when there is a high risk of reporting an unreliable result. Educating personnel who collect the samples may minimize the frequency of unsuitable specimens. An alternative solution for mitigating pre-analytical interference effects is re-testing the specimens using another chemical analyzer unaffected by the HIL interferents according to the flagged HIL status. Another approach for minimizing the hemolysis and icterus interference effects, such as in specimens with hyperbilirubinemia or derived from difficult blood sampling (e.g., newborns, patients with poor vascular integrity, or underlying severe liver disease), is to use an analytical methodology with a higher HIL threshold [8, 9].
The system described herein has the potential to give quick results about decreased or increased HIL analyte values in the specimen. This integrated HIL reporting system provides an effective screening method that verifies specimen quality based on HIL status and simplifies the laboratory workflow.

 XML Download