

 PDF
PDF ePub
ePub Citation
 Print
Print


INTRODUCTION
Blood and blood components are limited bioresources that are obtained through donation, similar to bone marrow and internal organs such as a kidney. Thus, the availability of blood components is dependent on blood donation. In Korea, the number of blood component units supplied to medical institutions by 2 primary blood institutions annually increased from 3,647,730 units in 2006 to 4,528,412 units in 2010 [1].
The increased demand for blood components is a worldwide phenomenon. In the United States, the number of whole blood and red blood cell (RBC) transfused units increased from 14,182,000 units in 2004 to 15,014,000 units in 2008 [2, 3]. In Canada, 833,020 RBC units were supplied to hospitals in 2008/2009, which represented a 4.2% increase from the 799,556 units supplied in the previous year [4]. In Australia, the number of transfused RBC units increased from 768,919 units in 2007/2008 to 795,892 units in 2009/2010 [5]. Since the rise in supply of blood units reflects a rise in transfusion demand, assessing the numbers of transfusion recipients and blood component units transfused at medical institutions can provide the data needed for developing plans to manage the demand for blood units.
Some studies reporting on blood transfusion from the recipient's perspective have associated the increase in transfusion demand with an aging and increasingly diverse population and an increase in therapeutic interventions [6-10]. However, few studies have examined the characteristics of transfusion recipients in Korea [11-13]. A better understanding of transfusion recipients' characteristics and the numbers of blood units transfused at medical institutions will help predict future demand for blood components and provide a basis for developing strategies to meet those needs. Korea's blood transfusion control policy primarily focuses on providing a stable and adequate supply of blood component units rather than controlling the demand [14]. However, controlling the demand itself or the rate of blood transfusions performed is also needed to achieve a constant and sufficient supply of blood units.
The main components of donated whole blood are RBCs, platelets, and plasma. Since each component is used separately to treat completely different conditions, blood units transfused should be examined based on the blood component. Hence, this study focused on examining RBC component units. This study is aimed at examining changes in the number of RBC units transfused at differed types of medical institutions and characteristics of transfusion recipients, and providing fundamental data on RBC unit transfusions required for future research.
METHODS
1. Study data
This study used the Health Insurance Review & Assessment Service (HIRA) insurance benefits reimbursement claims for RBC units transfused during the 5-yr period from 2006 to 2010. In Korea, the National Health Insurance (NHI) is a social insurance program, and all citizens receive health benefits through the NHI or the public medical aid program.
Medical insurance coverage extends to all medical institutions. After providing recipients with the RBC units, medical institutions submit an insurance claim to the HIRA, which then makes a payment to the medical institution following the review and assessment of the claim. The claim data includes some variables such as gender, age, type of insurance, claimed medical institution, and primary discharge diagnosis of the transfused patient.
Of the 34 total blood unit types, we selected 10 RBC units for this study, e.g., packed RBCs (320 mL and 400 mL), washed RBCs (320 mL and 400 mL), leukocyte-reduced RBCs (320 mL and 400 mL), and other RBC unit types such as apheresis RBCs (190 mL). This study was approved by the Konkuk University Hospital institutional review boards (approval number: KUH 1200024).
2. Variables
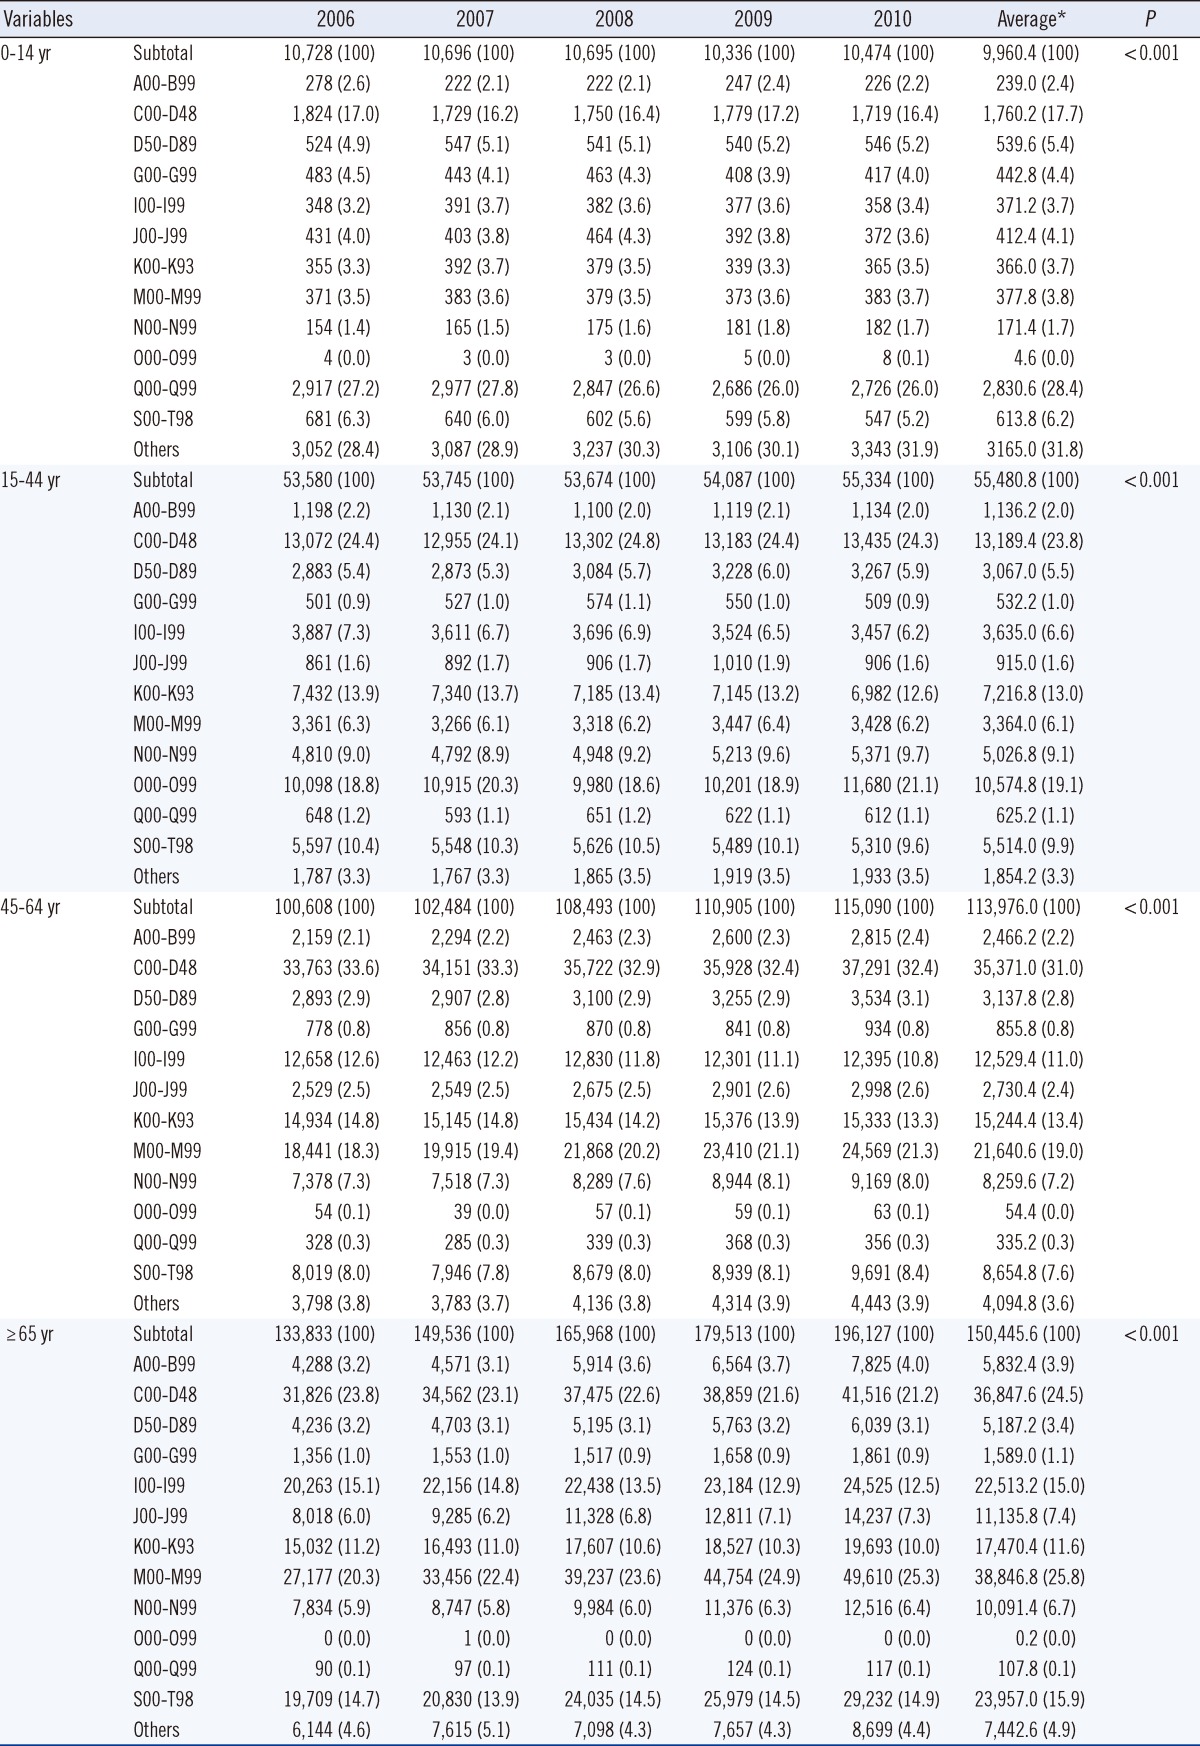
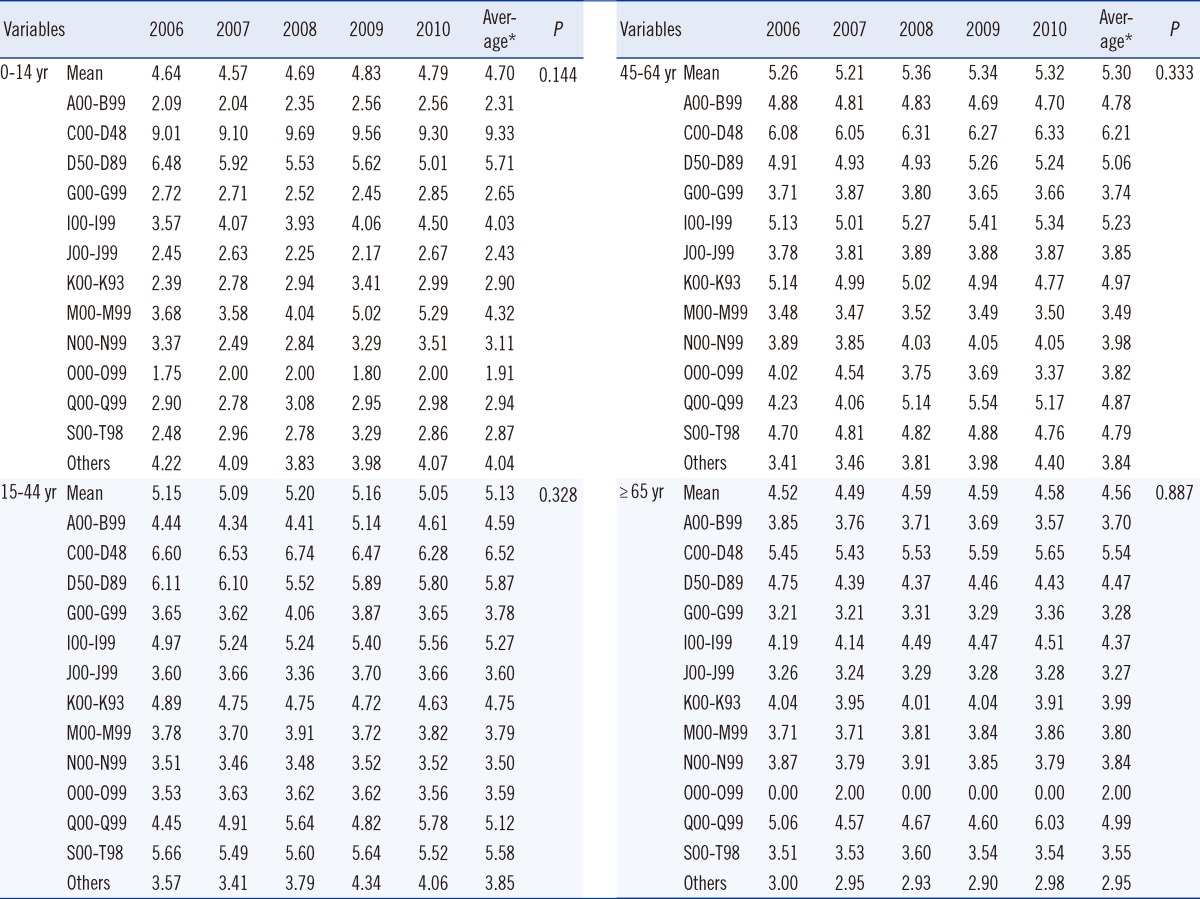
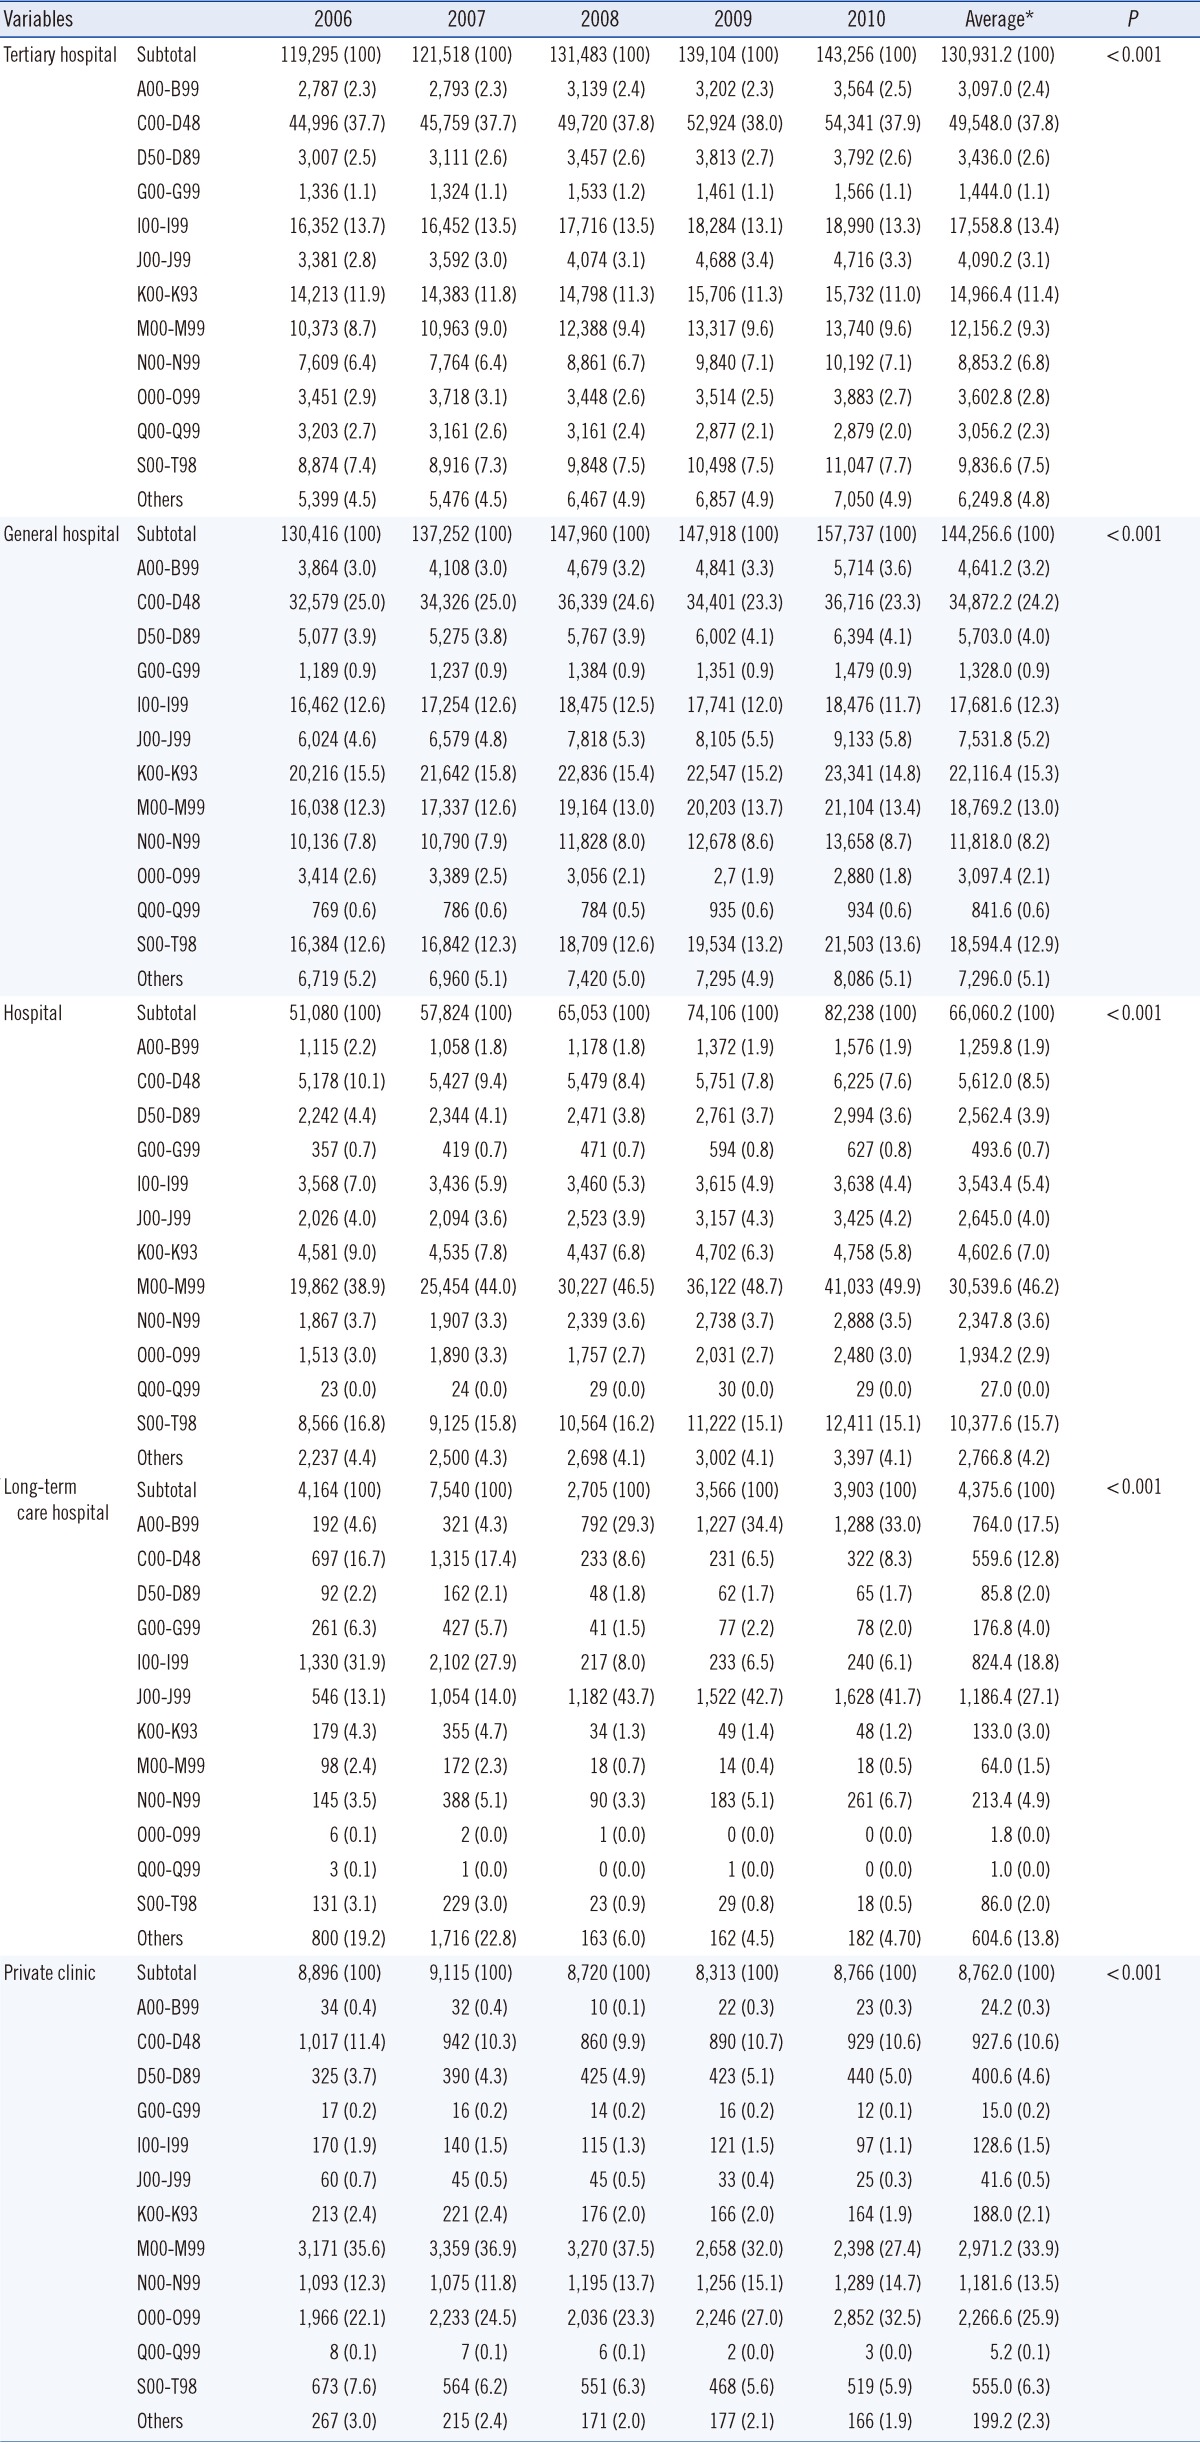
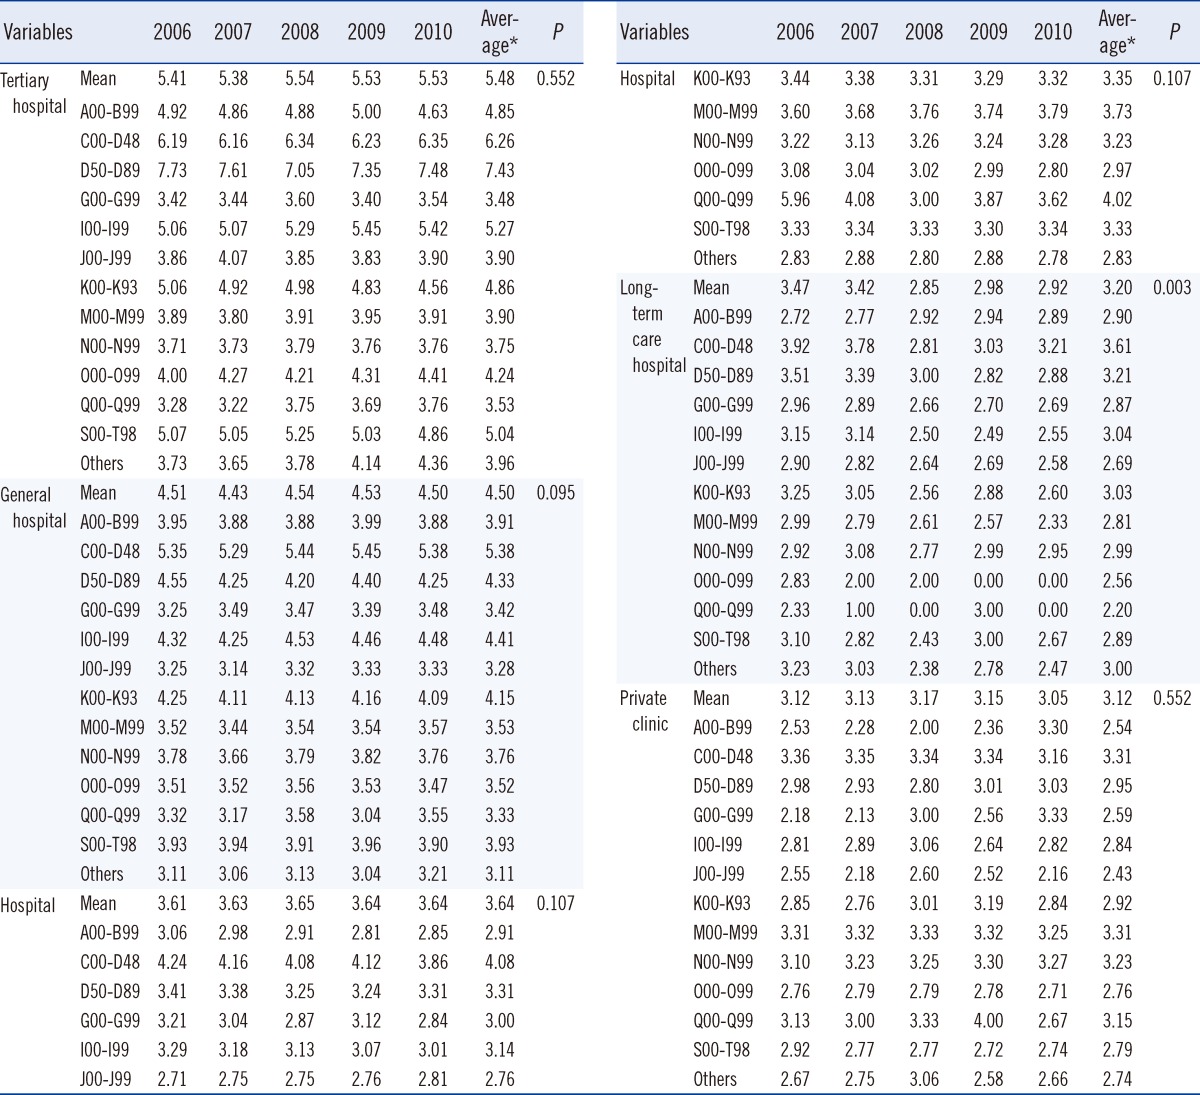
In our analysis, we considered the following 5 variables: gender; age (0-14, 15-44, 45-64, or ≥65 yr of age); type of insurance (NHI, public medical aid, or other); type of medical institution, based on function and number of beds (tertiary hospital, general hospital, hospital, long-term-care hospital, private clinic, dental hospital, or public health center); and primary discharge diagnosis.
Based on the International Statistical Classification of Diseases Code, 9th edition (ICD-9), the following disease classifications were used for primary discharge diagnosis: certain infectious and parasitic diseases (A00-B99); neoplastic diseases (C00-D48); diseases of the blood and blood-forming organs, and certain disorders involving the immune mechanism/system (D50-D89); diseases of the nervous system (G00-G99); diseases of the circulatory system (I00-I99); diseases of the respiratory system (J00-J99); diseases of the digestive system (K00-K93); diseases of the musculoskeletal system and connective tissue (M00-M99); diseases of the genitourinary system (N00-N99); pregnancy, childbirth, and puerperium (O00-O99); congenital malformations, deformations, and chromosomal abnormalities (Q00-Q99); injury, poisoning, and other consequences resulting from external causes (S00-T98); and others.
3. Measurements
A single transfusion recipient was represented by a single Korean identification number, regardless of the transfusion date (between January 1 and December 31). However, if one was transfused before and after one's birthday on age group (four age groups), that person was regarded as one for each age group. Differences in the total number of transfusion recipients (based on gender and age group, as well as on insurance type, institution type, and disease group types) were calculated.
First, changes in the number of transfusion recipients based on gender and age groups were calculated for the 5-yr period. Second, the total number of RBC units transfused and the number of RBC units transfused per recipient were calculated based on the variables. Finally, the number of transfusion recipients and RBC units transfused per recipient were calculated based on age and disease groups and based on medical institution type and disease groups.
4. Data analysis
Statistical analyses were performed using the SAS software (ver. 9.1, SAS Institute, Cary, NC, USA). The Mantel-Haenszel chi-square test was used to analyze changes in the number of RBC units transfused between years, as well as changes in other variables. A trend analysis of the number of RBC units transfused per recipient between years, and of other variables was performed using an ANOVA test. A P value<0.05 indicated statistical significance.
RESULTS
1. Distribution of transfusion recipients
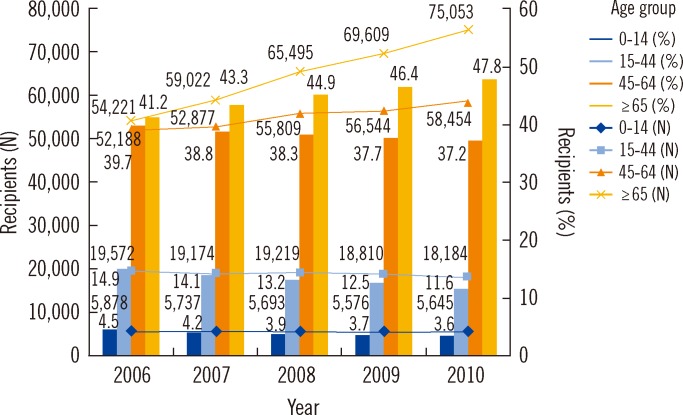
The total number of male transfusion recipients increased from 131,487 in 2006 to 157,030 in 2010 (Fig. 1). Between 2006 and 2010, the number of male transfusion recipients: increased from 5,878 (4.5%) to 5,645 (3.6%) for the 0-14 age group; decreased from 19,572 (14.9%) to 18,184 (11.6%) for the 15-44 age group; increased from 52,188 (39.7%) to 58,454 (37.2%) for the 45-64 age group; and increased from 54,221 (41.2%) to 75,053 (47.8%) for the ≥65 age group.
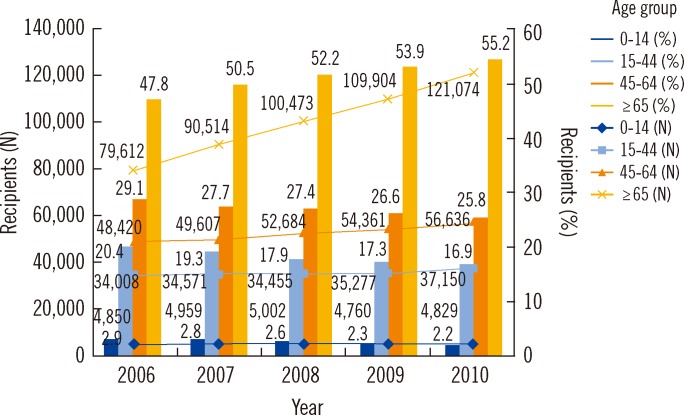
The total number of female transfusion recipients increased from 166,562 in 2006 to 219,415 in 2010 (Fig. 2). Between 2006 and 2010, the number of female transfusion recipients did not change significantly (4,850, 2.9% vs. 4,829, 2.2%) for the 0-14 age group; increased from 34,008 (20.4%) to 37,150 (16.9%) for the 15-44 age group; decreased from 48,420 (29.1%) to 56,636 (25.8%) for the 45-64 age group; and increased from 79,612 (47.8%) to 121,074 (55.2%) for the ≥65 age group.
2. Total RBC units transfused and RBC units transfused per recipient
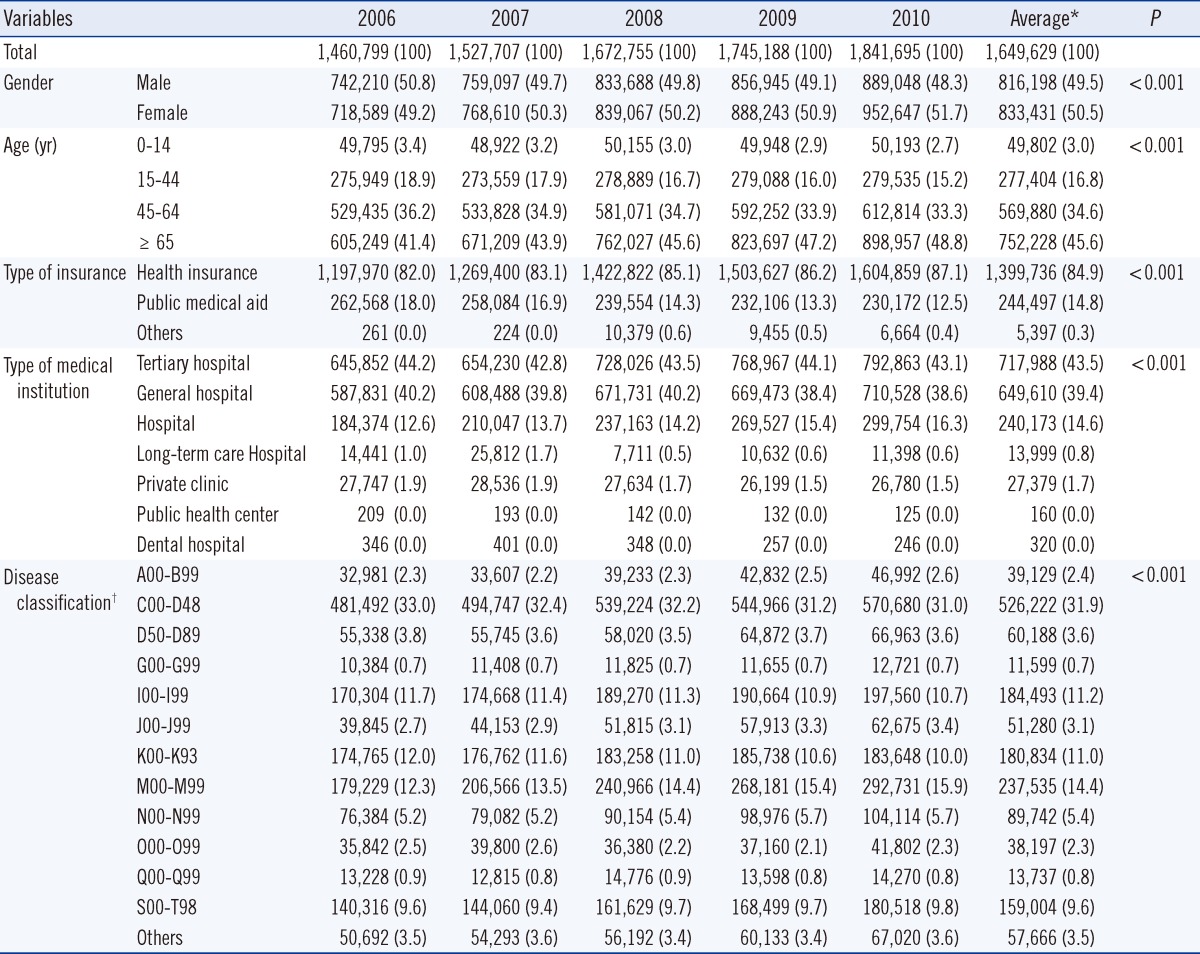
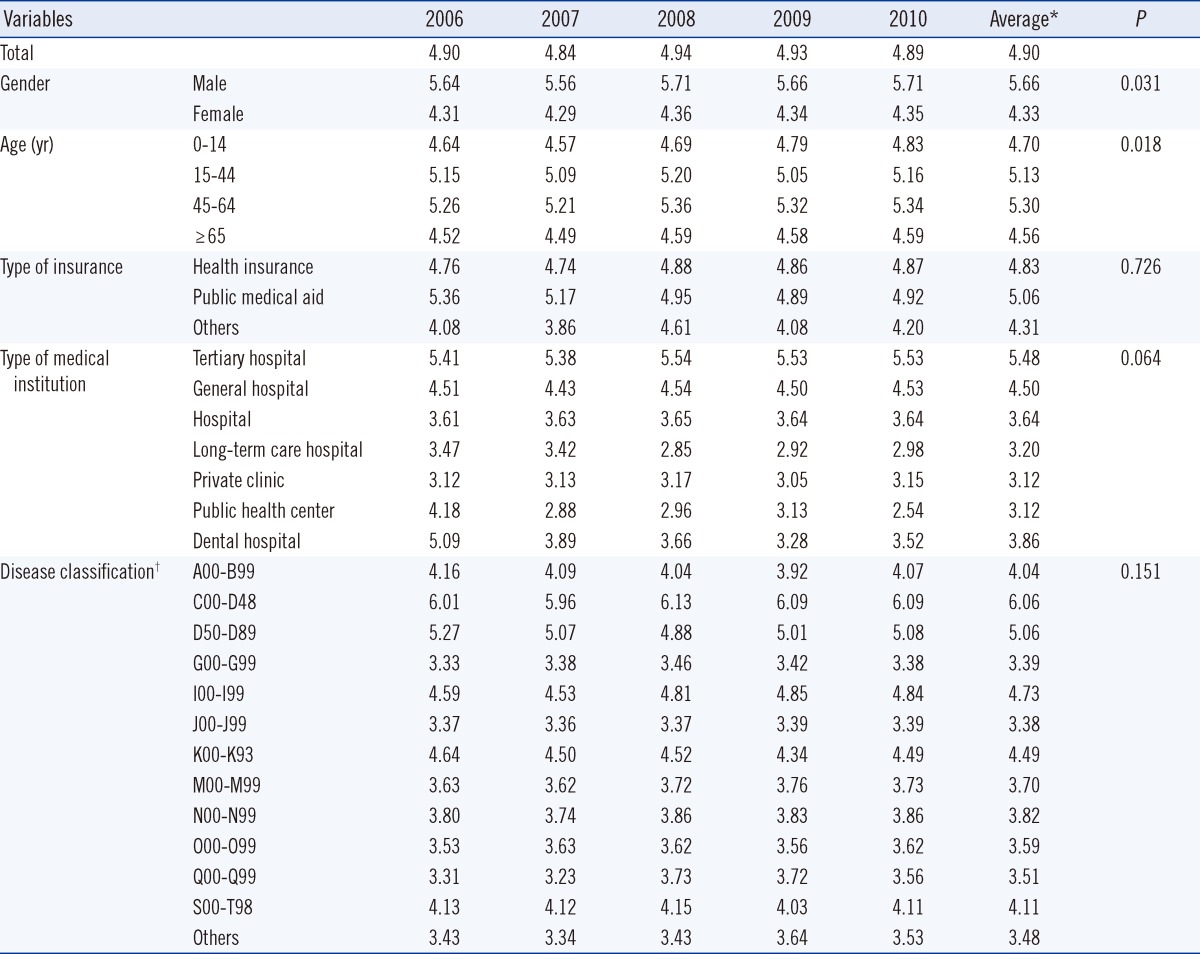
The total number of RBC units transfused increased from 1,460, 799 units in 2006 to 1,841,695 units in 2010 (Table 1); however, the number of RBC units transfused per recipient did not significantly change between 2006 (4.90 units) and 2010 (4.89 units; Table 2). The total number of RBC units transfused from 2006 through 2010 increased from 49.2% to 51.7% (P<0.001) for female recipients, from 41.4% to 48.8% (P<0.001) for recipients ≥65 yr of age, and from 82.0% to 87.1% (P<0.001) for recipients with health insurance. Additionally, more than 80% of the total RBC units were transfused at tertiary and general hospitals; however, this composition rate slightly declined by 2010, and the composition rate for hospitals increased from 12.6% to 16.3% (P<0.001).
As for the total number of RBC units transfused by disease classification, the following average composition rates were calculated for the 5-yr period: neoplastic diseases (31.9%); diseases of the musculoskeletal system and connective tissue (14.4%); diseases of the circulatory system (11.2%); diseases of the digestive system (11.0%); injury, poisoning, and other consequences resulting from external causes (9.6%; P<0.001; Table 1). The average number of RBC units transfused per recipient over the 5-yr period was 5.66 units for male recipients, 4.33 units for female recipients (P=0.031), and 4.56 units for recipients aged ≥65 yr (P=0.018), which represented the age group with the lowest number of RBC units transfused. An increase in the number of RBC units transfused was observed for recipients with health insurance, and a decrease was observed for those with public medical aid (P=0.726). The average number of RBC units transfused per recipient based on medical institution was 5.48 units for tertiary hospitals, 4.50 unit for general hospitals, and 3.64 units for hospitals (P=0.064). The average number of RBC units transfused per recipient based on disease classification was 6.06 units for neoplastic diseases, 5.06 units for diseases of the blood and blood-forming organs and certain disorders involving the immune mechanism/system, and 4.73 units for diseases of the circulatory system (P=0.151; Table 2).
3. Number of recipients and RBC units transfused per recipient by age group and disease classification
Over the 5-yr period, the highest average number of RBC units was transfused to the following age and disease groups: congenital malformations deformations and chromosomal abnormalities (28.4%) and neoplastic diseases (17.7%) of the 0-14 age group (P<0.001); neoplastic diseases (23.8%) and pregnancy, childbirth, and puerperium (19.1%) of the 15-44 age group (P<0.001); neoplastic diseases (31.0%) and diseases of the musculoskeletal system and connective tissue (19.0%) of the 45-64 age group (P<0.001); as well as diseases of the musculoskeletal system and connective tissue (25.8%) and neoplastic diseases (24.5%) of the ≥65 age group (P<0.001; Table 3).
Over the 5-yr period, the disease groups with the highest average number of RBC units transfused per recipient were: neoplastic diseases (9.33 units) and diseases of the blood and blood-forming organs and certain disorders involving the immune mechanism/system (5.71 units), of the 0-14 age group (P=0.144); neoplastic diseases (6.52 units) and diseases of the blood and blood-forming organs and certain disorders involving the immune mechanism/system (5.87 units), of the 15-44 age group (P=0.328); neoplastic diseases (6.21 units) and diseases of the circulatory system (5.23 units), of the 45-64 age group (P=0.333); and neoplastic diseases (5.54 units) as well as congenital malformations, deformations, and chromosomal abnormalities (4.99 units), of the ≥65 age group (P=0.887; Table 4).
4. Number of recipients and RBC units transfused per recipient by medical institution type and disease classification
The highest average percentage of recipients transfused with RBC units over the 5-yr period were patients with: neoplastic diseases (37.8%) and diseases of the circulatory system (13.4%) at tertiary hospitals (P<0.001); neoplastic diseases (24.2%) and diseases of the digestive system (15.3%) at general hospitals (P<0.001); and diseases of the musculoskeletal system and connective tissue (46.2%) and injury, poisoning, and other consequences resulting from external causes (15.7%) at hospitals (P<0.001; Table 5).
Disease groups with the highest number of RBC units transfused per recipient over the 5-yr period were: diseases of the blood and blood-forming organs and certain disorders involving the immune mechanism/system (7.43 units) and neoplastic diseases (6.26 units) at tertiary hospitals (P=0.552); neoplastic diseases (5.38 units) and diseases of the circulatory system (4.41 units) at general hospitals (P=0.095); and neoplastic diseases (4.08 units) as well as diseases of the congenital malformations, deformations, and chromosomal abnormalities (4.02 units) at hospitals (P=0.107; Table 6).
DISCUSSION
The highest numbers of both male and female RBC unit transfusion recipients were aged ≥65 yr; this age group also had the highest increasing rate of RBC units transfused. Recipients with the highest number of RBC units transfused were female (gender), aged >65 yr (age group), with health insurance (insurance type), and diagnosed with neoplastic diseases (disease group). Additionally, recipients with the highest number of RBC units transfused per recipient were male (gender), aged 45-64 yr (age group), with public medical aid (insurance type), and diagnosed with neoplastic diseases (disease group).
This study found that the increase in the absolute number of RBC units transfused for recipients across disease groups from 2006 to 2010 was the result of an increase in the number of transfusion recipients that is possibly due to the increased number of patients diagnosed with diseases that require RBC units. For instance, the number of recipients with neoplastic diseases increased from 80,485 in 2006 to 93,961 in 2010, and the number of recipients with diseases of the musculoskeletal system and connective tissue increased from 49,350 in 2006 to 77,990 in 2010. Although the number of RBC units transfused per recipient did not change significantly between 2006 and 2010 within each disease group, it increased from 6.01 units in 2006 to 6.09 units in 2010, and from 3.63 units in 2006 and 3.76 units in 2010 for recipients with neoplastic diseases and diseases of the musculoskeletal system and connective tissue, respectively.
The total average compositional rates for RBC units transfused over the 5-yr period were 31.9% for neoplastic diseases; 14.4% for diseases of the musculoskeletal system and connective tissue; 11.2% for diseases of the circulatory system; 11.0% for diseases of the digestive system; and 9.6% for injury, poisoning, and certain other consequences of external causes. These results are similar to those observed by the PROTON study conducted in Netherlands, where the following compositional rates were reported: 21.5% for diseases of the circulatory system; 22.2% for neoplastic diseases; 10.5% for injury, poisoning, and certain other consequences of external causes; 9.8% for diseases of the digestive system; and 5.3% for diseases of the musculoskeletal system and connective tissue [10].
In addition, transfusion recipient numbers by medical institution type were different depending on disease types. This demonstrates that the distribution of patient groups requiring RBC unit transfusion varies based on the institution type. Therefore, we could suggest that the increase in the total number of RBC units transfused could be explained by the involvement of specialized hospitals, the increase in the number of patients diagnosed with cancer or diseases of the musculoskeletal system and connective tissue, or the increase in the number of surgery procedures associated with these diseases. For instance, between 2006 and 2010, the number of hospitalized patients increased: from 605,462 (14.0%) to 890,857 (15.6%) for injury, poisoning and other consequences resulting from external causes; from 549,887 (11.3%) to 644,132 (11.3%) for diseases of the circulatory system; from 375,516 (8.7%) to 506,311 (8.9%) for neoplastic diseases; and from 336,247 (7.7%) to 637,385 (11.2%) for diseases of the musculoskeletal system and connective tissue, respectively [15, 16].
We found that transfusion recipients were more commonly women than men. Moreover, more than 50% of recipients were aged ≥65 yr, and they used 40% of the total transfused blood volume. The increased demand for RBC units is the result of changes in population structure as well as increased number of patients at risk. The percentage of people aged ≥65 yr increased from 9.5% in 2006 to 11.0% in 2010; additionally, women represented 66.7% of the population in 2006, compared to 69.2% in 2010 [17]. Furthermore, women's concern for their health has increased, which has led them to visit hospitals more frequently [18]. Several previous studies showed that the elderly use a significant amount of blood components. For instance, elderly patients constituted 40% of the total RBC recipients in 1999 in the United Kingdom [6]. People aged ≥70 yr accounted for 39.9% of the total RBC unit consumption in 2004 in Mecklenburg-Western Pomerania [8]. Moreover, recipients aged ≥65 yr received 57.6% of the RBC units, 41.4% of the fresh frozen plasma (FFP) units, and 29.0% of the platelet (PLT) units from 1996 to 2006 in the Netherlands [10]. In our study, we also observed that men required more RBC units transfused. This may be attributable to men undergoing more aggressive treatments than women, requiring more excessive blood transfusions. This observation was similarly reported by a study conducted in the Netherlands, where 50% of all RBC units, 59% of all FFP units, and 60% of all PLT units were transfused to men [10].
The decision to transfuse RBC components depends on the amount of blood loss, hemoglobin levels, and other patient clinical criteria used by doctors to determine the need to provide sufficient oxygen to patients' peripheral parts or tissues. However, the increase in the number of transfusion recipients and of transfused RBC units observed in our study suggests that some other issues should be considered during the decision process, such as whether the transfusion is necessary, and whether the appropriate amount of blood is transfused to avoid overtransfusion [19].
Comparison between studies is rarely beneficial, due to differences in study timeframes, practice guidelines, design, and particularly, due to the influence of appropriateness criteria. However, 2 systematic reviews have considered 4-66% of transfusion recipients to be inappropriate recipients [20, 21], and previous reports suggested that 20-51.5% of transfusion recipients were overtransfused [22, 23]. In the present study, we were unable to determine patient health conditions; therefore, we could not determine whether the transfusion was necessary or whether the appropriate number of RBC units was transfused. The HIRA has evaluated the number and appropriateness of transfusions conducted by general and tertiary hospitals since 2003, and has published the evaluation [24]. However, this assessment did not lead to a regulation of the demand for blood units at these hospitals.
This study has some limitations. First, our analysis was based on the primary discharge diagnosis, although diagnoses may have been exaggerated or falsified for the insurance claim. In addition, our findings did not include data involving non-primary diseases. Second, we did not consider the recipient clinical status, since it could not be determined using the claim data. As a result, we could not identify whether the RBC units were appropriately or inappropriately transfused. The increasing rates we observed suggest overuse, although it is possible that patient conditions were getting worse, or that more surgical procedures requiring larger volume blood transfusions were performed; this issue can be clarified through reviewing the medical records of recipients. Third, blood unit claims from occupational insurance, car insurance, and the non-insurance sector were not included in our study. Furthermore, we were unable to distinguish between donor blood and autologous blood use at the various institutions. Finally, we were only able to examine general recipient characteristics (gender, age, and disease) but not other recipient health-related variables or characteristics of the doctor who made the decision to use RBC units.
Future studies should investigate the causes behind this increase in the number of RBC unit recipients and should thoroughly examine transfusion recipients' medical records to assess the appropriateness of transfusions.
 XML Download