

 PDF
PDF ePub
ePub Citation
 Print
Print


INTRODUCTION
The WHO had targeted iodine deficiency disorders (IDD) as a disease that needs to be alleviated worldwide. IDD is manifested by goiter and hypothyroidism in people of all age groups; other manifestations include spontaneous abortion, perinatal mortality and stillbirth in fetuses, and impaired mental function and cretinism in children and adolescents [1]. Until the year 2006, of the 130 countries that had performed the IDD survey, 47 countries still had iodine-deficient regions. It was estimated that approximately 31% of the world population had inadequate iodine diets, and the most affected areas were in Southeast Asia and Europe [2]. The most effective way to increase iodine content in the diet is through a universal salt iodization (USI) strategy that involves iodization of salt used by humans, livestock, and food industries. It is considered safe, cost-effective, and sustainable; many developed countries have successfully adopted the program. To determine the iodine status or for monitoring the USI program in a population, the median urinary iodine (mUI) values are determined because urinary iodine (UI) is considered the most immediate indicator of current iodine intake [2, 3]. The mUI values are classified as follows: <20 µg/L for severe iodine deficiency; 20-49 µg/L for moderate iodine deficiency; 50-99 µg/L for mild iodine deficiency; 100-199 µg/L for adequate iodine nutrition; 200-299 µg/L for a slight risk of more than adequate intake in the overall population but likely to provide adequate intake for pregnant/lactating women; and >300 µg/L for excessive risk of adverse health consequences that include iodine-induced hyperthyroidism and autoimmune thyroid diseases [2].
In Malaysia, during the national IDD survey in 1996 and several subsequent studies, Sabah and some rural parts of Sarawak and Peninsular Malaysia were identified as iodine-deficient regions [4-6]. In 1999, USI was enacted in Sabah, while iodine was added to drinking water piped into a few parts of Sarawak, Kedah, Kelantan, Perak, and Terengganu [7]. UI had been tested for health monitoring purposes in these regions at the IDD laboratories of the Ministry of Health (MOH) by using glass test tubes and by digestion using chloric acid and reaction through the Sandell-Kolthoff reaction [8], which is catalyzed by iodine to reduce ceric ammonium sulfate (yellow in color) to the cerous form (colorless) [2]. In 2006, the Institute for Medical Research (IMR) modified the UI quantification method with an application of ammonium persulfate as the digestion agent [9]. Although the digestion was performed in glass test tubes, the Sandell-Kolthoff reaction was carried out in 96-well polystyrene microtiter plates. Thus, the advantages in safety, faster turnaround-time, and reduction in chemical waste and labor costs were achieved. The method thus developed, named the "urinary iodine micromethod" (UIMM) [10] was a modification of the standard WHO UI quantification method [3] and the method developed earlier by Ohashi et al. [11]. UIMM was modified to better fit the limited facilities in small- to medium-scale clinical laboratories with only minor expenditures on additional instruments or consumables. UIMM has now been used for 6 yr in the MOH IDD laboratories and for UI quantification during the 2008 national IDD survey. However, there is a need to evaluate the performance of the UIMM.
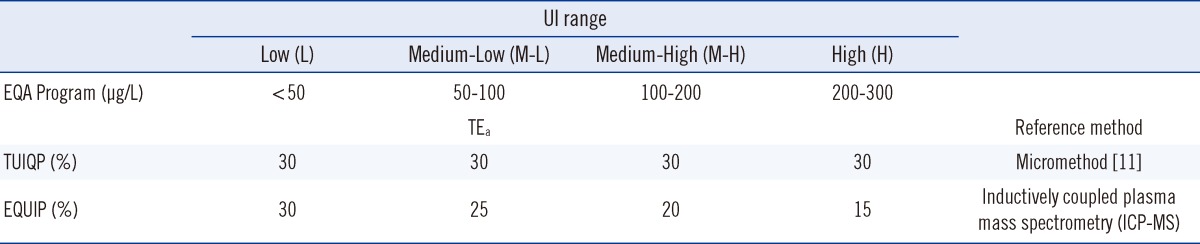
Sigma quality metrics have been applied to evaluate the performance of clinical chemistry tests since the early 2000s [12]. The metrics list 6 Sigma as "world class," 5 Sigma as "excellent," 4 Sigma as "good," 3 Sigma as "acceptable," 2 Sigma as "poor," and 1 Sigma as "unacceptable." In this study, the total allowable errors (TEas) in Table 1 as recommended by the external quality assurance (EQA) providers were used to calculate the Sigma metrics [12]. Total errors for the UI testing in all MOH IDD laboratories were also monitored. The UIMM evaluation was undertaken to identify weaknesses to strategize the internal quality control (IQC) to minimize false negatives and maximize error detection [12]. Ultimately, our goal was to improve laboratory quality management to increase precision and accuracy of the results.
METHODS
1. Data
The IQC and external quality control (EQC) data were obtained from the records of UI assays performed during the 2006 method validation study and the 2008 IDD national survey EQC data.
2. Urine samples
1) For the method validation data
Three IQC urine samples were pooled to estimate the Medium-Low (M-L), Medium-High 1 (M-H1), and Medium-High 2 (M-H2) UI levels (Table 1). The IQC samples comprised M-L (target value: 51±15.50 µg/L), M-H1 (target value: 108±32.40 µg/L), and M-H2 (target value: 149±38.60 µg/L) levels, interassay CVs were analyzed at IMR (n=10).
2) For the 2008 national IDD survey EQC data
Three EQA reference materials were requested from the provider of the Urinary Iodine Quality Program (TUIQP) at the Institute for Clinical Pathology and Medical Research (ICPMR) in Australia, which were used as EQCs for the UI assays and were assayed intermittently. The EQC samples were comprised of L (target value: 46.91±13.52 µg/L), M-H (target value: 135.14±7.06 µg/L), and H (target value: 238.58±17.89 µg/L) levels (Table 1), and they were analyzed in four IDD laboratories (Lab A [n=20], Lab B [n=18], Lab C [n=12], and Lab D [n=6]). IQC samples were obtained from pooled urine samples prepared separately in each laboratory. The 2008 national IDD survey was approved by the Medical Research and Ethics Committee, MOH, Malaysia.
3. Participating laboratories
All UI laboratories within the MOH, namely, IMR, National Public Health Laboratory, Ipoh Public Health Laboratory, and Sabah Public Health Laboratory, participated in this study by running the UI tests on the 2008 national IDD survey samples together with the IQC and EQC samples.
4. UIMM test
Aliquots (250 µL) of potassium iodate standards, IQC samples, and EQC samples were put in glass test tubes and were mixed with 1 mL 1 M ammonium persulfate. The mixtures were incubated for 1 hr at 100℃ and were cooled to room temperature. Thirty microliters of each digested standard, control, and EQC sample was pipetted into a 96-well flat-bottomed polystyrene microtiter plate, and 60 µL arsenious acid solution was added to the wells. The microtiter plate was tapped gently before 30 µL 0.019 M ceric ammonium sulfate was added into the wells. The plate was then incubated at room temperature for 30 min on an orbital microplate shaker; thereafter, absorbance was read at 405 nm by using a microplate reader [10].
5. Data analyses
All formula and charts used in the determination of bias, CV, SD, calculated total error (TEcalc), and the Sigma metrics values were obtained from the published literature [12, 13]. TEcalc values were then compared to TEas values shown in Table 1. The normalized method decision chart was used to depict the Sigma metrics. Spline curves were plotted using Multicalc 2000 software (Perkin Elmer, Waltham, MA, USA) or the software included with the microplate reader (MRX™, DYNEX Technologies Inc., Chantilly, VA, USA).
RESULTS
1. Evaluation of UIMM using method validation data
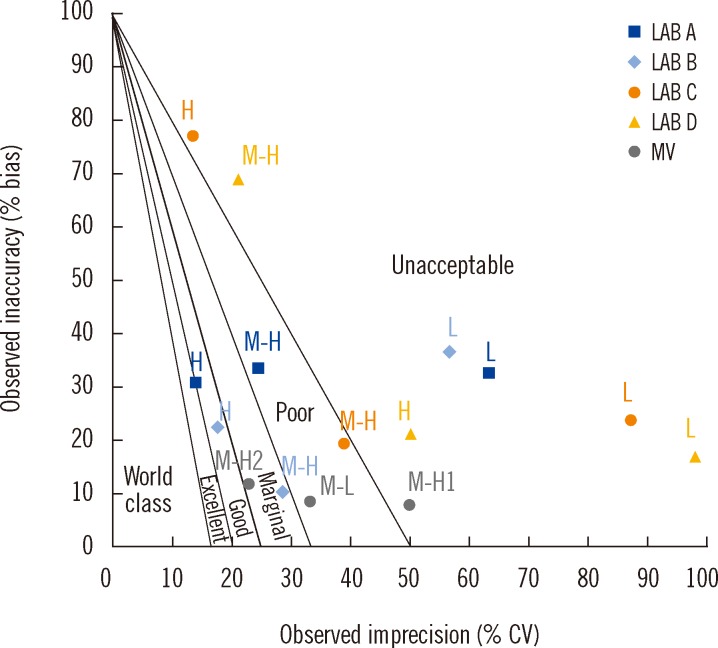
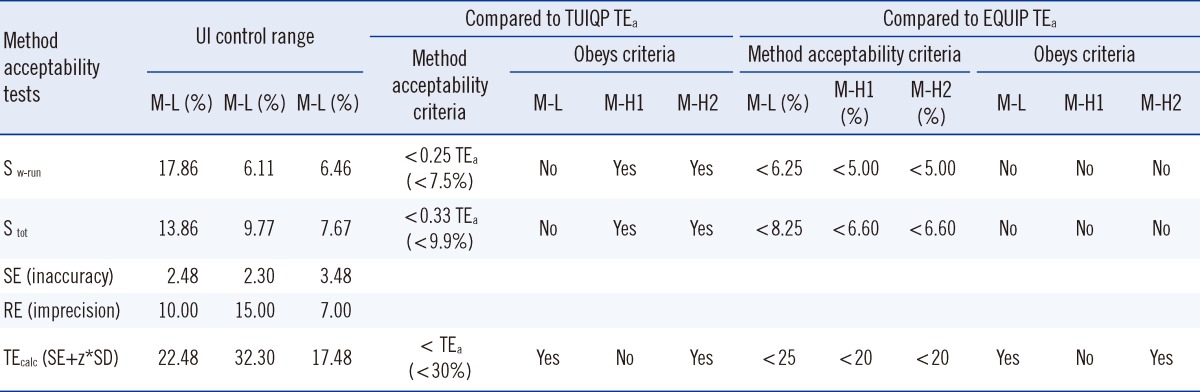
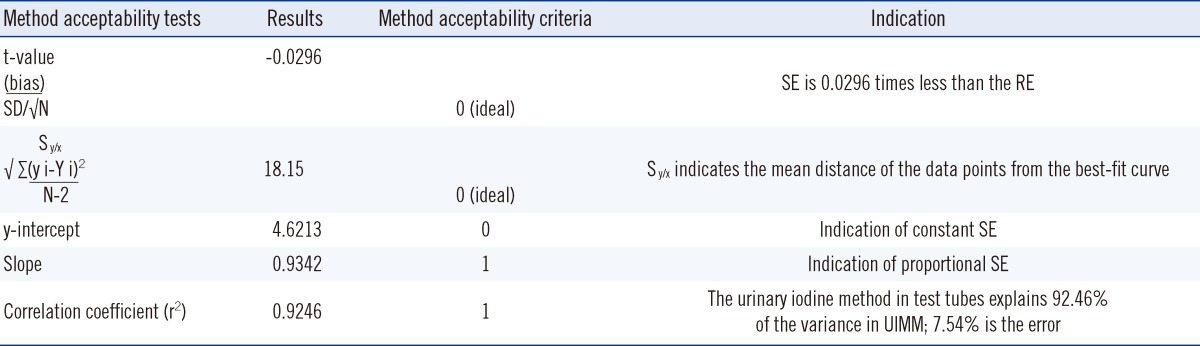
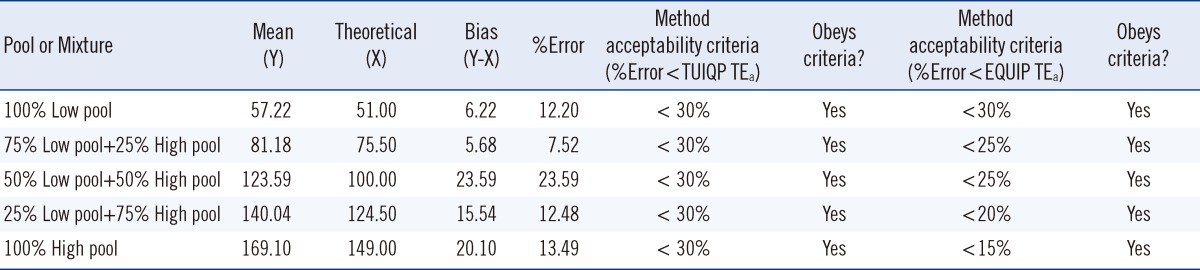
For the method acceptability test criteria check (Table 2), it is shown that by comparing to the TUIQP TEa, the M-H2 control obeyed all criteria, the M-H1 control obeyed two criteria, and the M-L control obeyed only 1 of 3 criteria. When compared to Ensuring the Quality of Urinary Iodine Procedures (EQUIP) program (Center for Disease Control, Atlanta, GA, USA) TEa, M-H1 did not obey any criteria, whereas the other two controls obeyed only 1 of 3 criteria. In Table 3, the UIMM also showed the presence of constant and proportional systematic errors (SEs) and random error (RE). The S y/x and correlation coefficient (r2) results also indicated the existence of SD of data points from the best-fit linear curve and error in the method comparison study [10], respectively. The errors were also quantified from the linearity study [10] (Table 4). It is shown that by comparing with either TUIQP or EQUIP's TEas, the concentrations within the 10-190 µg/L range obeyed all criteria. When the data was used to plot the normalized method decision chart (Fig. 1), the Sigma metrics for M-L, M-H1, and M-H2 controls were 2.75, 1.8, and 3.8, respectively.
2. Evaluation of UIMM using EQC data
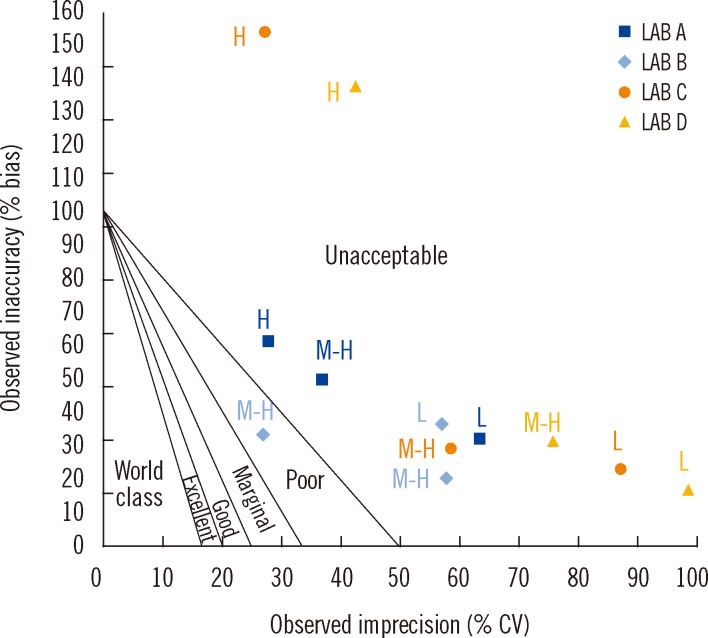
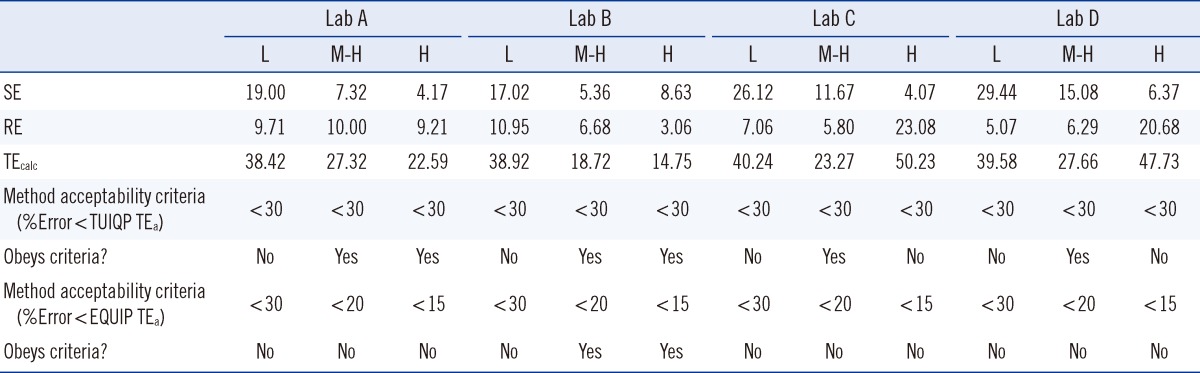
At the L, M-H, and H concentration levels, the UIMM possessed biases (SE or inaccuracy) of -8.20±2.64%, 1.14±8.42%, and -14.01±9.48%, respectively, and CVs (RE or imprecision) of 22.89±5.86%, 9.86±4.37%, and 5.81±2.16%, respectively (Table 5). The TEcalc for the method were 38.42-40.24% for the L level, 18.72-27.66% for the M-H level, and 14.75-50.23% for the H level. According to the TUIQP TEa, none of the laboratories estimated a calculated total error (TEcalc)<TEa for the L level, all laboratories had TEcalc<TEa for the M-H level, and 2 laboratories had TEcalc<TEa for the H level. According to the EQUIP TEas, all laboratories had TEcalc>TEa for the L level, but one laboratory had TEcalc<TEa for the M-H and H levels. As shown in Fig. 1, based on the TUIQP TEa of 30% for all concentration levels, the performance of the 4 laboratories were within Sigma-metrics of 0.85-1.12 at the L level, 1.57-4.37 at the M-H level, and 1.46-4.98 at the H level. Based on the EQUIP TEas, at the same concentration levels, UIMM performance was classed at Sigma metrics of 0.85-1.12, 0.9-2.49, and -1.98 to 1.39, respectively (Fig. 2).
DISCUSSION
The literature describes three different formats that can be used to determine analytical quality in clinical chemistry, namely, allowable bias, allowable SD, and TEa. Allowable bias or inaccuracy sets the limit for SE, allowable SD or imprecision sets the limit for RE, and TEa sets the limit for a combination of RE and SE [13]. In this study, we used the UIMM evaluation method for applying various statistical analyses by using the method validation and EQC data. Method validation is a process to validate a method's capability and acceptability [13]. The imprecision and bias data alone were not adequate for evaluating the performance of the UIMM. Thus, the normalized method decision chart [13] was plotted whereby the imprecision and bias were normalized against the TEas. In this study, we used the TEas for UI that had been listed by the TUIQP and EQUIP, EQA Programs for the UIMM evaluation (Table 1). A method is considered acceptable if the TEcalc in a method performance is less than the medically allowable error (TEa), which is the required quality limit [13]. The calculation of the Sigma metrics is as follows: Sigma-metrics=(TEa-bias) / CV.
1. Evaluation of UIMM by using method validation data
The UIMM is acceptable when compared to the TUIQP TEa because it obeys the majority of the method acceptability test criteria (Table 2). However, when compared to the EQUIP TEa, the UIMM performance was considered unacceptable. Through error quantification tests, the constant and proportional SEs and RE were observed, but in small magnitudes (Table 3). The S y/x and r2 results also showed errors but they were close to the ideal values, indicating acceptable performance. The linearity study exhibited excellent performance with errors values<TEas (Table 4). Linearity of the standard curve was proven for the indicated range of 10-190 µg/L [10]. Curvatures were observed at low (L) and high (H) concentrations; hence, it was suggested that data integration for the concentration outside the range was performed using a spline-smoothed curve. Using the normalized method decision chart (Fig. 1), the performance was found to be poor at the M-L level (2 Sigma), unacceptable at the M-H1 level (1 Sigma), and marginal at the M-H2 level (3 Sigma).
2. Evaluation of UIMM by using EQC data
Although the number of replicates of the EQA samples from the 4 IDD laboratories varied (Lab A [n=20], Lab B [n=18], Lab C [n=12], and Lab D [n=6]), we still used the data because they were the most representative data owing to the uniformity of samples in all laboratories. The IQC rule of rejection of 22s and 13s was used, and duplicates or triplicates of IQC from each level were included in every assay. For the assessment using the EQC data, the 0-200 µg/L standard curve was used in all laboratories.
In Table 5, from the EQC data, poor accuracy (high biases) of>20% was observed in the L UI level in two laboratories, and poor precision (high CVs) of>20% was observed in the H UI level in two laboratories. Lab A and Lab B generally possessed satisfactory biases of<20% and CVs of<11% for all concentration levels. Large biases of 17.02-29.44% were observed in the analysis of the L UI level compared to the M-H and H UI levels in all the laboratories. These data showed that the variability and degree of dispersion of the UI values in the L range (32.80-61.00 µg/L) were the greatest. Thus, the UIMM is not applicable to monitor the UI of the severe iodine-deficient human subjects [11]. Large CVs of 20.68-23.08% in the H level in two laboratories might be due to dilution of the samples to obtain the values within the 0-200 µg/L range for the standard curve. Multiplication of the values with the dilution factor would therefore multiply the existing error in the results. For TEcalc, compared with TUIQP TEas, all laboratories showed poor performance at the L level, whereas all laboratories showed good performance at the M-H level and two laboratories showed good performance in the H level. Compared to EQUIP TEas, Lab B showed good performance (TEcalc<TEas) at the M-H and H UI levels. However, the TEcalcs for the other laboratories were>TEas.
With TUIQP TEa, the method was evaluated (Fig. 1), and showed good performance of 4 Sigma for the H UI level in two laboratories, marginal performance of 3 Sigma on the M-H UI level in one laboratory, and poor performance of 2 Sigma on the M-H UI level in two laboratories. However, the remaining results were in the unacceptable performance region of 1 Sigma. The low Sigma metrics obtained by Lab D might also be contributed from the high CV owing to the small number of sample replicates. The method performance was evaluated using EQUIP TEa (Fig. 2). The critical medical decision level of 100 µg/L for adequate iodine nutrition, covered by the M range; accordingly, the unacceptable performance of<2 Sigma by all laboratories was not satisfactory. Performance of 4 Sigma requires quadruplicate IQC with application of multi-rule or single-rule of 2.5 sec to detect errors. Performance with less than 4 Sigma should be improved by applying as many IQCs as possible, and maximum care should be taken for improvement on the human resource skills to achieve competency, critical instrument maintenance (e.g., micropipettes), and a laboratory strategy plan for quality control [12].
In conclusion, the UIMM performance should be improved to achieve stricter TEas. Application of the multi-rule IQC verification in the IQC planning is necessary to improve the performance. It is helpful to determine Sigma quality metrics for future QC management plans in the UI laboratory.
 XML Download