

 PDF
PDF ePub
ePub Citation
 Print
Print


INTRODUCTION
Each year in the United States (US) alone, there are approximately 1.5 million cases of myocardial infarction (MI), which translates to nearly 600 cases per 100,000 individuals. There are 6 to 9 million urgent care presentations that require evaluation for possible cardiac ischemia, which consumes substantial US healthcare resources. Due to improvements in the management of these patients, from 1999 to 2009 the relative rate of death attributable to CVD declined by 32.7%. However in 2009, CVD still accounted for 32.3% (787,931) of all 2,437,163 deaths, or 1 of every 3 deaths in the US [1].
Based on the patient's electrocardiogram (ECG), MI can be divided into two subtypes: ST segment elevation MI (STEMI) and non-ST elevation MI (NSTEMI). The role of biochemical markers is very different in STEMI vs. NSTEMI. For STEMI patients, biomarkers are prognostic and play a useful confirmatory role for diagnosis. On the other hand, in NSTEMI biochemical markers have a pivotal role in diagnosis, differentiation from unstable angina and guiding management [2].
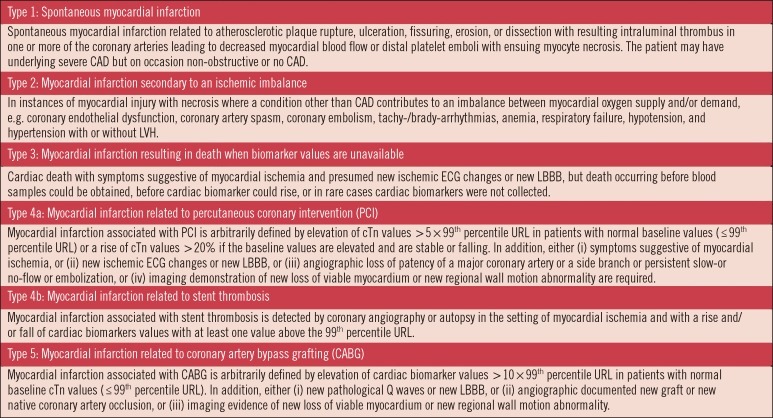
The predominant cause of myocardial necrosis and MI is the acute coronary syndromes (ACS), or type 1 MI [3]. ACS is a continuum of myocardial ischemia ranging from unstable angina with no irreversible cardiac injury to frank MI with large areas of myocardial cell death. The root cause of ACS is unstable plaque within the coronary arteries. Rupture of coronary plaque causes their thrombogenic contents to become exposed to the circulation. This leads to platelet activation, initiation of the coagulation cascade and other physiological effects resulting in myocardial ischemia. A second class of MI, type 2, is related to a supply/demand mismatch resulting from coronary spasm, high or low blood pressure, anemia, arrhythmia or stenosis due to a fixed atherosclerotic lesion [3]. Although ACS is the predominant etiology for cardiac necrosis, it is important to note that there are several other etiologies that also cause myocardial ischemia [3]. As shown in Fig. 1, type 3 MI describes patients who suffer from cardiac sudden death, and types 4a, 4b, and 5 MI are related to interventional procedures. Regardless of the pathobiology, myocardial necrosis due to myocardial ischemia is designated as MI [3, 4]. In this review, the focus will be on types 1 and 2 MI because these patients usually present to the emergency department or urgent care, and biochemical markers are the cornerstone for diagnosis and management.
The biochemical markers myoglobin and the MB isoenzyme of creatine kinase (CK-MB) are increased in plasma after myocardial injury and have been utilized clinically as cardiac markers of ischemia since the late 1970s. However, these early biochemical markers have gradually fallen out of favor and in the 1990s the cardiac biomarkers field emerged into what may be termed the 'era of cardiac troponin'. Currently cardiac troponin (cTn) is the preferred marker for diagnosis and management of suspected MI patients [3, 5].
Troponin (Tn) is a ternary structural protein complex that plays an essential role as a calcium sensitive 'molecular switch' in striated muscle contraction [6]. The three members of the Tn complex are designated TnC, TnI, and TnT. The TnC subunit binds intracellular calcium; the calcium-binding signal is transmitted to the thin filament by the other two Tn subunits; TnI is the inhibitory subunit and TnT acts as the tropomyosin-binding subunit. Cardiac specific isoforms of TnI and TnT are expressed exclusively by cells in the myocardium; this exclusivity is what makes TnI and TnT so special among cardiac biomarkers. These isoforms are termed cardiac TnI (cTnI) and cardiac TnT (cTnT). The mechanism by which cTnI and cTnT are released into circulation has not been fully elucidated but possibilities suggested include normal turnover of myocardial cells, apoptosis, cellular release of cTn degradation products, increased cellular wall permeability, formation and release of membranous blebs, and myocyte necrosis [7]. Although early cTn assays were considered a replacement test for CK-MB, the biomarkers are not equivalent [8]. In fact, 12% to 39% of patients who were negative for CK-MB, i.e. below the biomarker's MI cutoff, had cTn results classified as positive for MI [8]. These data raised the question as to whether discordant cTn and CK-MB results were cTn false positives, or if cTn represented a more clinically sensitive indicator of cardiac necrosis. Subsequent meta-analyses answered this question by showing that patients with positive cTnT and cTnI results indeed had a higher short term risk for adverse outcomes [9, 10]. These data contributed to cTn's evolution into the preferred cardiac marker for the diagnosis of MI as well as other clinical applications [3, 5]. It is noteworthy that cTn is elevated in a great many other conditions involving the heart [11] and therefore an elevated cTn is a finding that represents the likely occurrence of myocardial necrosis and does not in and of itself provide any indication of the etiology [12]. Therefore a most important nuance is that cTnT and cTnI are cardiac specific markers, not disease markers (e.g., MI).
Here we will offer insights about various laboratory medicine aspects of cTn and discuss its utilization. An important resource that should be considered compulsory reading for laboratory practitioners is the "American College of Cardiology Foundation (ACCF) 2012 Expert Consensus Document on Practical Clinical Considerations in the Interpretation of Troponin Elevations" [13]. This document was a collaborative effort between laboratory medicine through the American Association for Clinical Chemistry and clinical representation from the American College of Chest Physicians, American College of Cardiology (ACC), American College of Emergency Physicians, American Heart Association (AHA) and Society for Cardiovascular Angiography and Interventions. It is noteworthy that the AHA and ACCF are currently in the final phases of developing guidelines for diagnosis and management of NSTEMI. Once these guidelines are promulgated their knowledge must also be considered compulsory.
INTERPRETATION
More than 30 yr ago a report from the International Society and Federation of Cardiology and the World Health Organization defined the criteria for the diagnosis of ischemic heart disease [14]. In this document the diagnosis of acute MI was based on fulfilling 2 of the following 3 criteria: 1) clinical history, 2) ECG findings, and 3) temporal changes in serum enzymes. A diagnosis based on considering 2 of these 3 criteria equally was necessary at the time because of broad variation in clinical presenting symptoms, the fact that the ECG is frequently confounded and because the biochemical markers available in the 1970s were not specific for myocardial injury. The discovery of more cardiac specific biomarkers, cTnT and cTnI, in the early 1990s completely changed this dynamic [15].
Based on evidence available from the 1990s, the National Academy of Clinical Biochemistry promulgated the need for incorporation of blood cTn measurements into the diagnosis of MI [16]. This statement initiated the notion that any amount of myocardial necrosis caused by ischemia should be labeled as MI. The evolution of analytically sensitive and specific cTn assays measurement technologies necessitated the re-evaluation of established definitions of MI. Shortly thereafter in 1999, a joint committee of the European Society of Cardiology (ESC) and the ACCF was convened to re-examine the MI definition [12]. The result was a consensus that the preferred biochemical marker for detecting myocardial necrosis was cTn and that a maximal concentration of cTnT or cTnI that exceeded the operative threshold on at least 1 occasion during the first 24 hr after an index clinical ischemic event indicated MI [12]. The operative threshold for MI that was defined by consensus at this conference was the 99th percentile of the values for a reference control, which of course is linked to a potential false positive rate of 1%. In 2007 this definition was updated to include a rise and/or fall in biomarkers (preferably cTn) [4], and in 2012 a further update was published by a global task force [3].
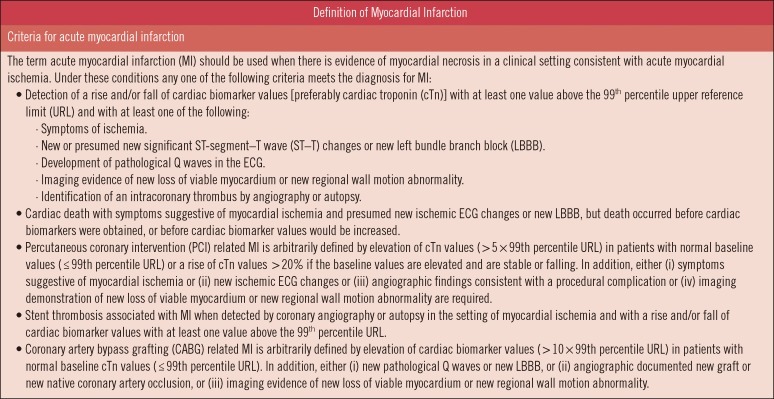
Fig. 2 displays the universal definition of MI which states that the term should be used when there is evidence of myocardial necrosis in a clinical setting consistent with acute myocardial ischemia [3]. With the appropriate clinical and diagnostic picture, detection of a rising and/or falling pattern of cTn with at least one value above the 99th percentile of a reference control population meets the criteria for MI.
EVOLUTION OF cTn ASSAYS
The 2000 Global Task Force redefinition of MI [12] challenged the cardiac markers field to improve the analytic requirements of cTnI and cTnT assays. Instead of cTn being considered a replacement test for CKMB, cTn was thrust into the central role of being virtually essential for the diagnosis of MI. Further, the redefinition document recommended an important analytical characteristic to help avoid patient misclassification. The recommendation was that cTn assays have a 10% total CV at the 99th percentile cutoff. At the time that this redefinition was published, no available cTn assay could meet the requirements specified [17]. This necessitated the development of more sensitive cTn assays with limits of detection and quantification in harmony with the MI redefinition. Analytic based guidelines were published that included recommendations for characteristics such as the amino acid targets, specimen type and stability in addition to specifying the imprecision [18]. As a result, there has been an evolution of cTn assays having characteristics that meet or exceed these recommendations. A current listing of the characteristics of clinical and research assays is available on the International Federation of Clinical Chemistry (IFCC) website [19].
CLASSIFICATION OF cTn ASSAYS
Unfortunately, the terminology used to describe the evolving generations of cTn assays remains haphazard and no universally accepted nomenclature for assays currently exists. Terminology such as 'Ultra', 'high sensitivity (hs)', '4th generation', 'guideline compliant' and so on have been used for naming, often due to marketing considerations, without regard to assay characteristics. In summary, assays coined "Ultra" or "hs-cTn" do not necessarily represent superior performance. Assays with many of these designations may be updated versions of earlier assays, thus they required a different "flashy" trade name to distinguish them from earlier versions of the tests. Or these assay may indeed be improved, next-generation assays with better performance characteristics that are able to reliably measure increasingly low levels of cTn. Information and evidence collated on the IFCC website are helpful in determining actual documented assay performance.
One system of nomenclature for different cTn assays which involves assigning them a specific designation based on their analytical performance and their ability to reliably measure Tn in normal populations, has been recently published [20]. With this proposed system assays are classified as conventional, contemporary sensitive, high sensitivity or super sensitive with an indication of evidence for use in MI diagnosis and risk stratification. However the very highest performing 'super sensitive assays' have not been adequately validated for these applications. The main issue with this and other systems is that 'contemporary' is a term that will change with time. A more descriptive and reproducible system for designating Tn assays would be based on their ability to reliably detect a proportion of a normal reference control cohort. For example, the contemporary sensitive assays would be 10% assays because they can reliably measure this proportion of normal. High sensitivity assays would be designated as assays able to reliably measure >50% of normal subjects, and super sensitive assays would be able to quantify 95% of a normal cohort. A common sample cohort of carefully characterized normal reference control individuals would be ideal for this purpose.
IMPLICATIONS OF INCREASINGLY SENSITIVE cTn ASSAYS
As cTn assays with higher analytical sensitivity have evolved, it has become possible to reliably measure values in the region of the 99th percentile of normal populations. This ability contrasts with earlier 'conventional' assays, in which reliable measurement of cTn values was possible only at levels several fold higher than the 99th percentile. The ability of sensitive cTn assays to detect smaller quantities of cTn release provides earlier reliable detection of clinically important cTn elevations. This allows for more rapid diagnosis of MI compared to previous conventional assays [21, 22].
Initially there was significant concern among the laboratory and clinical practice communities that sensitive assays with their lower detection limits confused the clinical picture in patients. The issue is underscored by quotes such as "when troponin was a lousy assay it was a great test, but now that it's becoming a great assay, it's getting to be a lousy test." [23].
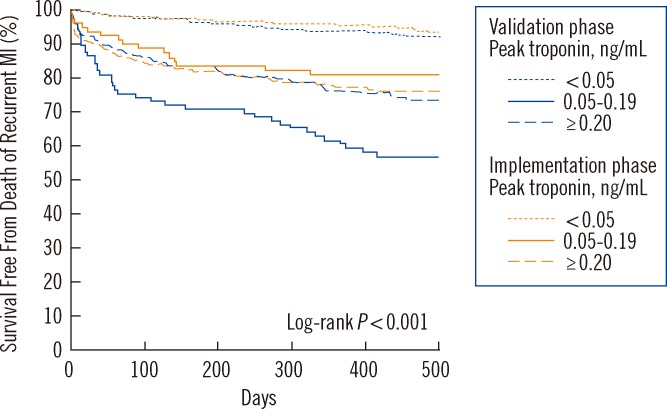
Are more sensitive assays picking up clinically insignificant Tn release, or does detection contribute to improved patient outcomes? Stated differently: Do patients with signs and symptoms of MI have better outcomes if the 99th percentile is utilized as the MI cutoff, versus use of a higher Tn cutoff like that necessary with earlier cTn assays? Mills et al. [24] examined this question by evaluating the clinical impact of replacing a conventional cTnI assay with a cutoff of 0.20 ng/mL with a new more sensitive cTnI assay having a cutoff of 0.05 ng/mL. In this study suspected MI patients were analyzed in three strata based on their cTnI results: 1) <0.05 ng/mL, below the 99th percentile of the new sensitive assay, 2) between 0.05 and 0.19 ng/mL, and 3) ≥0.20 ng/mL, the cutoff for earlier conventional assay's decision limit. The study design included two phases: the first was the validation phase, in which patients (n=1,038) had the sensitive cTnI measurement, but the previous conventional assay's MI cutoff of 0.2 ng/mL was used for decision making. The second phase was implementation; in which the 99th percentile value of <0.05 ng/mL was used as the MI cutoff for these patients (n=1,054). Event-free survival at 1 yr (i.e. patients absent recurrent MI and mortality) was the measured outcome. Fig. 3 shows that outcomes in the validation phase for the patients with levels <0.05 ng/mL were low at <7% and event-free survival of patients with results >0.20 ng/mL was about 24% at 1 yr. However, patients who had cTnI values between 0.05 and 0.19 ng/mL were at highest risk with 1 yr events at -40%, about 2-fold higher compared to the >0.20 ng/mL strata. This is possibly secondary to lower rates of intervention and risk modification. In the implementation phase when the sensitive assay's cutoff of <0.05 ng/mL was used for decision making, Fig. 3 shows that the 1-yr outcomes for both the <0.05 and >0.20 ng/mL strata were virtually identical to the validation phase. However, the 0.05 to 0.20 ng/mL strata had outcomes that were ~50% (39% down to 21%) improved from in the implementation phase. Therefore, implementation of the lower 99th percentile diagnostic cTnI threshold was associated with major reductions in 1-yr mortality and recurrent MI [24]. Patients with signs and symptoms of MI have better outcomes if a sensitive assay's 99th percentile is utilized as the MI cutoff, versus use of a higher Tn cutoff such as that necessary with earlier cTn assays.
Although sensitive cTn assays do present an advantage compared to higher cut point conventional assays, the benefit of higher sensitivity assays compared to sensitive assays in the context of MI diagnosis is unclear. In one comparative study, the area under the time-dependent ROC curve was not different between these assays, indicating that the tests were essentially equivalent for making the diagnosis of MI [22]. Highly sensitive assays may, however, cause a diagnostic dilemma as to what to do with newly detectable elevations that do not exceed the 99% MI cutoff. Outcome-based studies in this cohort will be needed to examine this point.
DEFINING A RISE AND/OR FALL IN cTn
Initially, the joint committee of the ESC and ACC in 2000 predicated the redefinition of an acute or evolving MI on a single cTn value exceeding the 99th percentile of a reference control population [12]. Presumably because of specificity issues involving elevations in cTn that were not MI, the definition was revised in 2007 [4] and 2012 [3] to include a typical rise and/or fall of biomarkers of myocardial necrosis, i.e., cTn, in addition to at least one value exceeding the 99th percentile of a normal reference population. However, neither of these later task force documents explicitly stated how a rise and/or fall should be defined. Approaches examining relative temporal changes or absolute changes in levels have been postulated as ways to mitigate diminished specificity.
RELATIVE CHANGES FOR ACUTE MI DIAGNOSIS
One strategy to more quantitatively express the rise and/or fall in cTn is to calculate a percentage change over time, termed the relative percentage change. For example, for a presentation cTn of 4.0 ng/L followed by a serial 2-hr cTn of 9.0 ng/L, the relative percentage change equals [(9-4)/4]×100=125 (%). Determining the percent change that fulfills criterion for a "rise and/or fall" has been a topic of active discussion. However, there is general agreement that the relative change used for interpretation of acute MI must exceed the natural biological variance plus the analytical variability of the measurement.
Most studies examining the relative percentage change have used a baseline measurement at presentation and follow-up cTn measurement between 1 and 6 hr later [2, 16]. Literature reviews have demonstrated that cTn elevations occur in many clinical situations besides ischemic cardiac damage [11, 25], and it is important to note that in addition to acute MI, other acute cardiac conditions including dysrhythmias and acute decompensated failure may also produce substantial temporal % changes in cTn.
Numerous relative percentage change values have been reported that reflect biological variability as well as both the reactivity of reagents with the cTn antigen(s) and the method imprecision. A general reference value of 15-20% was suggested for the relative percentage change as part of guidelines for diagnosis of acute MI [2, 16]. A more recent paper quotes relative percentage change thresholds of 46% for an increasing pattern or 32% for a decreasing cTn on the contemporary sensitive Centaur Ultra-TnI method [26]. A study that examined the hs-TnT assay utilized ROC curve methodology to determine optimal relative percentage change values [27]. Importantly, these authors accounted for the time differences in their determinations; they reported a relative percentage change value of 117% from presentation to the 3-hr sampling and 243% from presentation to the 6-hr sampling. In this study the 4th generation cTnT measurement (cut point 13 ng/L) was initially negative (<10 ng/L) and then converted to positive (≥30 ng/L). This choice of reference standard may well have biased the study towards needing a high relative percentage change for the hs-TnT assay [27].
Use of a cTn relative percentage change of ≥20% has been tested in suspected ACS patients with sensitive assays and was found to have significantly increased specificity for acute MI [28, 29]. Diagnostic specificity was also increased using the hs-TnT relative change values determined using ROC curves [27]. However, there is an important tradeoff because use of relative change in cTn values reduced sensitivity [28, 29] and opens the possibility of misclassification of a large number of patients at increased risk.
Using a specified relative percentage change value involves a complicated balance between diagnostic sensitivity and specificity. Also, the cTn release kinetics is unpredictable and variable in many NSTEMI cases, further confounding use of specific relative percentage change values. In addition, the magnitude of the relative percentage change is time dependent; relative change more than doubled when 0 to 6 hr sampling was used compared to 0 to 3 hr sampling [27], and therefore collecting samples at specific times is implicit for interpretation.
ABSOLUTE cTn CHANGE AND MI DIAGNOSIS
Absolute change in cTn involves comparing the cTn concentration at patient presentation with the value in a second sample typically collected either one or two hr later. An example of absolute change would be: presentation cTnT=5.0 ng/L, and a 1-hr cTn=12.0 ng/L; the absolute change is the difference=7.0 ng/L. The objective of an absolute cTn change is early MI diagnosis/rule out of MI, or risk assessment. Of interest, the evidence so far indicates that there is not a substantial difference between sampling at 1 hr or 2 hr after patient presentation and using the absolute increase strategy with a sensitive cTnI method (Ultra) or hs-TnT [30].
An algorithm derived for clinical diagnostic use of hs-TnT [31] will be discussed in section 10 below.
COMPARING THE USE OF RELATIVE VS. ABSOLUTE CHANGE FOR DIAGNOSIS OF MI
Contrasting the relative percentage change strategy and absolute change strategies with simple examples can remove confusion and add insight into interpretation of cTn temporal patterns. An illustration for the hs-TnT method demonstrates this point. If the presentation cTnT is 13 ng/L (the hs-TnT cutoff) and the 1-hr cTn is 16 ng/L, then the absolute change is 3 ng/L, the relative percentage change for this same example is (3/13)×100=23 (%). If the threshold is 25% for relative percentage change, then this case would be negative for acute MI. However, with the absolute change strategy, this case would be in the observational zone [31]. This case illustrates that higher baseline cTn values may have a confounding impact on relative percentage change. Consider a second illustration where the presentation hs-cTnT value is 150 ng/L and the 1 hr value is 170 ng/L; here the absolute change is 20 ng/L, and the relative percentage change is (20/150)×100=13.3 (%). The quantity of cTnT released is greater than in the illustration above; the patient would be classified as negative using a relative percentage change threshold of 25%. However, the patient would rule in for MI with the absolute method. These examples show that in situations where the patient presents with low baseline cTn levels, relative percentage change can fluctuate dramatically with very small absolute changes. Therefore relative percentage change has a large dependence on the presenting cTn value; while the absolute value is not dependent on the cTn concentration at patient presentation. Evidence comparing the relative percentage change and absolute change strategies indicates that the absolute strategy is superior in the early hr after patient presentation [30].
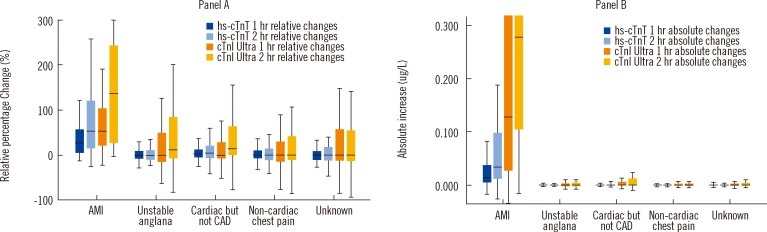
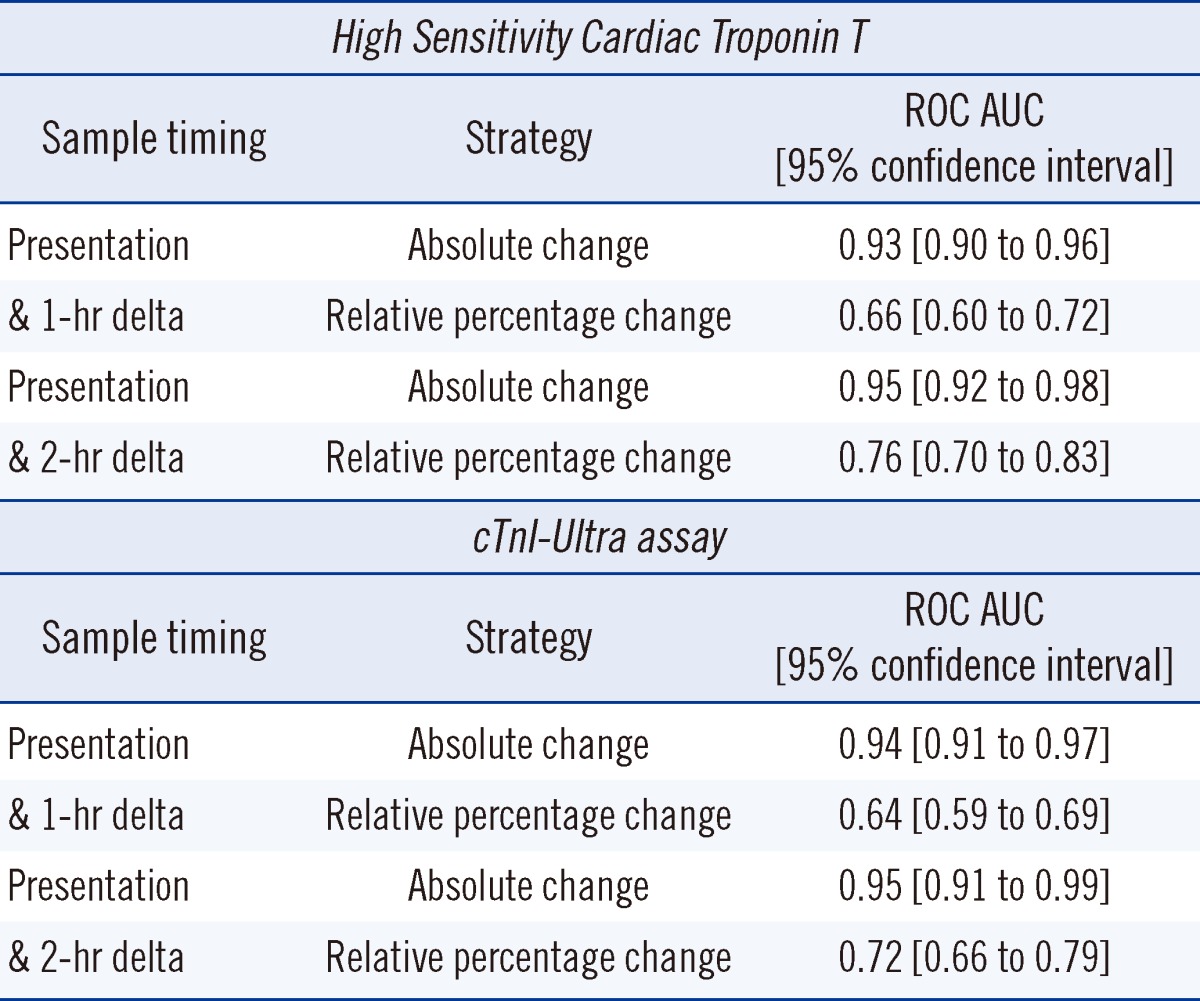
A recent study compared the accuracy of MI diagnosis for both the relative percentage change and absolute change strategies using both the hs-cTnT (Roche Diagnostics, Basel, Switzerland) and the cTnI-Ultra method (Siemens Healthcare Diagnostics, Erlangen, Germany). This multicenter study included a cohort of 836 patients presenting to the emergency department with symptoms suggestive of acute MI [30]. Sampling for the study hs-cTnT and cTnI-Ultra measurements were collected at presentation and then 1 and 2 hr later. Final patient diagnosis of MI was adjudicated by 2 independent cardiologists, who reviewed all available medical records but were blinded to the hs-cTnT and cTnI-Ultra measurements. The prevalence of acute MI in the study population was 13% [30].
As shown in Fig. 4, the difference in overlap between MI and other conditions for the relative percentage change (Panel A) and absolute change (Panel B) was striking. The ROC area under the curves (AUCs) listed in Table 1 for the strategies show that the absolute change is dramatically better to diagnose MI compared to the relative percentage change. All differences between the ROC AUC comparisons between the relative percentage change and absolute change strategies were highly significant (P<0.001) [30].
LEVERAGING HIGH-SENSITIVITY ASSAYS TO MAKE EARLIER MANAGEMENT DECISIONS
The use of new cTn technology and approaches for evaluating the rise and/or fall of cTn for the diagnosis of MI could play an important role in the improved management of acute-onset chest pain presenting to the emergency department. Holding patients to rule out of MI often places significant burden on emergency departments while discharging patients home with NSTEMI is associated with a 2-fold increase in mortality [31]. Reichlin et al. [31] combined either high sensitivity or sensitive cTn assays with the use of absolute change cut-offs to develop a novel strategy for early diagnosis or rule out of MI in patients presenting with acute-onset chest pain.
In this study, 872 patients who presented to the emergency department with signs and symptoms of suspected MI were enrolled. The first half of the cohort (n=436) had serial cTnT collections and underwent traditional management. Data from the first half were used as an algorithm derivation data set to determine the appropriate cut-off points for presenting levels and absolute changes in later samples. Cutoffs were derived that allowed for 100% sensitivity after 1 hr (100% negative predictive value) for MI to identify a group of patients for whom MI could be safely ruled-out and who could be sent home from the emergency department. The authors determined rule-out criteria to be defined for their study as initial hs-cTnT level lower than 12 ng/L and an absolute change over the first hr of <3 ng/L. Rule-in criteria was set as initial hs-cTnT level higher than 52 ng/L or absolute change over the first hr of >5 ng/L. Patients who did not fit the rule-out or rule-in criteria were held in the emergency department for observation. This algorithm was then validated in the second group of 436 patients; these patients were followed up at 30 days and 3, 12, and 24 months after presentation to determine if patients sent home had an elevated risk of death [31].
Results showed that 259 of the 436 (60%) patients could be ruled out for MI after 1 hr; 67 patients (17%) were ruled in, and the remaining 101 patients (23%) fell in between the two cut-off points and required additional observation in the emergency department. Of these patients, 8 (8%) were subsequently determined to have suffered from a MI.
Follow-up survival rates at 30 days were 99.8%, 98.6%, and 95.3% for the rule-out, observation, and rule-in groups, respectively. These data confirmed the usefulness of this algorithm for risk stratification. Subsequent 24-month follow-up showed a continuation of this trend with survival rates of 98.1%, 89.1%, and 85.4% for the respective groups.
While these results are exciting, they demand replication with the hope that a new algorithm-based tool may provide the opportunity for stratification of risk with earlier triage, optimizing both patient care and efficiency of the healthcare system [31].
NATRIURETIC PEPTIDES: B-TYPE NATRIURETIC PEPTIDE (BNP) AND AMINO-TERMINAL PRO B-TYPE NATRIURETIC PEPTIDE (NT-proBNP)
The natriuretic peptides BNP and NT-proBNP are also useful for risk assessment in suspected MI patients. BNP represents the active hormone and when it is released from myocytes acts to reduce hemodynamic stressors such as wall stretch through natriuresis, vasodilation, inhibition of the renin-angiotensin-aldosterone axis and sympathetic nervous system [32, 33]. NT-proBNP, on the other hand, is an inactive co-metabolite of the common intracellular precursor [34]. BNP and NT-proBNP are predominantly released from the cardiac ventricles in response to hemodynamic stresses such as wall stretch or tension. Analytically, the measurement of NT-proBNP is advantageous compared to BNP as it is more stable after collection and upon longterm freezing; NT-proBNP also has a longer biological half-life [34]. As a result of the greater frozen stability, most epidemiological studies have examined NT-proBNP for prognostic studies and it will be the focus here.
Although BNP and NT-proBNP are most commonly associated with a clinical role in the diagnosis or rule-out of congestive heart failure, they have been evaluated for use in MI for prognostication, risk stratification, and rule-out of ACS in low-risk patients [2, 16]. Gene expression of this molecule is up-regulated in the presence of myocardial ischemia and thus a rational mechanism exists for its elevation in this setting, even in the absence of hemodynamic changes [35].
INCORPORATION OF NT-proBNP INTO DIAGNOSTIC MODELS FOR RULE-OUT MI
NT-proBNP's ability to indicate structural heart disease along with its correlation with ACS, infarct severity and prognostic implications post-MI confer the potential for its use in a variety of roles in the evaluation and management of this disease process [36]. NT-proBNP's use in combination with cTn has been shown in studies to improve the diagnostic ability of clinicians to differentiate between MI, unstable angina, and non-cardiac causes of chest pain [36]. cTn is the most heart-specific marker of myocardial damage, but NT-proBNP has been shown to have slightly better prognostic sensitivity [37, 38]. The incorporation of this marker into an algorithm to examine ACS reportedly adds to the sensitivity of a single cTn collection and allows for better negative predictive value [36]. Although it is interesting, these data are in need of confirmation in larger studies before routine use is appropriate.
In low risk patients, combining cTn and NT-proBNP (or perhaps BNP) in a "rule-out" biomarker based model may provide the opportunity to safely discharge these patients without the current standard of care, stress test, saving the individual patient and healthcare system much aggravation and cost [38].
USE OF NT-proBNP AS A MARKER OF PROGNOSTICATION
NT-proBNP has shown promise as a valuable marker of adverse outcomes in patients presenting with MI [33, 36]. In a large 70,000 patients cohort presenting with MI, NT-proBNP was measured. Patient results were divided into quartiles, and there was a stepwise increase in in-hospital mortality from 1.3% in the lowest quartile to 11.2% in the highest quartile even after controlling for age, creatinine, heart failure, and shock [39]. A meta-analysis of 12 studies that included patients presenting to the hospital with NSTE ACS showed that risk of death was 4.89-fold greater in those patients with elevated NT-proBNP levels on admission [33].
CONCLUSIONS
The cardiac biomarkers cTnT, cTnI, BNP, and NT-proBNP provide important information for clinicians by assisting in the guidance of diagnostic, prognostic, and treatment decisions for patients presenting urgently with signs and symptoms of MI. cTnT and cTnI have evolved through several assay revisions and currently the sensitive and high sensitivity versions of these assays are the best available tests for clinical use in MI diagnosis. These laboratory tests will become of increasing importance throughout the world and particularly in Southeast Asia with the changing demographics and healthcare landscape. The growing worldwide epidemic of obesity and diabetes mellitus will result in more patients presenting to the emergency department with the diagnostic dilemma of MI versus other causes of their signs and symptoms. Rapid and accurate diagnosis, risk stratification, and management decisions will continue to be aided by biomarkers. They play an invaluable role in providing effective care while minimizing healthcare costs.
 XML Download