

 PDF
PDF ePub
ePub Citation
 Print
Print


Many epidemiological studies and screening programmes overcome the problems associated with the transportation of physiological specimens by using filter paper as a matrix for the collection and storage of cellular tissue and body fluids [1-6]. The ability to store dried blood for later analysis would be a valuable diagnostic tool in areas that have limited access to laboratory facilities. We investigated the clinical usefulness and stability of urea in dried blood specimens collected and stored on filter paper. The study was given ethical clearance by the institutional ethics committee.
We collected 75 blood samples that were kept in anti-coagulant-coated vacutainers (for one hour) from the outpatient collection counter at the Laboratory Medicine, All India Institute of Medical Sciences (AIIMS). An aliquot of each of the blood samples was immediately analyzed for urea levels, while the remainder of the blood was used for spotting on filter paper. We generated multiple spots by dripping single drops of blood (~10 µL) on 3M Whatman filter paper (Whatman International Ltd., Maidstone, UK). After the blood spots dried, the filter paper discs were stored in low-gas-permeable, zip-lock plastic bags and stored at 37℃ or at 4℃.
We tested the efficacy of (1) phosphate buffer saline with 1% Tween (PBST), (2) 0.9% sodium chloride, and (3) 5% trichlolroacetic acid (TCA) for the extraction of urea from the dried blood spots (DBSs). For this, one 4.5-mm diameter disc was punched with a manual punch, out of a DBS, and each disc was placed in an uncoated microtiter plate well. Each well was filled with 100 µL of one of the extraction agents, and the plate was incubated overnight (for 10-12 hr) at 4℃. The microtiter plates were placed on an environ shaker (Lab Line Inc., Melrose Park, IL, USA), and the contents mixed at 100 rpm for 1 hour before, and for 1 hr after incubation.
In this study, 5% TCA was the best agent for urea extraction without elution of hemoglobin. Urea analysis was performed using a commercially available kit (UV GLDH-method; Randox laboratories Ltd., Crumlin, UK) [7]. For urea estimation, plasma was added to the urease reagent in the phosphate buffer. The final absorbance was read at 600 nm (OD600) on a spectrophotometer (Spectronic Instruments Inc., Rochester, NY, USA). For dried blood urea estimation, 50 µL of the extract was added to the commercially available enzymatic reagent (Randox; Randox laboratories Ltd., Crumlin, UK). The reaction mixture was stirred and incubated at 37℃ for 15 min and measured at 600 nm using a whole-blood zero standard as blank.
We compared the urea levels of the DBSs with the urea levels of the fresh plasma samples as measured on the day of blood collection. The urea levels of the fresh plasma samples varied between 8 (2.85) and 230 (82.11) mg/dL (mmol/L). Mean±SD urea levels in plasma and the corresponding DBSs were 34.13±36.49 (12.18±13.03) and 34.87±33.47 (12.45±11.95) mg/dL (mmol/L), respectively (P=0.475). Linear regression analysis was used to assess the relationship between DBSs and plasma samples collected simultaneously. Intra-class correlation was calculated to estimate the limits of agreement. The urea levels obtained by the 2 methods were well correlated. Regression analysis reported an r-value of 0.97 and an intra-class correlation value of 0.96. The mean urea recovery from dried blood was 102.2% on the day of sample collection. The mean intra- and inter-assay coefficients of variance for urea in DBSs were 4.2 and 6.3%, respectively.
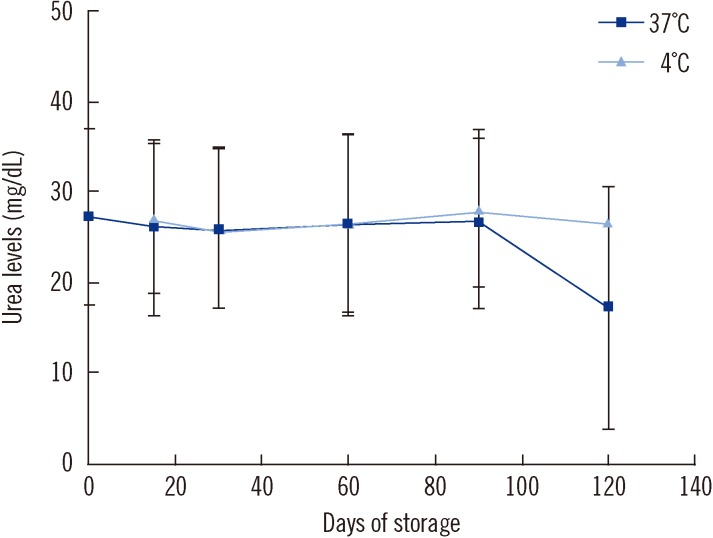
To assess the stability of urea in the DBSs, filter paper discs were punched from 20 of the DBSs, and the urea level of each DBS was estimated at 0, 15, 30, 60, and 90 days. We found that the urea levels remained stable for up to 120 and 90 days in DBSs kept at 4℃ and 37℃, respectively. The level of urea declined by 36% between 90 and 120 days in DBSs stored at 37℃ (Fig. 1).
To assess the effect of hematocrit on the level of urea in dried blood samples, we prepared a blood-based control by mixing washed red blood cells with serum, which had known urea levels (40-120 mg/dL). The hematocrit concentration of our samples was 30%, 40%, and 50%. This blood was spotted on filter paper and dried, and the urea level of each DBS determined in the same way as described earlier. There was no statistically significant difference in the urea level of blood with different hematocrit concentrations (rANOVA (P=0.867 for 40 mg/dL of urea and P=0.054 for 120 mg/dL of urea).
A previous study that estimated urea levels in DBSs used an extraction method of 0.9% (w/v) saline [8]. This method had 2 problems. First, the repeated analysis of serum-based calibrators showed elevated urea levels when compared to the actual levels. Second, it showed the presence of hemoglobin in eluate, without any interference in the estimation of urea levels from DBSs. The method described in the present study used a blood-based calibrator throughout, and no elution of hemoglobin occurred when 5% TCA was used as extraction method. Therefore, the method used in this study has a better analytical performance than the method previously described.
We found that changes in the hematocrit concentration between 30-50% did not affect the dried-blood assay. A wide range of blood samples can therefore be screened with the method that we developed. Furthermore, the stability of urea in DBSs for up to 90 days at ambient temperatures of 4℃ and 37℃ make this method applicable for sample collection over long periods of time.
 XML Download